Traders heavily rely on various indicators to recognise and predict particular market movements to plan out their trades. And the Triple Top pattern is arguably among the most popular ones.
The Triple Top pattern, also know as the Triple Top Reversal chart pattern, is used in technical analysis to predict a potential reversal of an asset’s price movement.
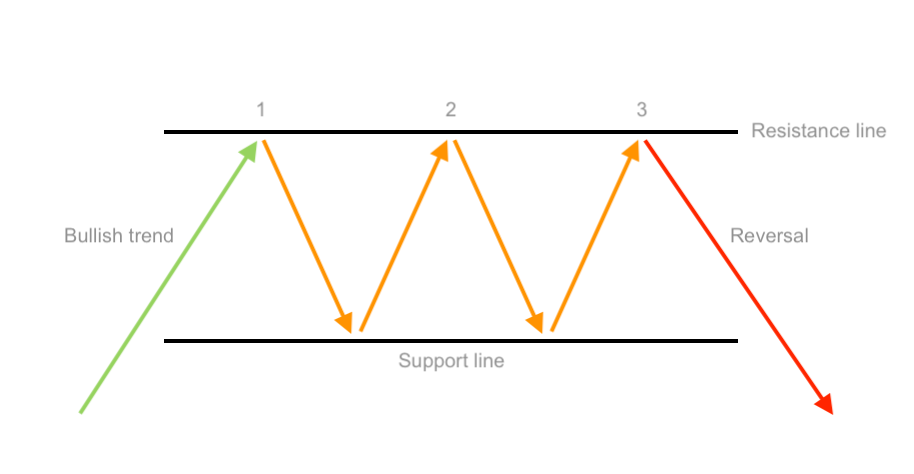
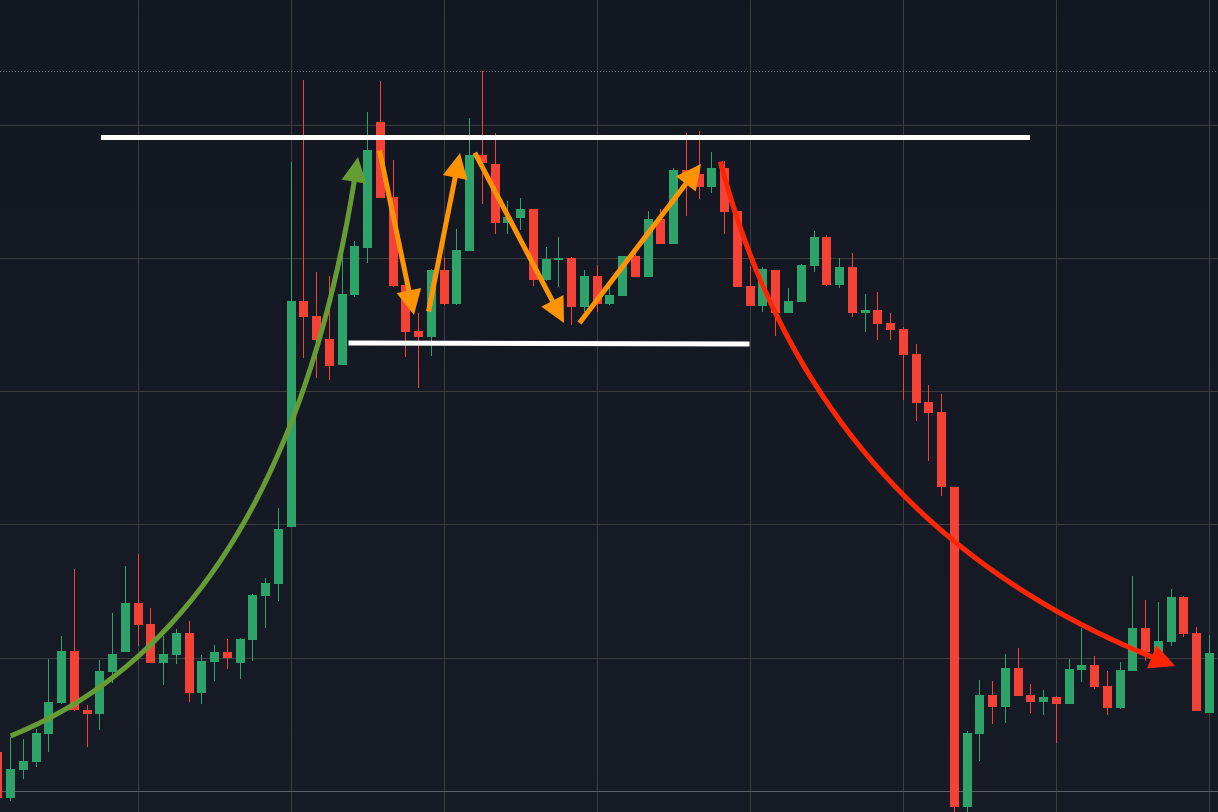
Resembling three peaks with a following downtrend, it is considered a bearish pattern that may indicate that the rally of an asset has reached its climax, and subsequent price drops could be expected.
In this article, we will dive into understanding this bearish reversal chart pattern, and why it is considered an essential element in the toolkit of many technical traders seeking to fine-tune their strategies.
Understanding the Triple Top candlestick pattern
The Triple Top chart pattern is a relatively simple and uncomplicated formation to spot, yet it can be easily confused with other chart patterns.
For instance, the Shoulders Pattern is visually similar, yet there is a core difference between the two.
The Triple Top is formed by recording three somewhat equal consecutive highs, with two relatively matching swing lows in between, while the Shoulders pattern always has a top peak in the middle.
An effective method to determine whether you’re looking at the correct formation is to analyse the anatomy of the pattern.
Anatomy of the Triple Top pattern
The Triple Top chart pattern used in technical analysis consists of three compulsory elements:
- Bullish uptrend – an asset must be traded in a series of higher highs and higher lows.
- Resistance level/line – a trend line that captures and connects three equal highs.
- Support level/line – a trend line that captures two lows between the highs.

Because the formation consists of three price peaks, it is nearly impossible to detect a perfect pattern on an actual chart with resistance and support levels placed horizontally to each other.
Another vital component for this pattern to justify the prediction of future price movements is the subsequent trend change and price break of the support level.
After three consecutive attempts to break above the resistance line, the third peak must be followed by a reversal trend that breaks the support level. Only then is the pattern confirmed.
Identifying the Triple Top pattern in the market
On the practical side of things, identifying Triple Tops may slightly differ, as one would have to search for this pattern amidst real market action on charts, where ideal conditions are not promised.
Although this pattern is not considered a rare chart formation, it is quite difficult to spot a perfect one.

A few vital indicators to help you recognise a Triple Top Pattern are:
- Rally – a proper composition of the pattern requires a price rally of the asset to come beforehand.
- Three peaks – a corresponding pattern occurs once three peaks at about the same level touch the resistance level on the stock market.
- Swing lows – a pullback of the price allows you to identify the support line for further confirmation of the support break on the chart pattern.
- Reversal pattern – a downtrend should be visible, and when the price breaks the support line, you will acquire confirmation of the Triple Top pattern.
Key elements in the formation of the Triple Top pattern
A point-by-point sequence recognition of your tops and bottoms is a must, yet comprehensive technical analysis also requires a more global overview of the market itself.
Various events play an important role in trend changes, pattern formation, and its behaviour. Here are just a few you might want to consider when planning your strategy.
Role of volume in the Triple Top formation
To correctly assess the buying pressure and determine the right time to catch the sell-off, you must pay careful attention to the trend in volume.
If a large increase in volume can be observed when the support line is passed, a strong bearish reversal chart pattern can be expected following a sell-off.
Yet, if the volume reflects a weak trend after the third peak has been surpassed and the support line reached, the pattern may not be that credible.
Identifying trend reversals with Triple Top patterns
The extremely powerful side of the Triple Top pattern speaks for itself. When the buyers fail to purchase over a series of three consecutive attempts, technical analysts receive a signal.
Due to its design, the Triple Top pattern provides enough space and time to study and predict likely price falls. And with enough experience and evidence, one might foresee major reversal patterns on several occasions.
But as easy this might seem, caution must be practiced. And a confirmation of the pattern has to be acquired prior to executing any decision, regardless of potential signals and price action.
Essential tools for spotting the Triple Top pattern
Just like with any other pattern, analysis of the Triple Top can be well complimented with a wide range of tools and technical indicators.
Indicators to recognise a potential Triple Top
Seeing the overall market conditions and studying the fundamentals of the underlying asset is crucial. Especially when attempting to determine likely downtrends and price moves within the Triple Top pattern.

There are multiple technical indicators available that can do the job, but some are more suitable than others when it comes to extracting information you need.
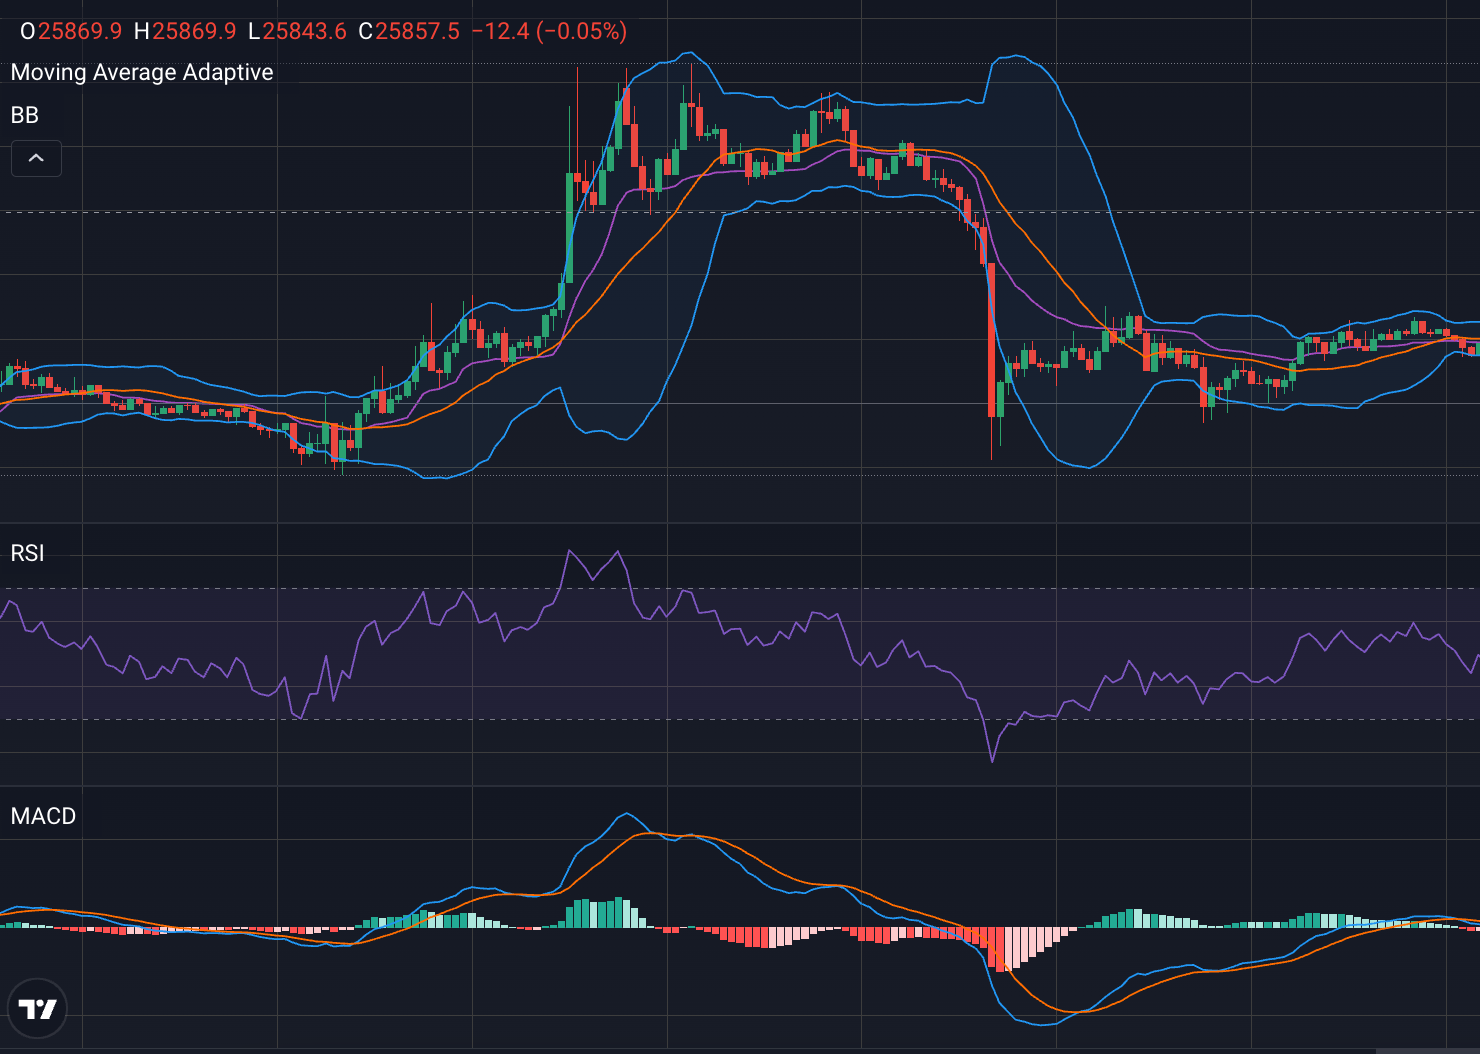
- Bollinger Bands – a tool valued for allowing one to identify a bullish or a bearish reversal pattern.
- MACD – a convenient indicator to catch momentum shifts and identify potential trend reversals.
- Moving Averages – several indicators that can help you identify a prior trend and its following reversal pattern.
- RSI – a great tool to determine overbought or oversold conditions of an asset on the market.
- Volume – an essential indicator you might need to confirm a pattern, validates and assess the strength of its movement.
Screener strategies for finding Triple Top Stocks
Another popular and practical way to detect assets that are forming a Triple Top chart pattern is the utilisation of Stock screeners.
Stock screener strategies imply using a set of tools pre-selected by personal criteria, which allow you to quickly sort through hundreds of available Stocks to spot those with the needed chart pattern.
When searching through available categories of the screener, it is important to decide from what perspective you aim to approach the search. From the fundamental or technical.
Technical search criteria is suitable for short-term investment plans, such as trading. Whilst fundamental is best for a long-term investing plan.
Practical steps for trading the Triple Top pattern
Trading the Triple Top pattern can be highly lucrative. Nonetheless it involves risks that may escalate the probability of losses.
Proper risk management and a well thought-out target will allow you to benefit the most from realising the potential of the pattern.
Following the chart pattern with an effective stop loss
Multiple attempts to unsuccessfully break the resistance line increases the chances of a reversal pattern. This is where a well placed stop loss can help secure your strategy.
After the price rebounds for the third time, the Stock chart prepares to test the support line and activate the Triple Top pattern.
Placing a stop loss just above the latest peak to protect your strategy can also improve the rewards, opposed to the risk you might face.
Another way to limit the risks is to place a stop loss slightly above the recent swing high within the pattern. In this case, if the price action resists a downtrend, potential losses will be minimised.
Determining your price target
A much more difficult task is to determine the price target you wish to reach to secure profits when trading the pattern.
Since the target is always based on the full pattern height, a take profit order can be placed where the selected price target is equal to the distance between the support line and the peaks.
For example, the peak price of the asset reached a maximum of $200 within the pattern, while the deepest swing low hit a price of $185. Here is how you can calculate your downtrend price target:
Initial data: Resistance $200 = x / Support level $185 = y / Downtrend target = z
Calculations: x – y = $15. y – (x – y) = $170
Although this method is preferred by many traders, it is also possible to have more than one price target. This depends on your risk tolerance when choosing the entry point.
Comparing Triple Top and Triple Bottom patterns
Over the course of your chart analysis, you may also encounter a twin to the Triple Top formation – the Triple Bottom chart pattern.

Contrary to the Triple Top, the Double Top has a different behavioural model.
Key differences and similarities
The parallel between the two reveals itself in the mirrored formation. But unlike the Triple Top, the Triple Bottom occurs in absolutely different market conditions.
The inverse nature of the Triple Bottom allows one to spot it when an asset’s price level reaches its lowest value, and the emerging formation displays two highs and three roughly equal lows respectfully.
When to use each pattern in technical analysis for trading
As per the aforementioned differences between the two chart patterns, a trader can use them in analysis to yield potential profits in opposite market trends.
The bullish reversal chart pattern is good for application when the asset is predicted to react positively on the market and promises a likely increase in value.
Whereas Triple Top pattern studies are best deployed when the asset is struggling to add to its worth, and signals a downtrend one might consider committing to.
Conclusion: maximising profits and minimising risks with the Triple Top pattern
Trading the Triple Top candlestick pattern is a great way to profit from market action, while at the same time providing yourself with a higher level of security.
Moreover, its a greater opportunity for less experienced traders to take their time to strategise, due to the lengthy formation nature of this pattern.
The wide appreciation for this pattern arguably makes it one of the most popular tools to utilise in trading.
How reliable is a Triple Top pattern?
Not a single chart pattern can provide you a guaranteed result. But a sufficient amount of responsibility and experience using this charting tool can bring you closer to the desired result.
How accurate is Triple Top pattern?
It is nearly impossible to spot a perfect Triple Top sequence on a chart, yet in-depth technical analysis allows one to make a better prediction of the pattern and its outcome.
What are the differences between Triple Top & Double Top patterns?
Both patterns chart reversal trends. Nonetheless, the Triple Top is a bearish pattern and signals to a subsequent downtrend, while the Double Top is a bullish one, and points to a potential uptrend.
What are the differences between Triple Top and Head and Shoulders patterns?
Three peaking points for both of the patterns make them look similar. Yet the Shoulders pattern always forms with the middle peak above other, while the Triple Top pattern has relevantly equal peaks.
Is a Triple Top bullish?
The Triple Top chart pattern is considered a bearish pattern. A triple attempt for the asset to break its peak price indicates a potential decline in price action if the pattern is confirmed.
Risk warning: Our products are complex financial instruments which come with a high risk of losing money rapidly due to leverage. These products are not suitable for all investors. You should consider whether you understand how leveraged products work and whether you can afford to take the inherently high risk of losing your money. If you do not understand the risks involved, or if you have any questions regarding our products, you should seek independent financial and/or legal advice if necessary. Past performance of a financial product does not prejudge in any way their future performance.


