Is the phrase “less is more” or “more is better?”.
In the world of trading a maximalist approach is preferred to a minimalist one.
More data, more information, more education and of course – more profit.
So what is better than a one or two moving averages? Three.
Moving averages (and more generally indicators) are graphic depictions of calculations made using past prices and plotted on the chart. Moving averages are used to forecast or predict potential future price movements, using the assumption that past price performance will repeat when certain market conditions are met.
This method of analysing market trends i.e. using past prices to extrapolate future price action, is also known as technical analysis.
But what is a moving average, a triple moving average and of course a triple moving average crossover? And how will it help you develop a better trading strategy?
Keep reading to find out.
Understanding moving averages in trading
Basics of Moving Averages
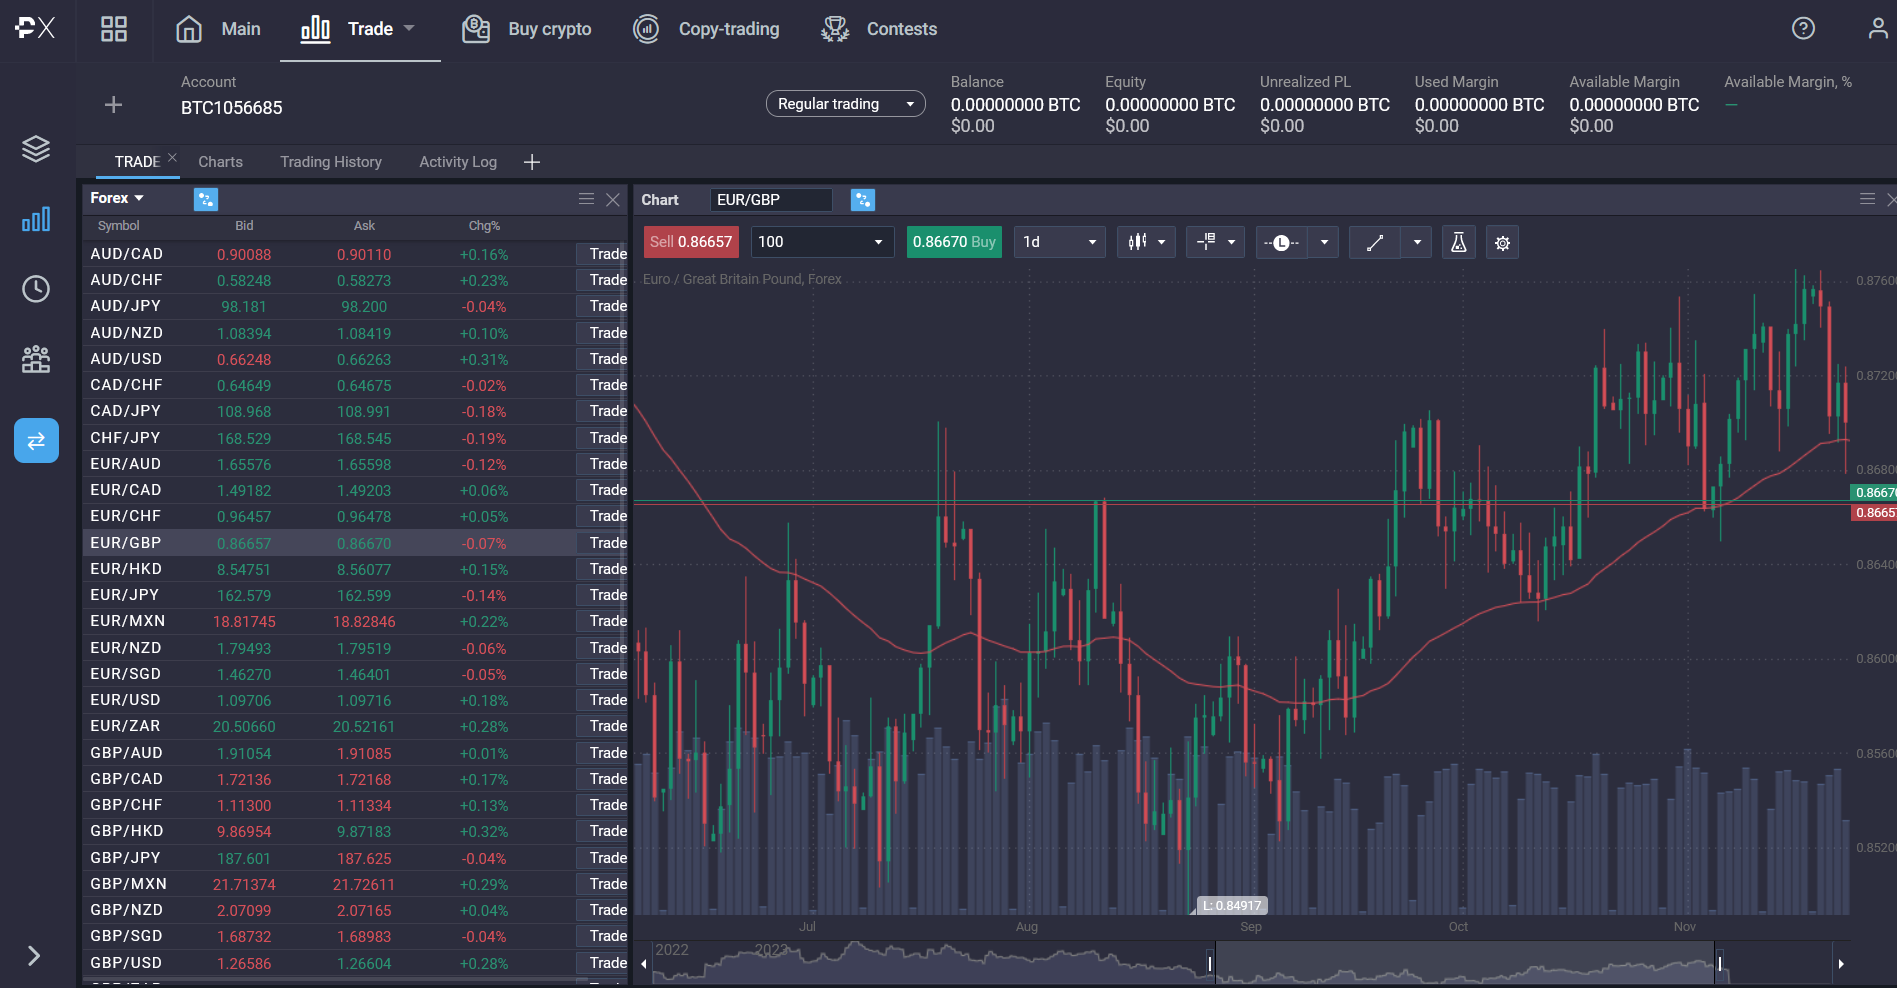
As their name implies, moving averages are graphical depictions of price averages that “move” as the price action progresses.
In the formula for calculating MAs A are the closing prices within the timeframe and n the interval (if you are looking at 14 days then n is 14):
MA = A1+A2+A3…./n
MAs (moving averages) usually have a timeframe which is calculated into the average, and when using multiple moving averages, they tend to implement different timeframes.
Short-term moving averages are called “fastest moving averages” since they follow the price action closer. Slower moving averages have longer terms (or timeframes) since they tend to normalise price action. You will notice that the longer the MAs timeframe, the smoother the line which it plots will be.
When short term MAs cross long term MAs or the opposite, this is can be a signal of a potential change in trend direction.
Types of moving averages
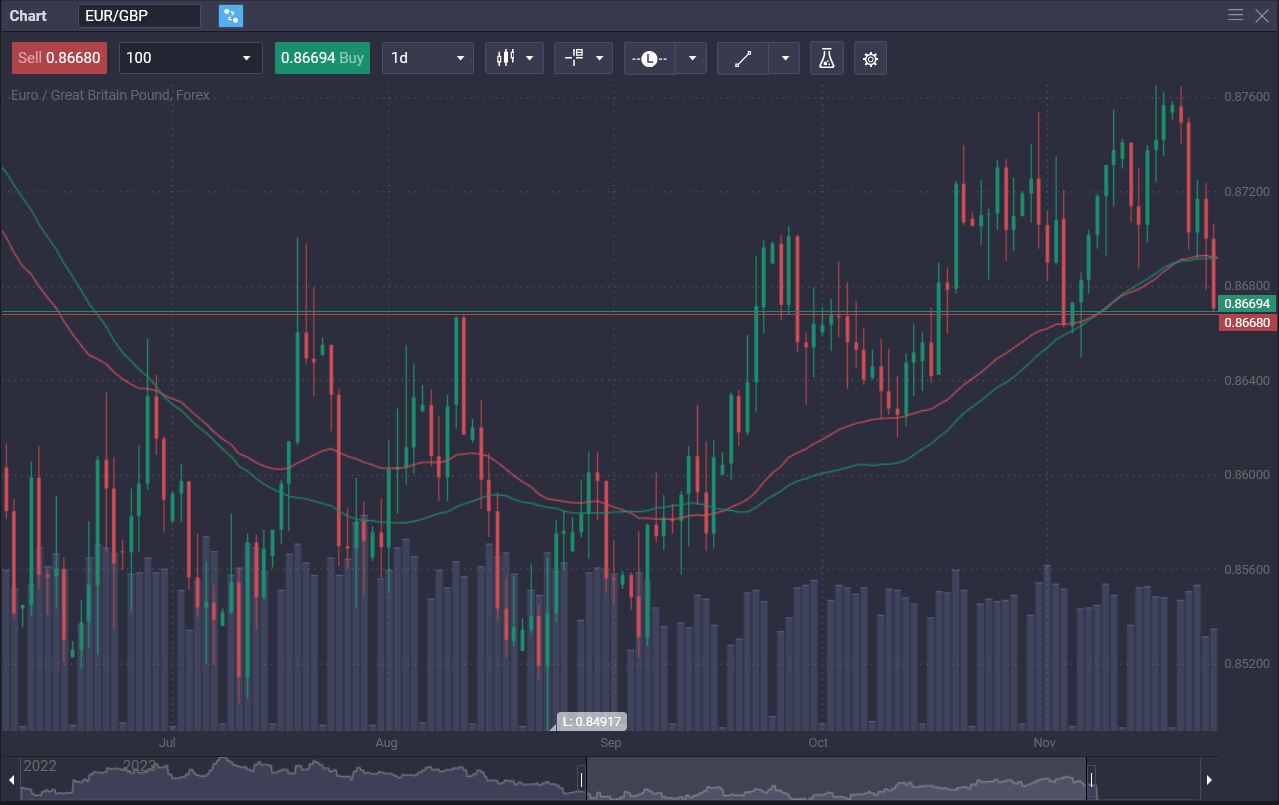
The two main types of moving averages are simple moving averages and exponential moving averages abbreviated by SMA and EMA, respectively.
SMAs as the name implies, is calculated by taking the sum of an instrument’s closing prices divided by the time interval. The longer the timeframe (i.e. the more intervals) the smoother the line.
Now as you can probably gather, SMA doesn’t really show a bias towards any particular prices, and this may cause misinterpretation or complete misreading of a potential entry point. An EMA solves this problem by considering more recent prices into its calculation.
This is the formula to calculate EMA:
EMA = Closing price x multiplier + Previous EMA x (1 – multiplier)
In both formulas the previous EMA is just the SMA of the previous period. In the first formula the multiplier is 2/(number of prices used in calculation + 1) An alternative formula to calculate the EMA is:
EMA = [Current Price x (2/n+1)] + [Previous EMA x (1 – (2/n+1)]
as you can see especially in the second form of the formula, the current price used in the calculation.
The triple moving average crossover explained
What is a triple moving average crossover?
The reason we dove so deep into the minutia of SMA and EMA is because it’s important to understand how a moving average is calculated and how it can be used to identify and use the so called triple moving average crossover.
Using the position of the EMA in relation to the current price and the current market conditions, you can establish whether the current trend has the potential to continue, slow down or even reverse. Additionally, EMAs can also show you the momentum of said trend, that can help you decide if it’s appropriate to exit positions or hold on if the momentum can carry the price action further.
Momentum can also help you decide if it’s a good time to enter a trend or if the market trend is coming to an end.
This is very easy to discern using the triple moving average crossover. If all the EMAs are below the current prices, then momentum is strong in an uptrend. When the inverse is true – the EMAs are above the current prices the momentum is strong in a downwards market trend.
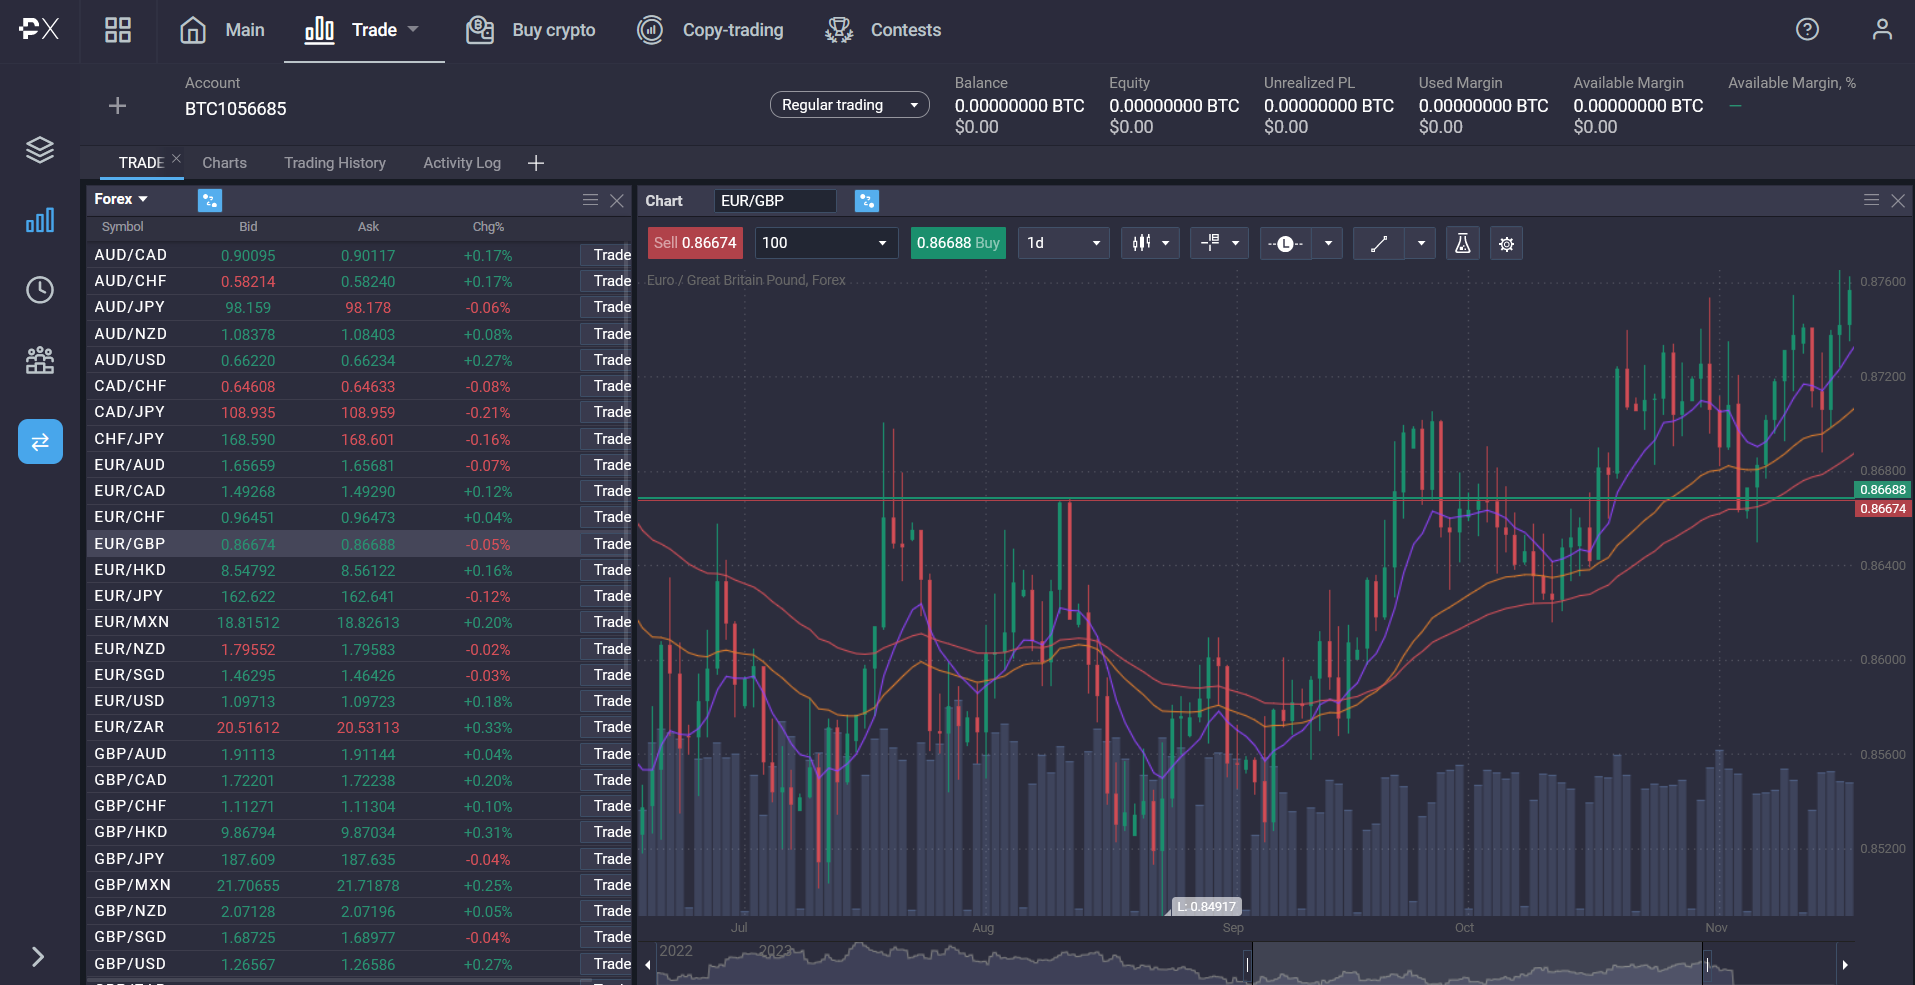
There is also information you can identify from the interaction of EMAs amongst themselves. Most traders will plot EMAs with three timeframes or intervals – 10, 30 and 50, but feel free to adjust the timeframes to best fit your strategy.
EMA 10 is the short-term moving average, EMA 50 the longer-term and 30 is the medium-term EMA.
When the slower EMAs (i.e. the ones with a longer timeframe) cross both the faster ones (i.e. the ones with shorter timeframes/intervals) or when the shorter term moving averages cross the slower moving average, that can yield different information.
Let’s take a look at each of these “crossover” scenarios – using 10, 30 and 50 EMAs for the example, where the purple indicators is 10, the orange 30 and the 50 red.
- Medium EMA and overall trend direction
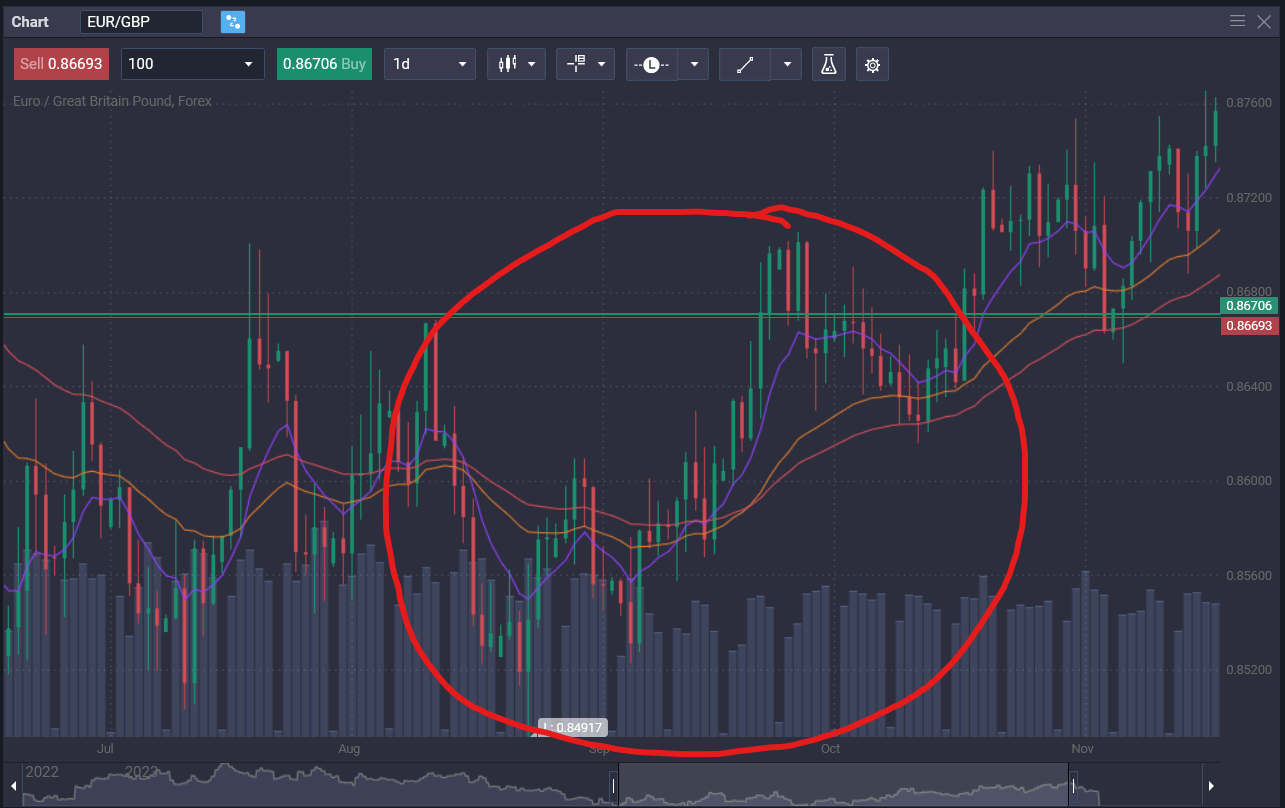 The triple moving average crossover combination is great at easily seeing how the market is currently trending.
When the short-term EMA is over the medium-term one it is usually a uptrend, when the long-term EMA is above the medium-term one, then the market is in a downtrend. There are few technical analysis tools that are so easy to read and discern market trends.
Remember that nothing is absolute and the best way to avoid
- EMA 10 crosses above EMA 50
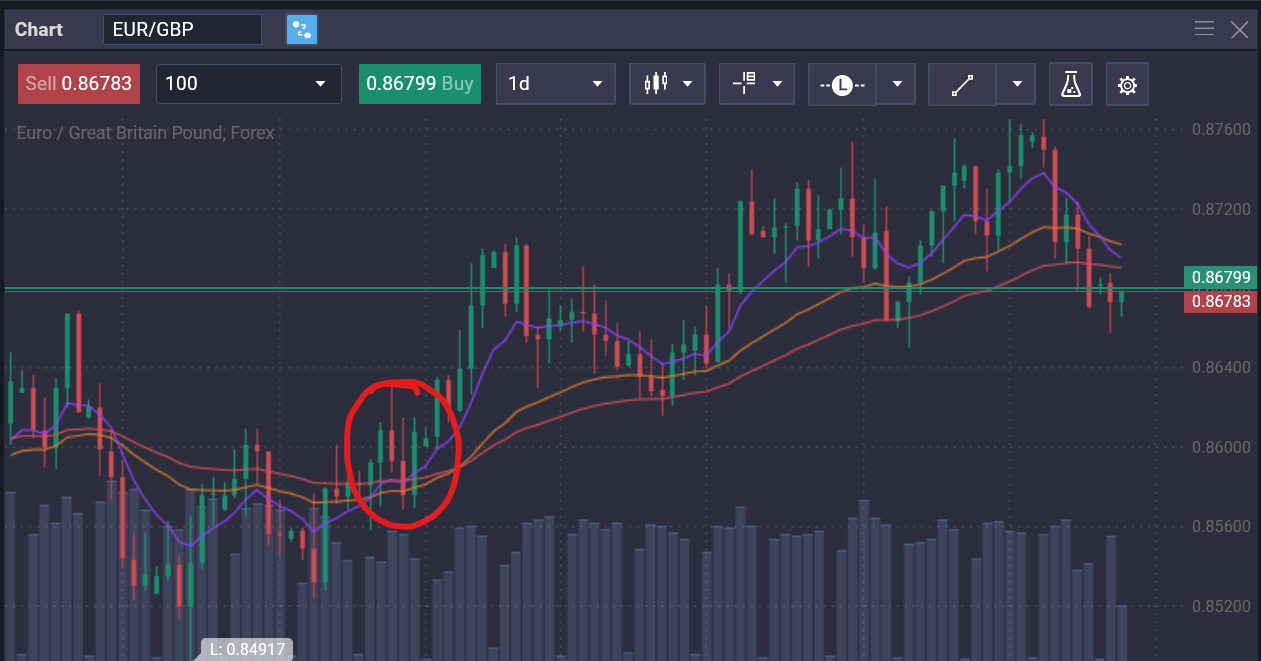 These crosses may be considered entry points – showing a cooling in short-term momentum within the the longer term trend direction.
In this scenario the EMA 30 or the medium term trend indicator, can delineate the range in which a reversal may happen, thus a good range to set a trailing stop.
- EMA 10 below EMA 50
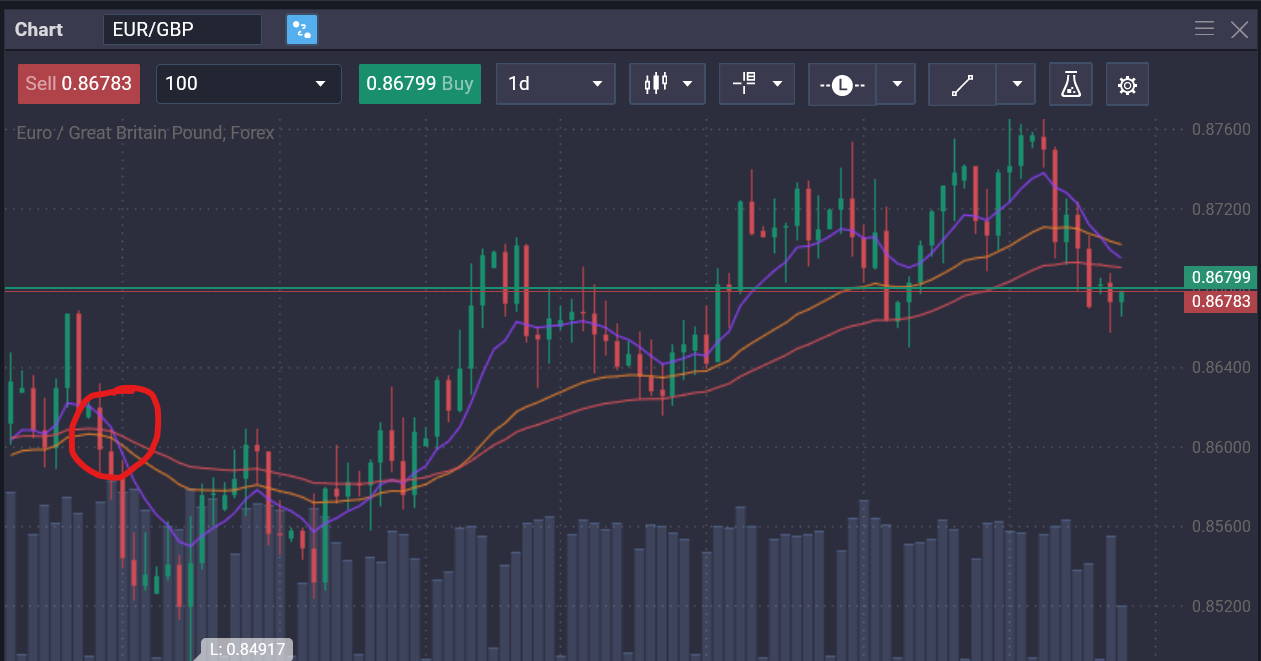
Essentially the exact opposite of the previous scenario, the EMA 10 crosses below the EMA 50 indicating a downtrend, and a short position entry point at the crossover.
- Widening distance between EMAs? More momentum
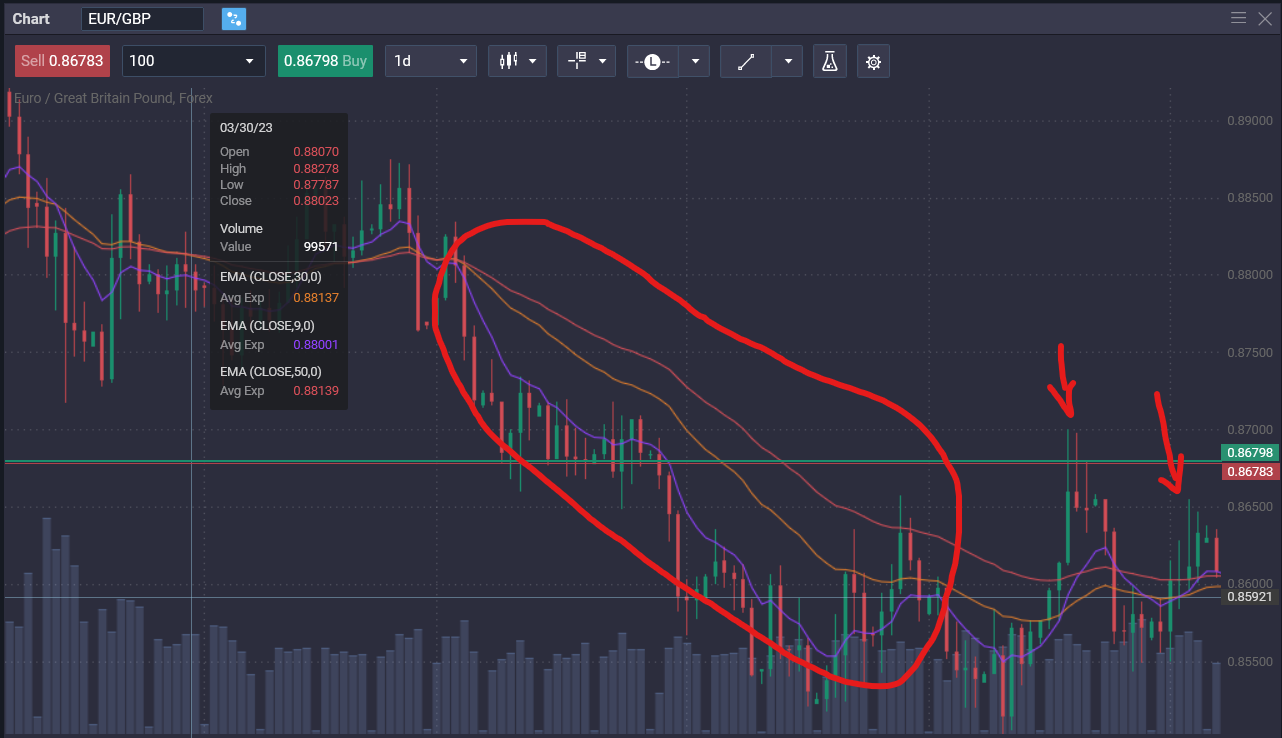
As the distance increases between the triple moving averages so does momentum, i.e. the trend’s “ability” to continue.
As you can see after a significant down trend, the EMAs converge, momentum slows and we have a few successive reversals (as indicated by the arrows).
- The triple moving average crossover
Significance in trading
As we mentioned previously triple moving averages can be a very powerful tool for recognising both short-term trends and long-term trends by adjusting the moving average periods.
Additionally they are some of the easiest technical indicators to set up on your charts.
Using the triple moving averages crossover strategy can also help you setup trading strategies with entry and exit points, and trailing stop all of which are crucial for successful trading.
The triple moving averages strategy can also help you see the prevailing price direction direction on the trending market at a glance – if the short-term EMA crosses the medium-term one, markets are trending upwards where as if the long-term EMA is above the medium EMA then the market is in a bullish trend.
It can even help you speculate when the existing trend may end, by giving you information about an instrument’s or market’s momentum.
Implementing the strategy
Setting up triple moving averages
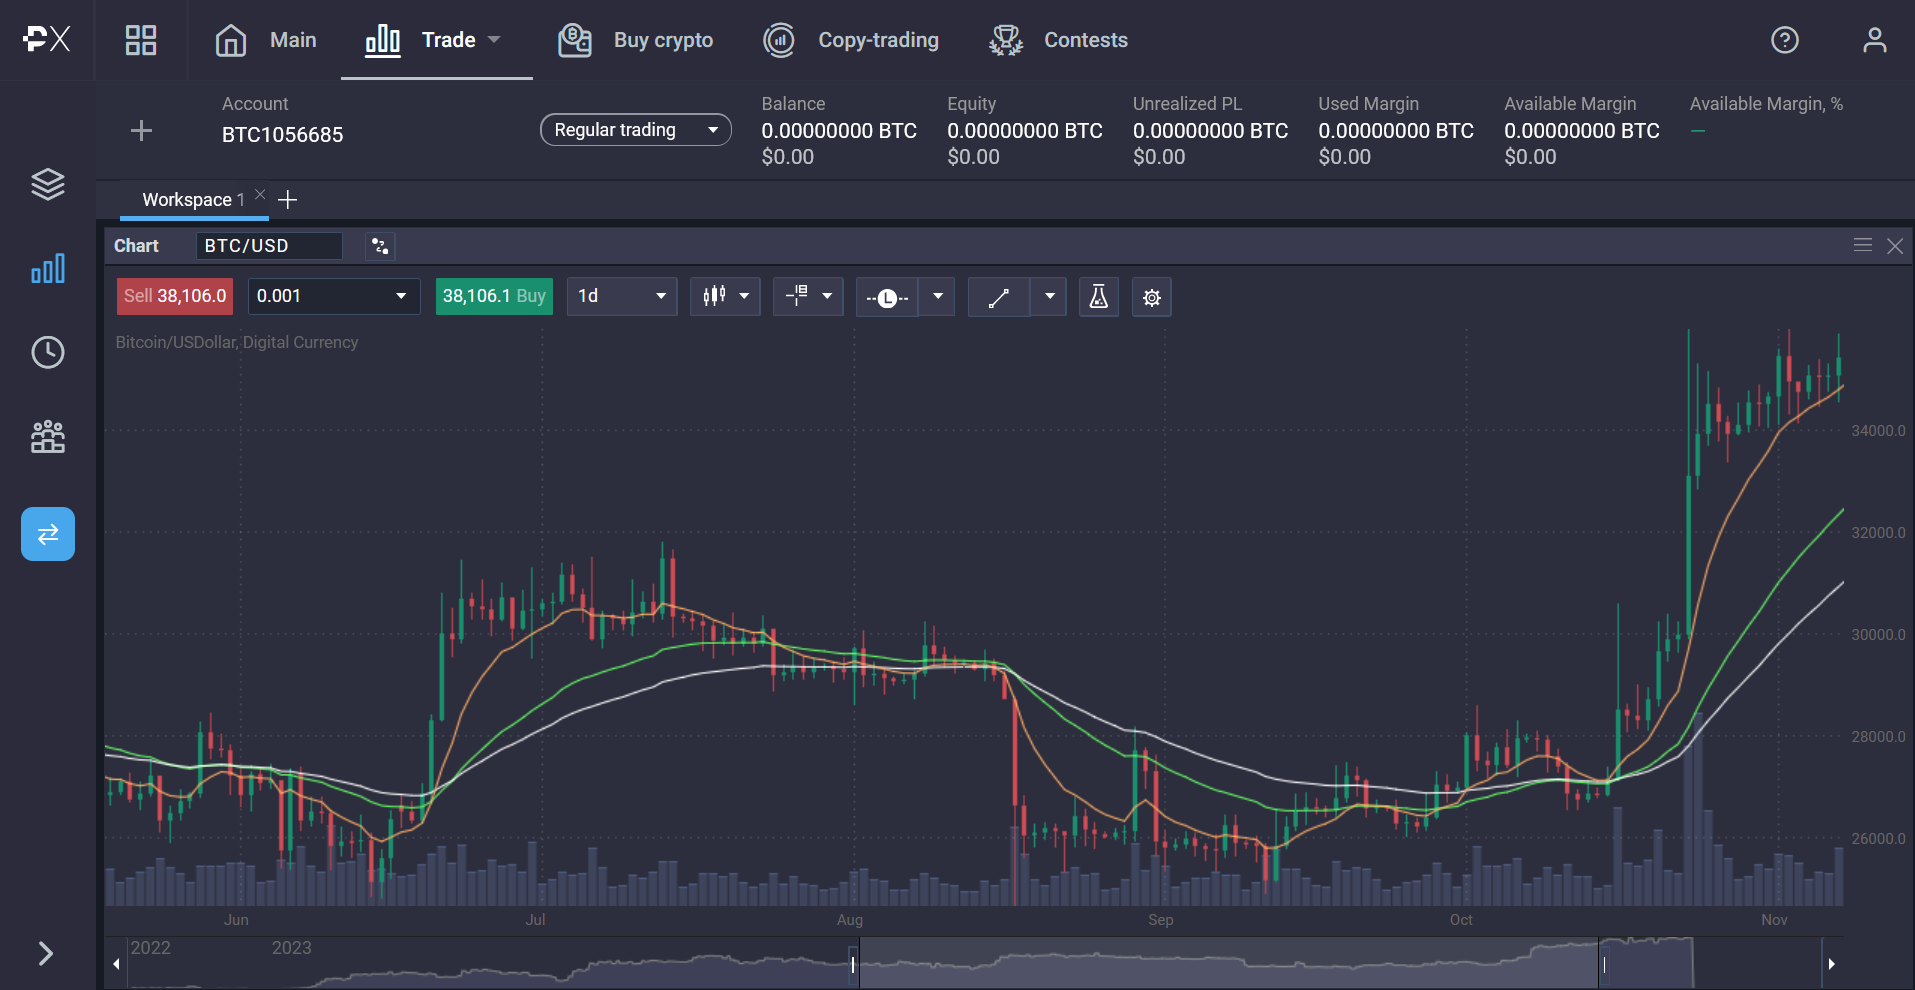
It is very easy to setup exponential moving averages on PrimeXBT’s platform.
Sign in and select the asset you’d like to analyse
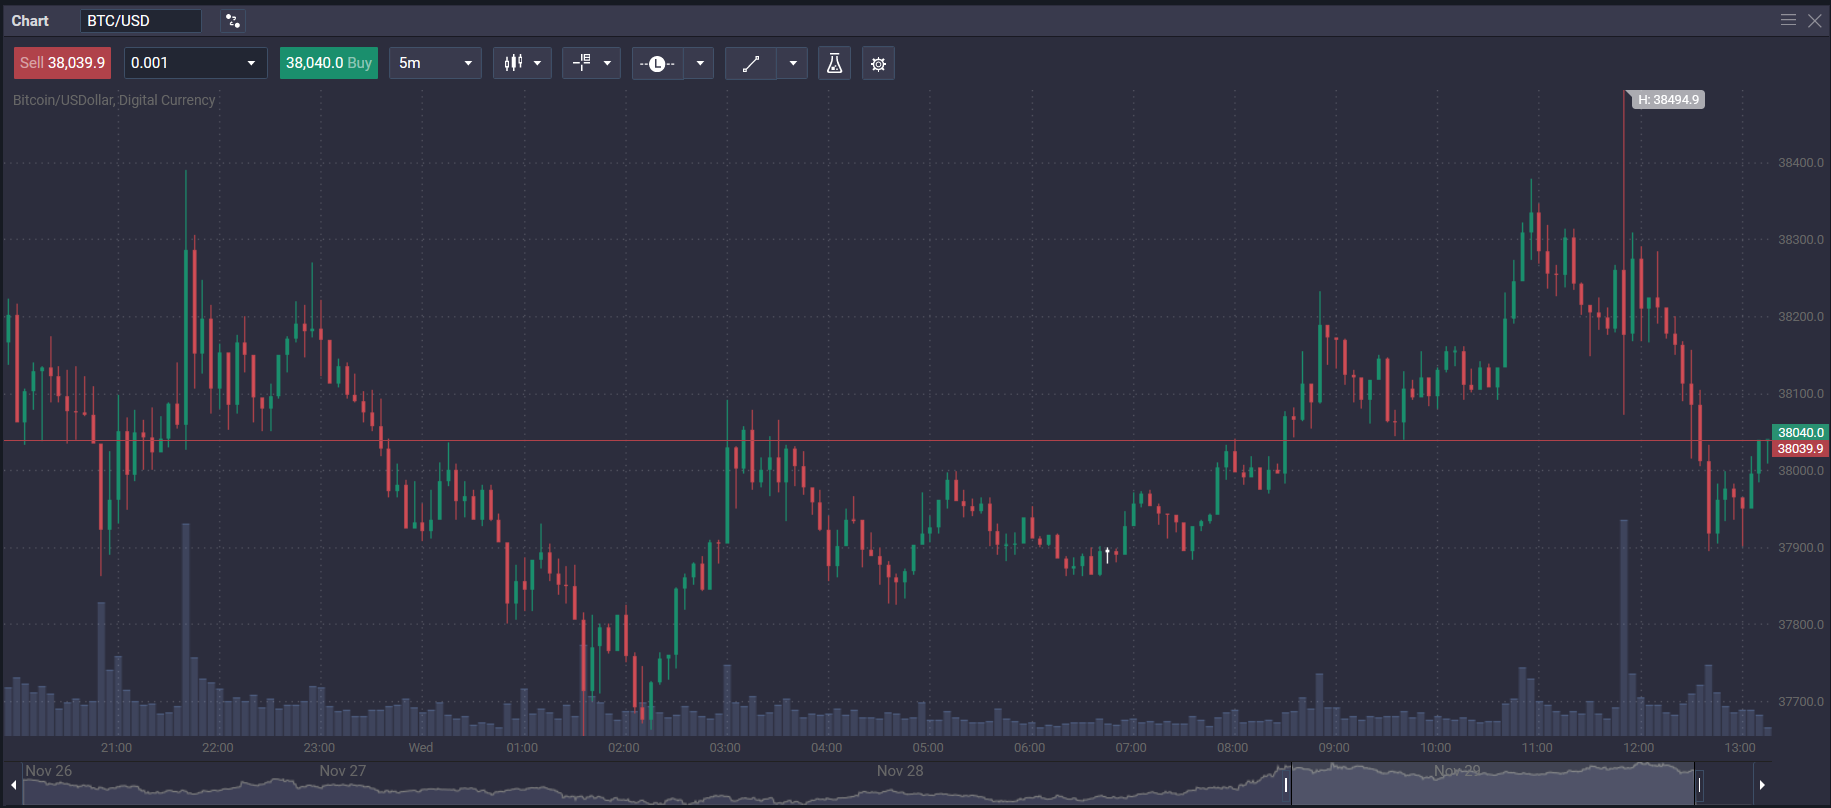
Select the timeframe
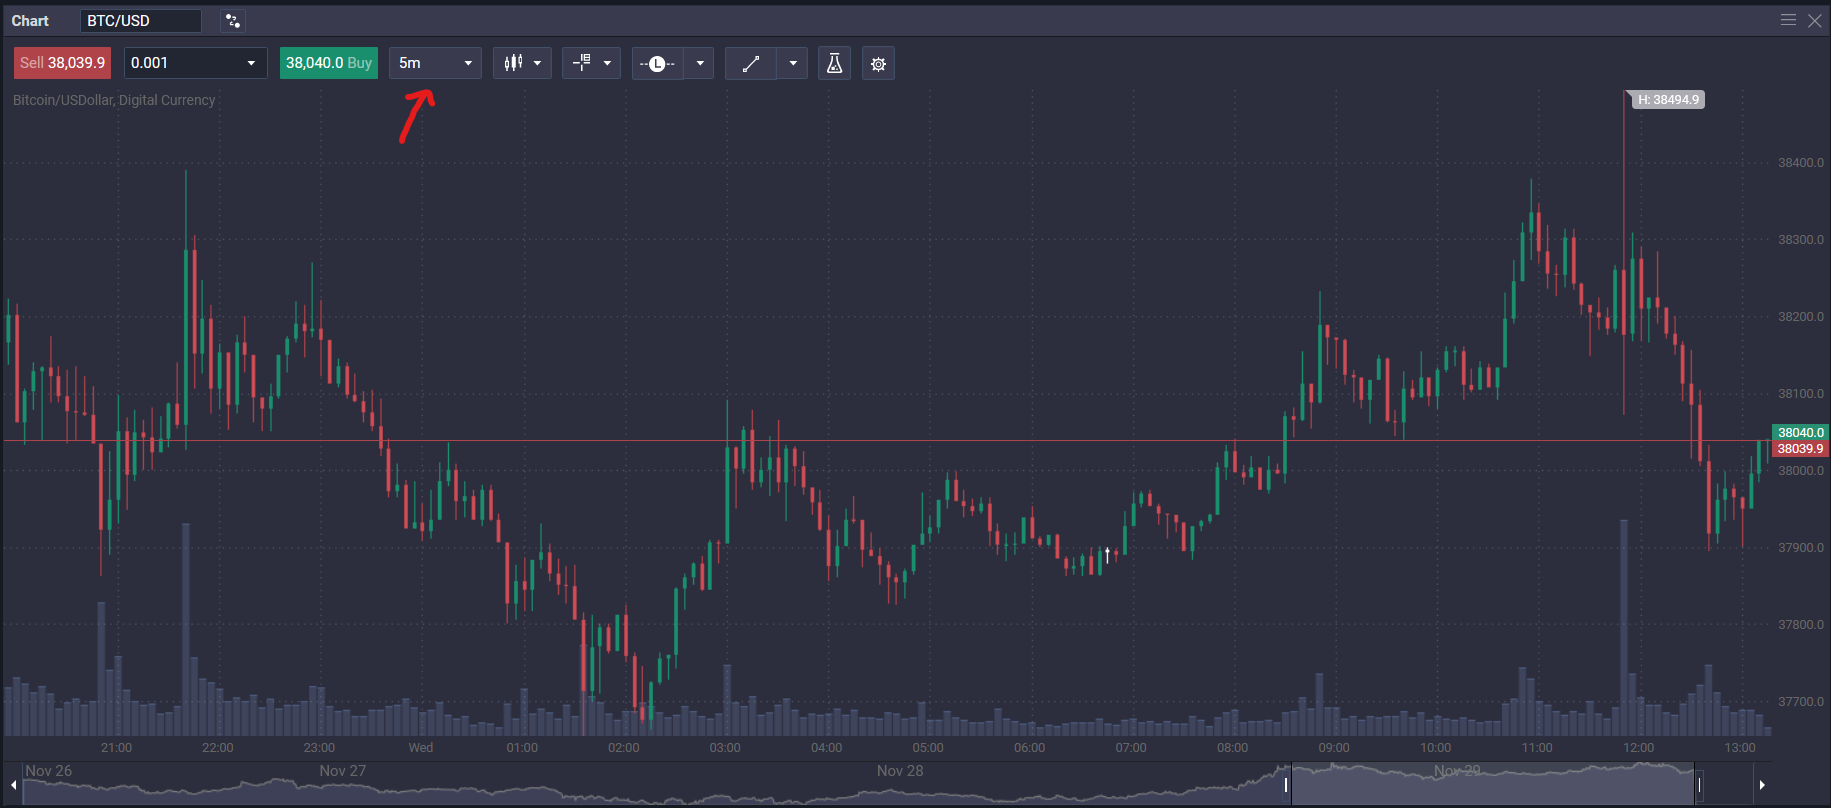
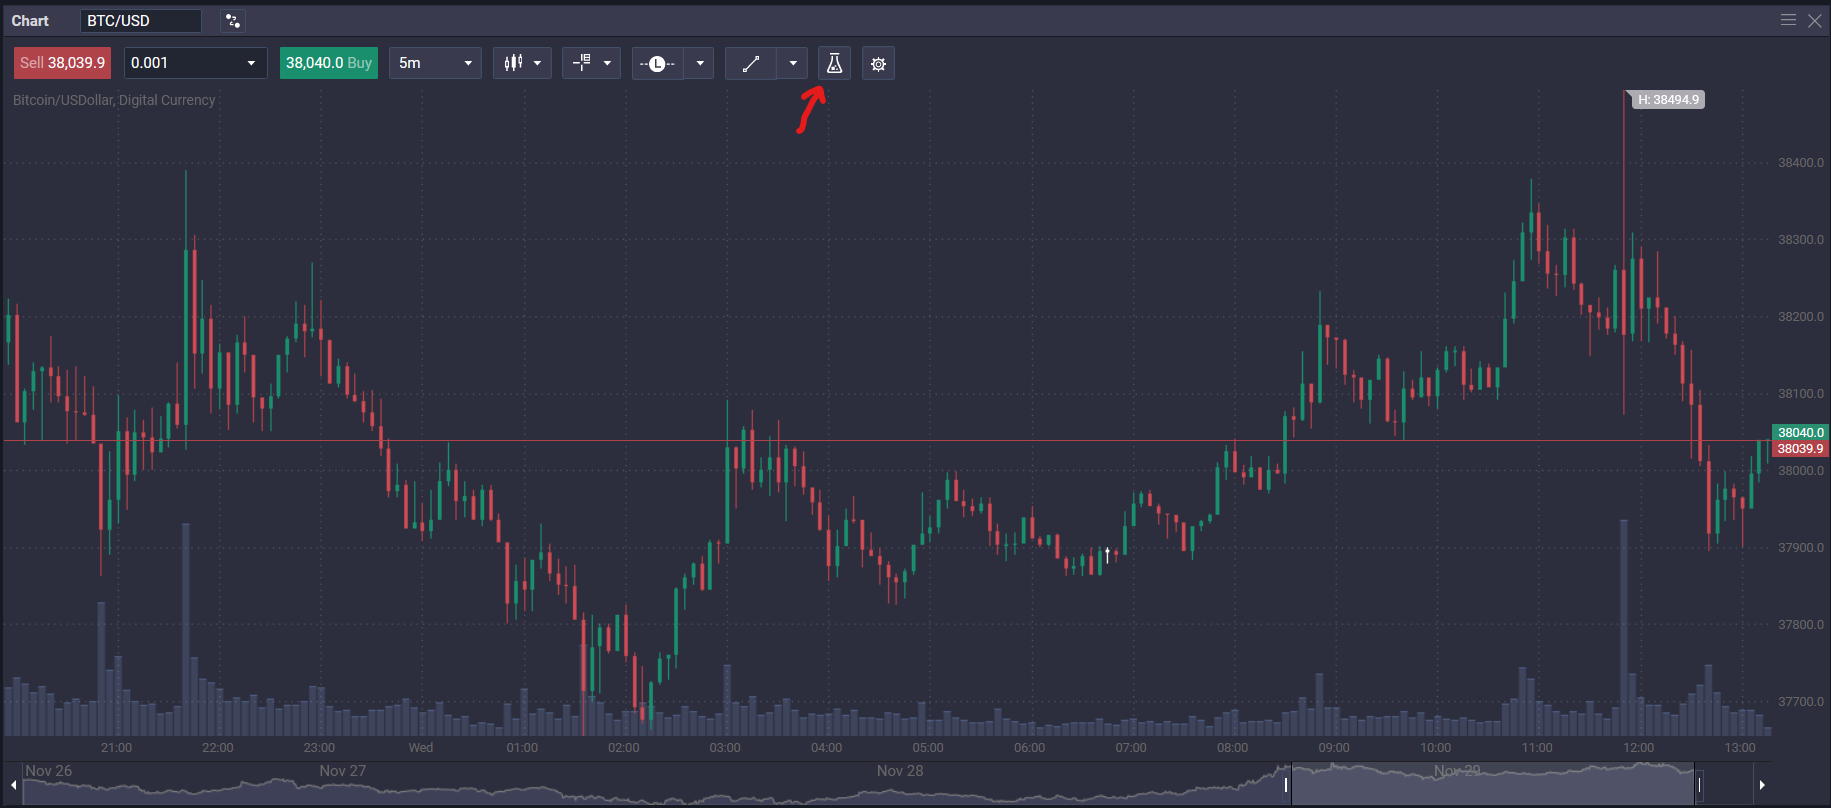
Click on the “beaker” symbol to open the list of indicators and search EMA
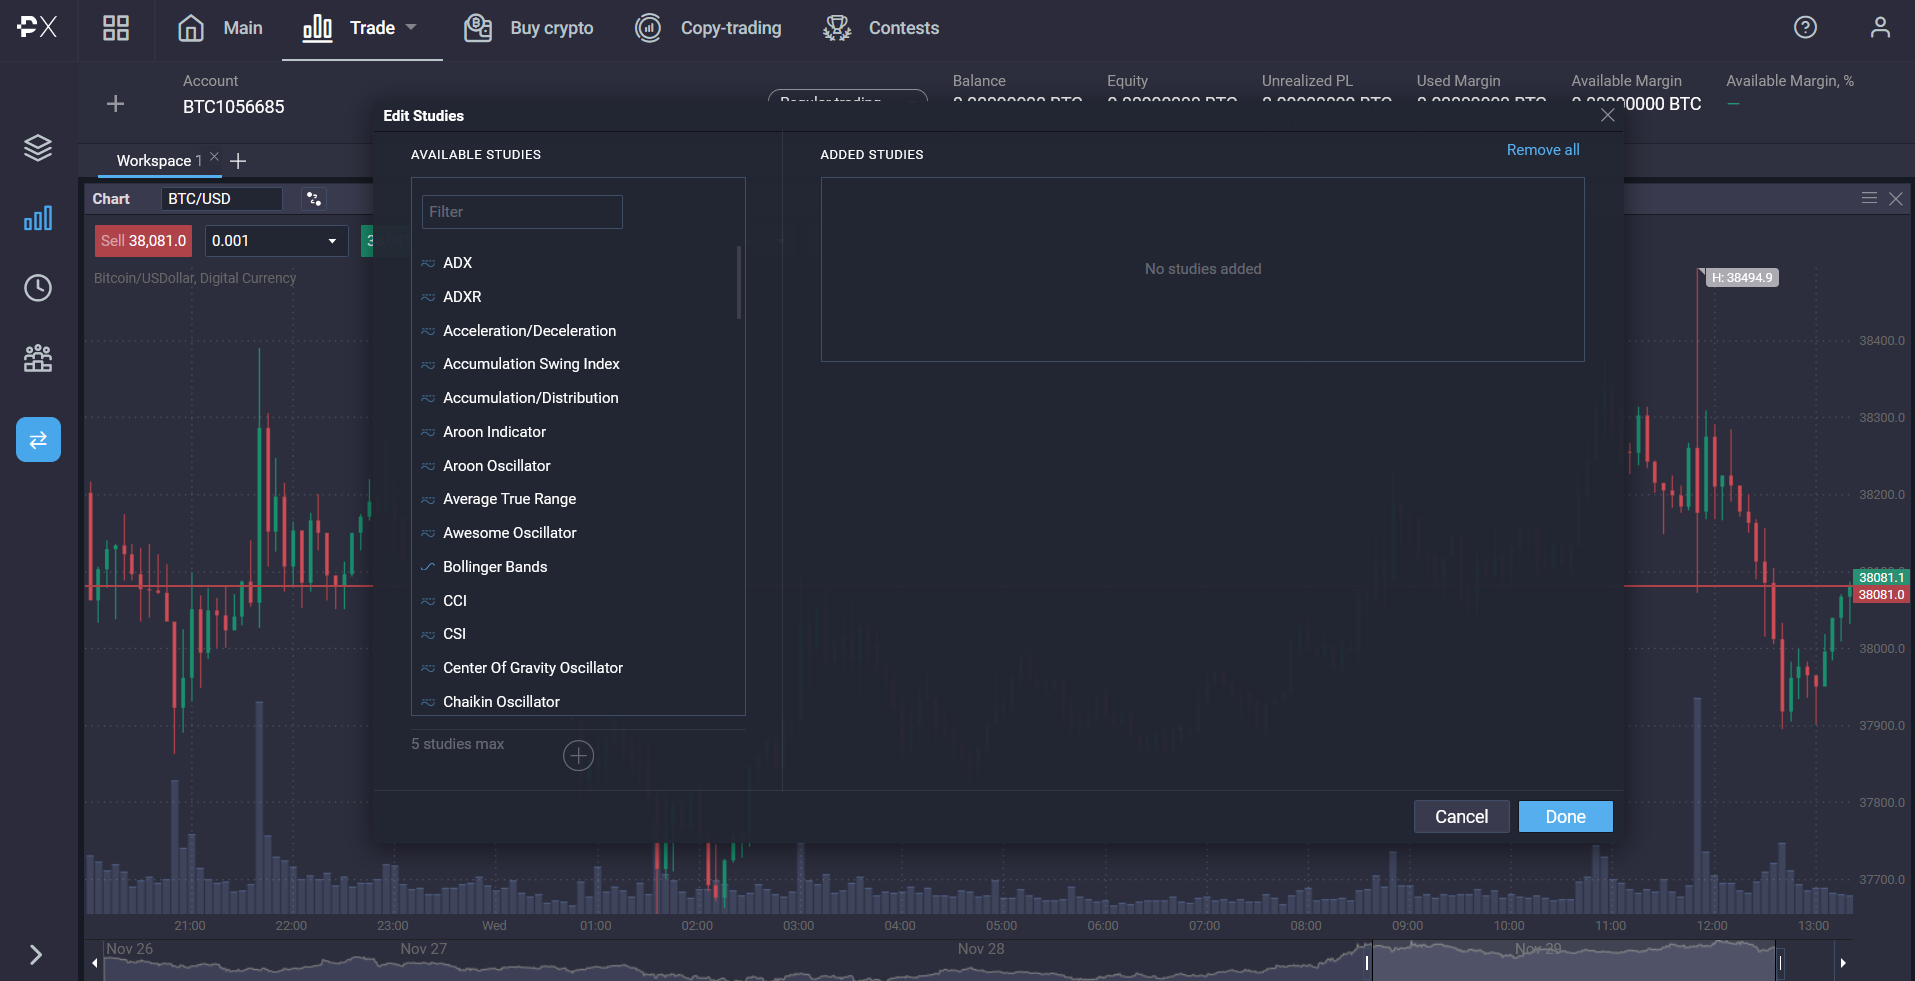
Adjust the parameters of the EMA and add the other EMAs with the plus button. Adjust their parameters as well
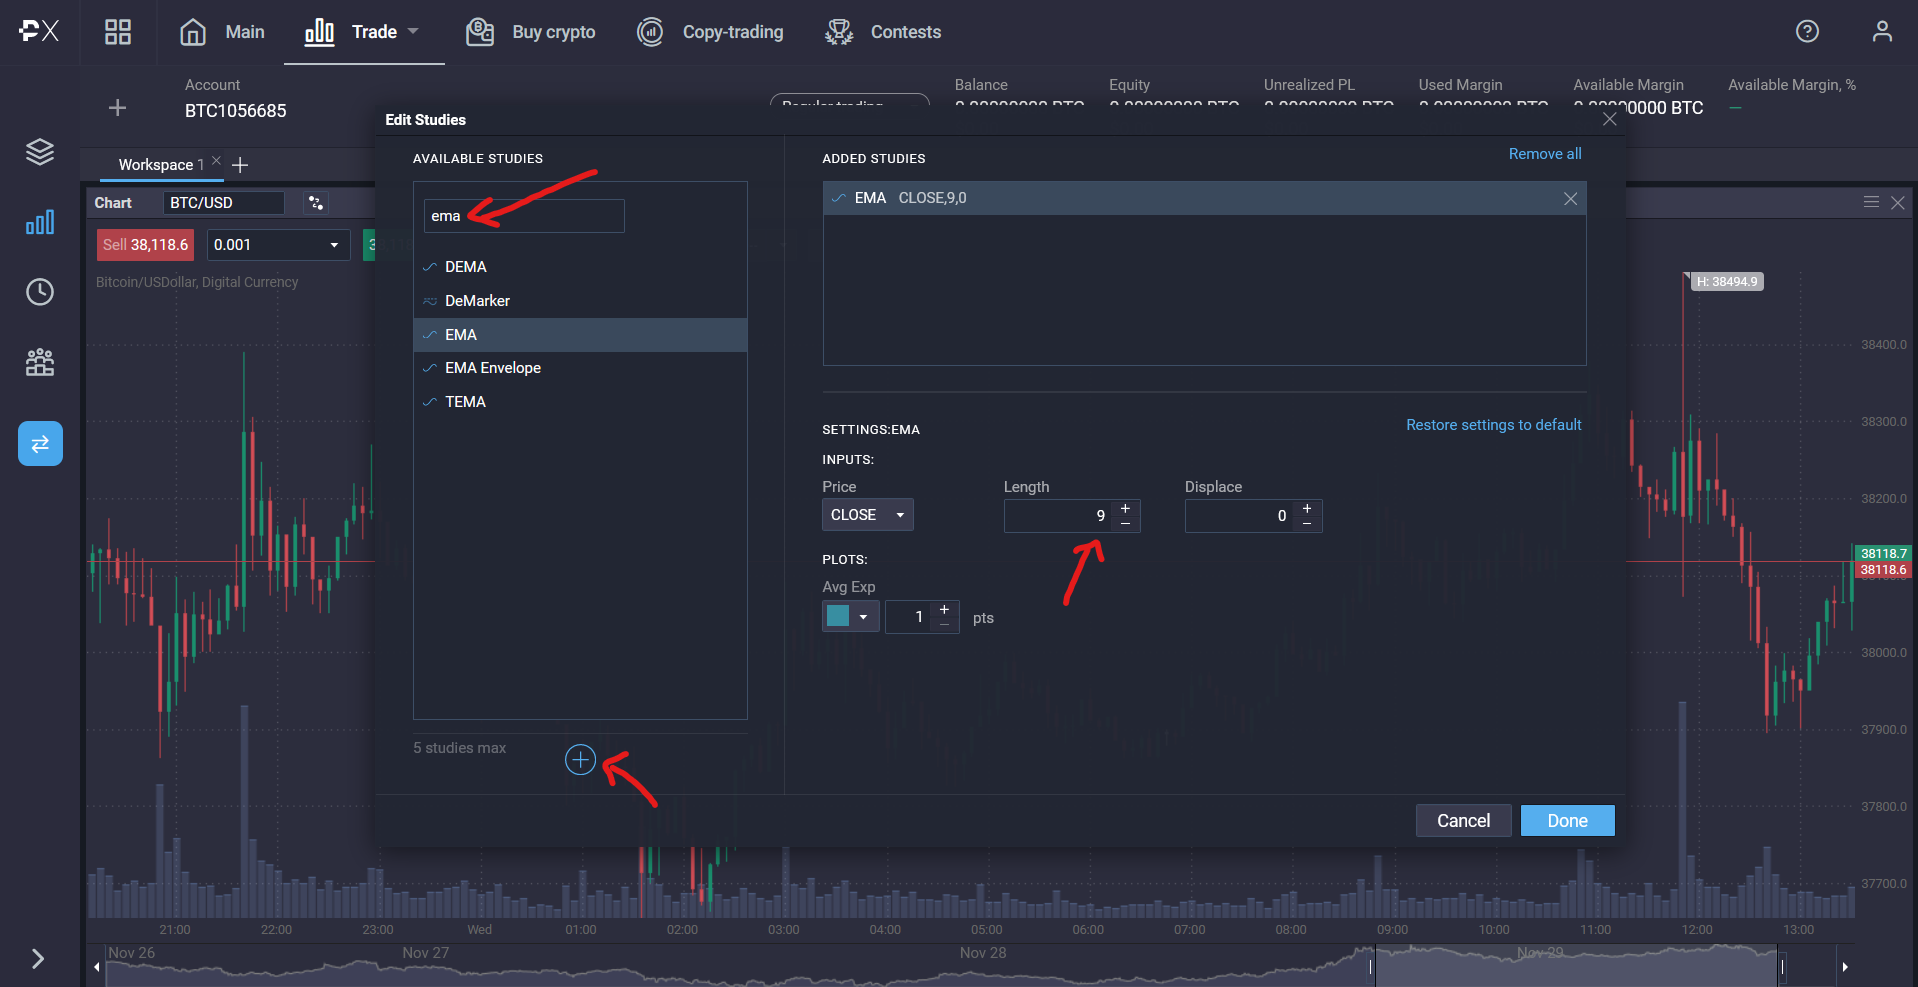
When all the EMAs are adjusted and added click “Done”
Trading strategies
As we’ve already covered, there are many ways you can use the moving average crossover strategy. Here is a range of ways that you can use it, in a convenient list.
- Buy and sell signalsWhen the short-term exponential moving average crosses over the medium exponential moving average, that can be taken as a buy signal during an uptrend.
When the long-term exponential moving average crosses over the medium-term exponential moving average, then that indicates a sell trade, or an entry point for a short position.
In both scenarios, the mid-term EMA can be used as a trailing stop and an exit point can be considered a cross over by the opposite term EMA.
- Trend following
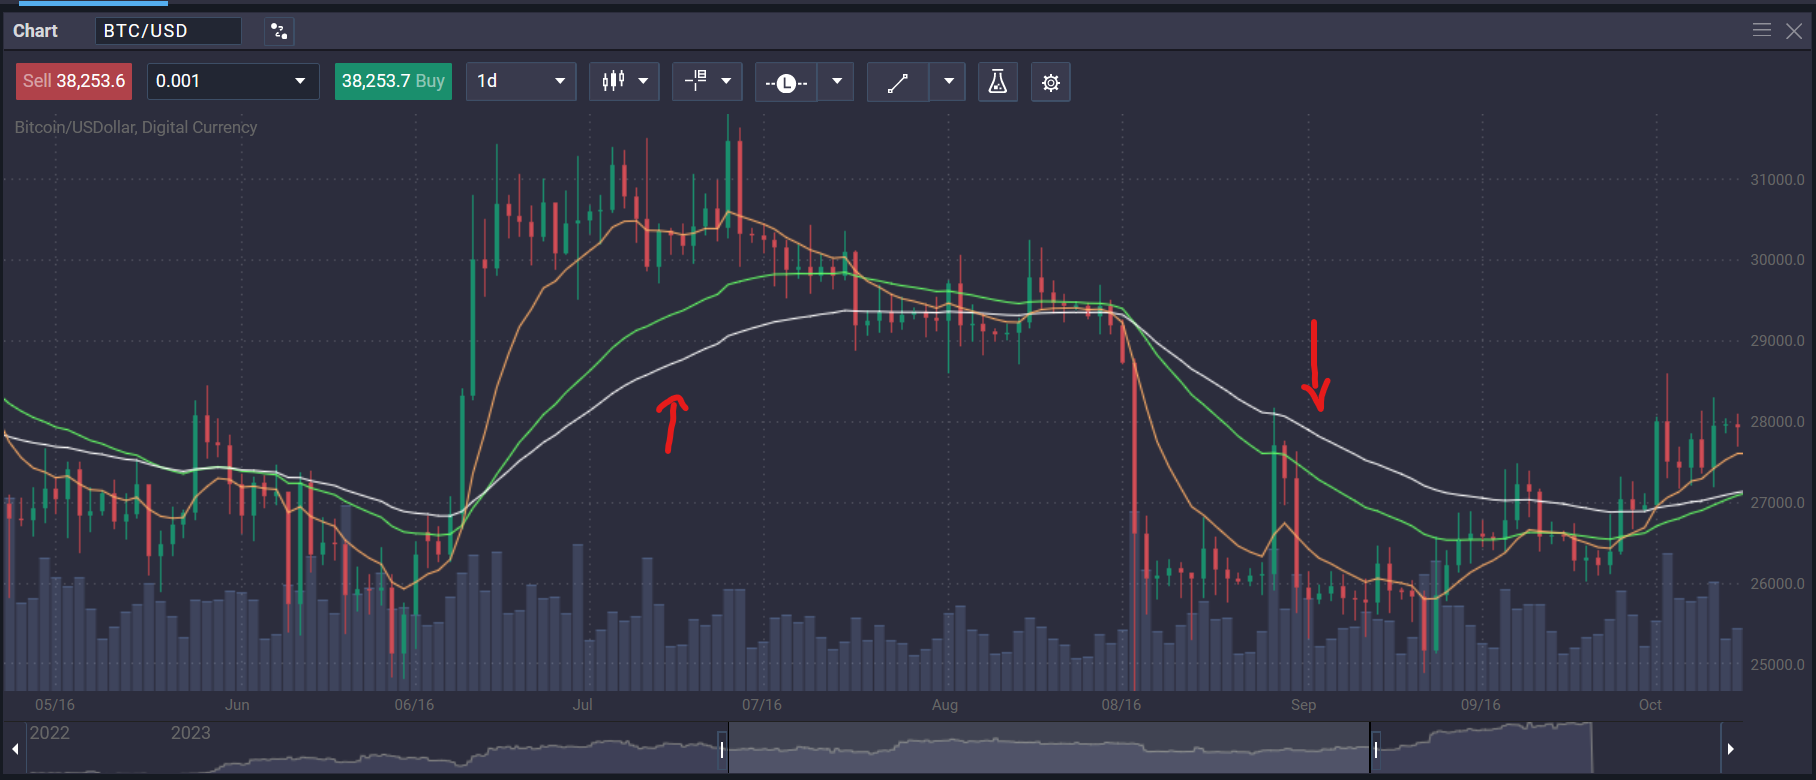 The triple moving average crossover combination can also reveal a trend’s momentum. The wider the deviation from the mid-term EMA (in both uptrends or downtrends) the more momentum the trend has and the higher the possibility the trend will continue.
The entry point would be when the triple exponential moving average crossover happens and the exit point would be when the opposite crossover happens again.
- Things to watch out for
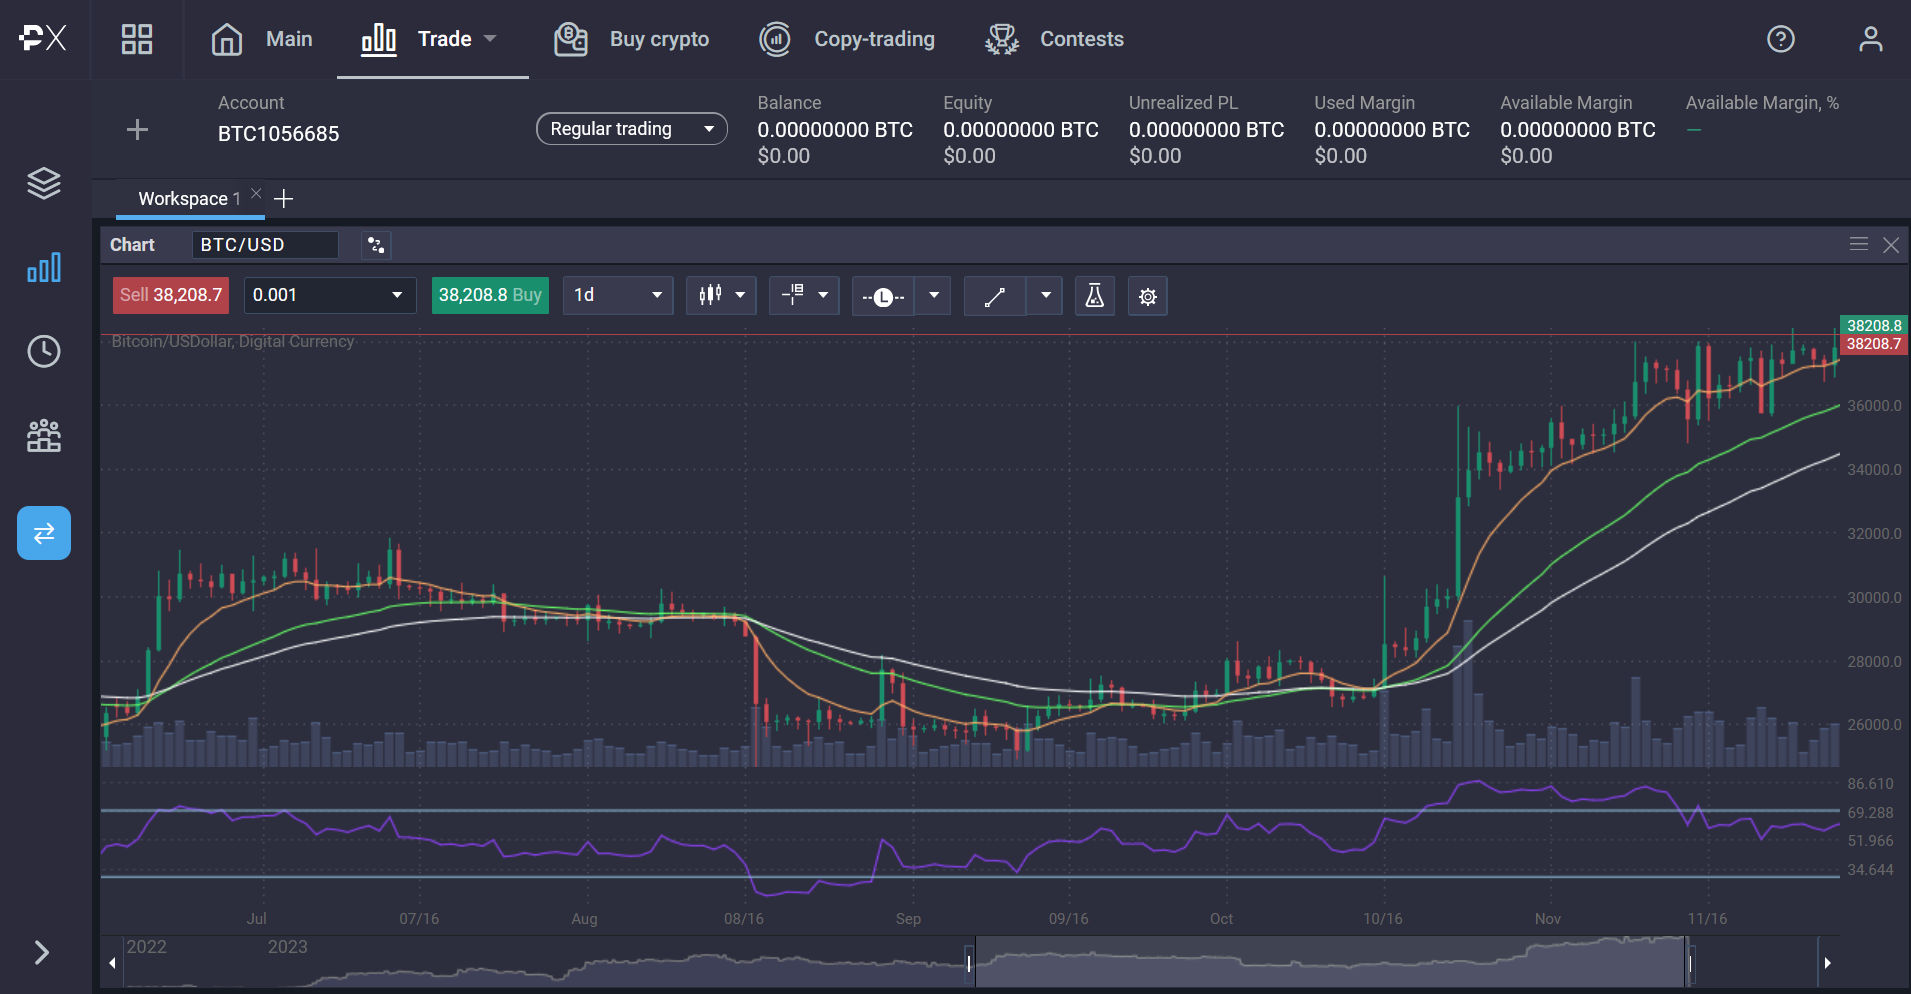 When using any technical indicators, using them in conjunction with other technical indicators can give you a more holistic picture of the market.
Some powerful indicators cover multiple market forces, but some leave potential gaps. For example simple moving averages are not weighted by the latest price direction, an exponential moving average though does.
One moving average may smooth out price action or follow it too closely increasing the potential for false signals, so combining them can give a more complete image of the price action.
Additionally plotting only a single moving average, will not show you any information related to momentum. This can cause traders to enter a position towards the end of a trend or causing what seems to be trading opportunities to be reversal traps.
You can use various indicators in combination with the moving average crossover combination including RSI which shows you if an instrument is overbought or oversold.
An overbought asset will drop to return to its true market value, and an oversold asset will increase to reach it’s true market value.
Advantages and limitations
Benefits of using triple moving average crossover
The biggest benefit is the fact that the triple moving average crossover strategy can show you entry and exit points, stop out levels, trend momentum and the direction of trending markets.
But just like other indicators used in technical analysis, it requires additional information and confirmation using other indicators which cover the gaps left by the indicator.
RSI is a very appropriate since they can show you the market status of the asset you are analysing.
Potential drawbacks
As mentioned above, the three exponential moving averages leave certain blind spots. Luckily, there are numerous indicators that you use to cover these deficiencies including RSI, which shows you the true value status of the asset you are analysing. MACD a histogram indicator can help you confirm the observations you have made with the triple MA crossover strategy to avoid false signals.
Complementary tools and techniques
When it comes to data when trading, a maximalist approach is always better. Adding other indicators to further identify trends and confirm what you are seeing the triple moving average crossover is showing you can be invaluable.
Conclusion
The triple moving average crossover strategy can give you a lot of information at a glance, but should be used with other indicators technical analysis tools and indicators.
Keep an eye out when the fastest moving average of the combination crosses over the medium EMA and signals indicating a longer term trend or short term trends.
What is the triple moving average crossover strategy?
It is a strategy that uses three EMAs. When these indicators cross they are assumed to yield specific signals, depending on the trend direction.
Is TEMA a good indicator?
It can be a powerful combination of indicators, especially when used in conjunction with other tools.
What happens when 3 moving averages cross?
When the EMAs of TEMA cross, they yield various trading signals. When the fastest cross the middle EMA known as a golden cross, the markets are in an uptrend, if the slowest EMA crosses the middle, then the markets are trending downwards.
You can also identify market momentum by the distance between the EMAs, the wider the distance the more momentum the current trend has.
Risk warning: Our products are complex financial instruments which come with a high risk of losing money rapidly due to leverage. These products are not suitable for all investors. You should consider whether you understand how leveraged products work and whether you can afford to take the inherently high risk of losing your money. If you do not understand the risks involved, or if you have any questions regarding our products, you should seek independent financial and/or legal advice if necessary. Past performance of a financial product does not prejudge in any way their future performance.


