Have you ever wondered how some traders seem to make remarkably accurate predictions in the financial markets? One of the secrets lies in their understanding of technical analysis patterns, and one such powerful chart pattern is the Golden Cross.
This article will delve into the intricacies of the Golden Cross pattern, its significance in technical analysis, and how you can effectively incorporate it and other indicators, into your trading strategy. The golden cross occurs occasionally, and when it does, it causes a lot of traders to pay close attention to the markets. However, the trading signal is one that a lot of traders will use the golden cross strategy along with other technical indicators.
The Technicality Behind a Golden Cross Pattern
To comprehend the Golden Cross pattern, it is essential to grasp the role of moving averages in technical analysis. Moving averages are calculated by averaging a specific a point forward a number of past price points across time periods, which smooths out the price data and provides a clearer trend direction.
The Golden Cross pattern occurs when a shorter-term moving average of asset’s price move, such as the 50-day moving average, crosses above a longer-term moving average, like the 200-day moving average, on a price chart. This crossover signifies a potential shift in the trend of bull market from bearish to bullish and is considered a strong buy signal by many traders.
Graphical illustrations of the Golden Cross pattern can aid in better understanding. When plotted on a price chart, you’ll notice the shorter-term moving average line crossing above the longer-term moving average line, resembling the shape of a “golden cross,” hence the name golden crosses.
How to Trade When You See a Golden Cross Pattern?

Identifying a Golden Cross pattern on a price chart can be a rewarding opportunity for traders. Here are some potential golden cross forms of price action and trading strategies to consider:
- Golden Cross Confirmation: Before making a move, ensure that the Golden Cross is confirmed by a significant increase in trading volume. Higher volume during the crossover enhances the pattern’s reliability. This also means that there are a lot of traders out there with conviction, and this means that you can believe that there could be follow through.
- Buy on Pullback: Instead of entering a position immediately after the Golden Cross, wait for a price pullback to the moving averages’ vicinity. This approach reduces the risk of entering a trade right before a potential price reversal. This is a sound practice in most strategies, as it offers a trader potential value.
- Support and Resistance Analysis: Combine the Golden Cross pattern with support and resistance levels to strengthen your trading decision. Look for the Golden Cross occurring near or above a strong support level, as this may indicate a more robust bullish trend.
- Moving Average Convergence Divergence (MACD): Utilize MACD, a popular technical indicator, to confirm the Golden Cross signal. When the MACD crosses above its signal line, it reinforces the bullish sentiment. However, this is considered to be a secondary indicator.
Setting Stop-Loss Orders with Golden Cross Pattern
While the Golden Cross pattern can offer lucrative opportunities, it is crucial to implement risk management strategies to protect your capital. Placing stop-loss orders is an effective method to mitigate potential losses from golden cross investment strategy. Here’s how you can do it:
- Identify Critical Support Levels: Determine key support levels on the price chart and place your stop-loss order slightly below these levels. This way, if the price reverses, you’ll exit the trade before significant losses occur.
- Trailing Stop-Loss: Consider using a trailing stop-loss, which adjusts your stop price as the price moves in your favor. This technique allows you to secure profits while giving the trade room to breathe. However, it is prone to struggle with sudden drops in price, and can sometimes get you out too early.
- Risk-Reward Ratio: Maintain a favorable risk-reward ratio for your trades. Ensure that your potential profit is at least two to three times greater than your risk exposure. This is always a good idea, no matter the trade set up.
Common Mistakes When Trading the Golden Cross Pattern
Even with a sound understanding of the full and use the Golden Cross trading pattern, traders can fall into common pitfalls. Here are some mistakes to avoid:
- Ignoring Volume: Failing to consider trading volume during the Golden Cross can lead to false signals. Always validate the pattern with substantial volume. Volume typically shows signs of true intention, allowing traders to “jump into the market with others.”
- Overlooking Market Conditions: The Golden Cross may not be as effective in choppy or sideways markets. Analyze the broader market conditions before placing your trades. The strategy needs a trend to follow, as the moving averages are lagging indicators.
- Chasing the Cross: Jumping into a trade too late, after the Golden Cross has already been established, may lead to reduced profit potential. Be patient and wait for pullbacks or retracements before entering a trade.
- Neglecting Risk Management: In the excitement of a potential profitable trade, traders may overlook setting stop-loss orders. Proper risk management is crucial to preserve capital and avoid significant losses.
Expert Opinions on Golden Cross Pattern
To gain further insights into the Golden Cross pattern, let’s take a look at some chart patterns and what some trading experts have to say:
John Smith, a renowned technical analyst, states, “The Golden Cross is a powerful bullish signal, especially when bear market is supported by high trading volumes and robust volume. It can provide excellent entry points for long-term investors.” However, it does lack any real use for short-term traders, as the area around a golden cross can be very noisy.
Furthermore, the market can be difficult to navigate around these crosses, so many investors will slowly enter a position, adding to it once the momentum starts to pick up. The trading strategy then calls for possibly hanging onto the position until the moving averages cross again, in what is known as a death cross. That being said, it is worth noting that waiting for when the death cross occurs can lead to giving back quite a bit of the potential gains.
Mary Johnson, a seasoned trader, advises, “I often use both the Golden Cross and in conjunction with other technical and momentum indicators, like the Relative Strength Index (RSI) to confirm the strength of the trend. This helps me filter out false signals.” There are also other indicators that professionals follow, and it comes down to your personal perference and any backtesting that you have done.
Real-World Examples of Successful Golden Cross Trades
Let’s explore a few real-world examples of successful Golden Cross trades:
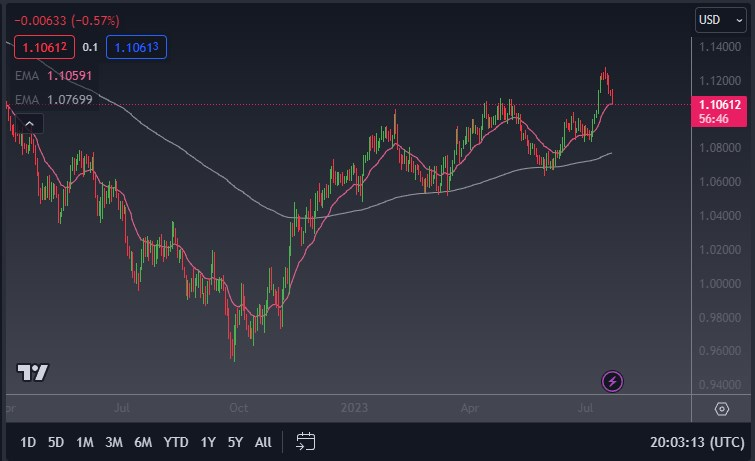
Example 1: EUR/USD

- In late 2022, EUR/USD’s 50-day moving average crossed above its 200-day moving average.
- The crossover was accompanied by a substantial trend line.
- Traders who spotted this Golden Cross and entered the trade saw the pair price surge by over 8% within the next few months. However, it is worth noting that there was quite a bit of choppy behavior along the way. The euro entered a channel that was quite noisy, albeit positive overall.
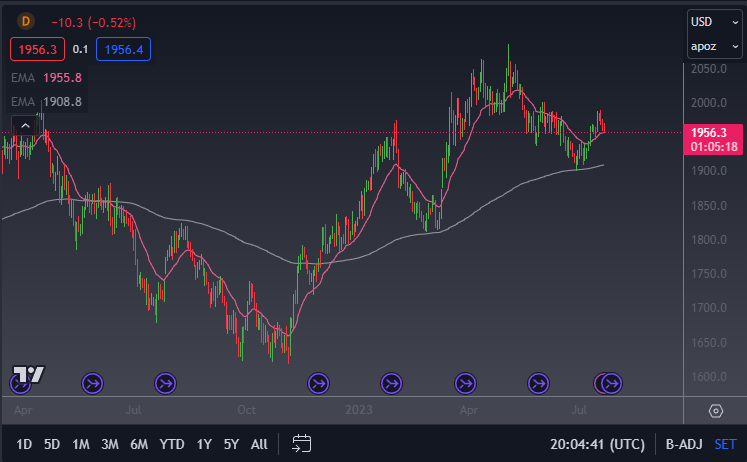
Example 2: Gold Futures

- On the daily chart of Gold Futures, the Golden Cross occurred in late 2022.
- The precious metal rallied significantly over the following year, rewarding traders who capitalized on the pattern with substantial profits, at one point gaining over $250/ounce.
Conclusion: Making Profitable Trades with Golden Cross Pattern
The Golden Cross pattern holds immense significance in technical analysis as a reliable bullish signal. By understanding the technicalities behind the pattern and using various technical analysis tools, traders can confidently identify profitable trading opportunities.
However, it is crucial to exercise caution, employ risk management strategies, and avoid common mistakes while incorporating the Golden Cross trading strategy into your trading strategy. With practice and discipline, the Golden Cross pattern can become a valuable trading tool used in your arsenal to navigate the financial markets successfully. While this isn’t the only tool you should have, it is worth noting that the golden cross strategy is one that is widely followed, and therefore it is one that you have to be aware of.
What is a golden cross in trading?
A Golden Cross is a technical analysis pattern that occurs when a shorter-term moving average crosses above a longer-term moving average on a price chart. It signals a potential shift upward price movement in trend from bearish to bullish. However, it can be kind of messy, and a lot of people can have losses who don't pay attention to a lack of trend, which is important. A sideways market renders the golden cross a bit useless.
How does Golden cross work?
The Golden Cross works by identifying a bullish trend reversal or upward momentum in the market. When the shorter-term moving average crosses above the longer-term moving average, the golden cross occurs it indicates that the bullish momentum is gaining strength.
Most traders will use another momentum indicator to add to the confidence of the signal. By doing so, the traders out there can gain a bit of confidence.
Is a golden cross bullish or bearish?
The Golden Cross is a bullish trading signal again, suggesting a potential upward trend in the stock market again. However, the market can be quite noisy, so you need to still practice money management, and of course make sure you have all of your risk management tools in effect.
Risk warning: Our products are complex financial instruments which come with a high risk of losing money rapidly due to leverage. These products are not suitable for all investors. You should consider whether you understand how leveraged products work and whether you can afford to take the inherently high risk of losing your money. If you do not understand the risks involved, or if you have any questions regarding our products, you should seek independent financial and/or legal advice if necessary. Past performance of a financial product does not prejudge in any way their future performance.


