The USD/JPY currency pair is one of the most traded forex pairs in the world, and for good reason. Its high liquidity and frequent price movements are driven by the major role the US and Japanese economies play in global markets.
Whether you’re just starting out, refining your strategy, or trading professionally, this guide has something for everyone. Trading USD/JPY is a wide-reaching topic, and gaining a deeper understanding can lead to smarter decisions in the forex market.
An introduction to USD/JPY: why this pair matters for traders
The relationship between the United States and Japan is one of the most important in the modern economic world. That connection plays out every day in the USD/JPY currency pair. Labeling it as a battle between the US dollar and the Japanese yen doesn’t really capture the depth of the relationship. It’s a reflection of decades of cooperation and competition between two economic giants.
That’s why the USD/JPY currency pair is consistently one of the most traded in the foreign exchange market. Traders are drawn in by its high liquidity, strong trading volume, and active price movement, particularly during the Asian trading session when Tokyo markets come online.
Key features of the USD/JPY currency pair
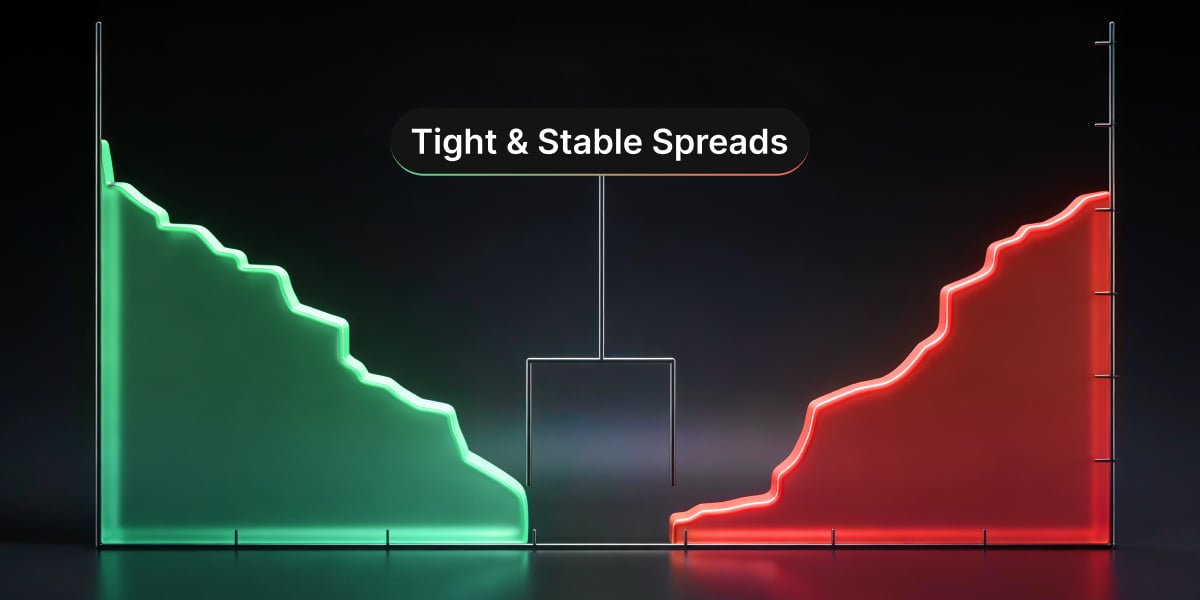
USD/JPY accounts for roughly 13.5% of daily forex turnover. This substantial trading volume translates into high liquidity, often resulting in tight spreads, which are optimal for trading.
The pair’s price action is heavily influenced by interest rate differentials, central bank policy changes, and major geopolitical events. It tends to see the most movement during active trading hours, especially when sessions overlap.
Historical price movements and global influences
To visualise how closely the USD/JPY exchange rate is tied to economic events, let’s take a look at a few key moments.
- After the 2008 financial crisis, the Bank of Japan did everything to avoid any interest rate hikes, which weakened the yen over time.
- More recently, on 1 May, 2025, the yen dropped about 0.6% after the Bank of Japan held their rates steady. At the same time, rising concerns over the new U.S. tariffs made investors nervous about global economic growth, sending USD/JPY even higher.
With reactions like these, it’s no surprise that news trading is so popular among swing traders, especially with globally significant pairs like USD/JPY.
Trading involves risk.
What drives the USD/JPY exchange rate?
Understanding what moves the USD/JPY exchange rate is key to trading this pair effectively. A mix of economic policy, data releases, political shifts, and overall market sentiment all come into play. Sometimes gradually, sometimes in a matter of seconds.
Monetary policy – Federal Reserve vs Bank of Japan
The Federal Reserve and the Bank of Japan have very different approaches. The Fed’s monetary policy stance often includes raising rates to fight inflation or support growth, while the BoJ typically keeps rates low to stimulate economic activity. This interest rate gap plays a major role in USD/JPY price movements.
Economic data and political uncertainty
Economic indicators like inflation, GDP, and employment can strengthen or weaken either currency, depending on whether the results exceed or miss market expectations. Political events, like elections or trade tensions, can also trigger sharp reactions.
Market sentiment and news impact
Short-term moves in USD/JPY are often driven by market sentiment, especially when headlines take traders by surprise.
Even without major data releases, unexpected news or policy shifts can cause sudden reversals. In such moments, traders’ risk appetite can be just as influential as the actual economic figures.
Best times to trade USD/JPY
Timing can make all the difference when trading USD/JPY. Like other major currency pairs, it tends to follow global trading sessions, but as any other pair, it has its own rhythm, shaped by the economies it represents and the hours their markets are active.
Tokyo and New York sessions
The pair tends to move more during the Tokyo session, as Japanese news and BoJ updates hit the market. Later, the New York session brings fresh volatility, driven by US data releases.
Overlap periods and volatility
The overlap between the London and New York sessions is one of the busiest times in the forex market, offering strong liquidity and some of the most significant price movements of the day. This applies to most major currency pairs, including USD/JPY.
Tracking economic announcements
Economic calendars are essential tools. As we already established, events like rate decisions, inflation reports, and jobs data can cause stronger moves, making timing just as important as direction that given currency pair is going.
Technical analysis for USD/JPY trading
Technical analysis is a vital part of trading any currency pair. Forex pairs as USD/JPY often align with chart patterns, price levels, and indicators, which makes them a great candidate for traders who rely on visual tools to spot the best entry and exit points. In short, chart analysis can offer valuable insights.
Essential technical indicators and price levels
While trading USDJPY, technical analysis tools help traders understand price direction and possible turning points. They’re commonly used to time entries, confirm trends, or manage risk. Let’s go over a few of the most useful ones.
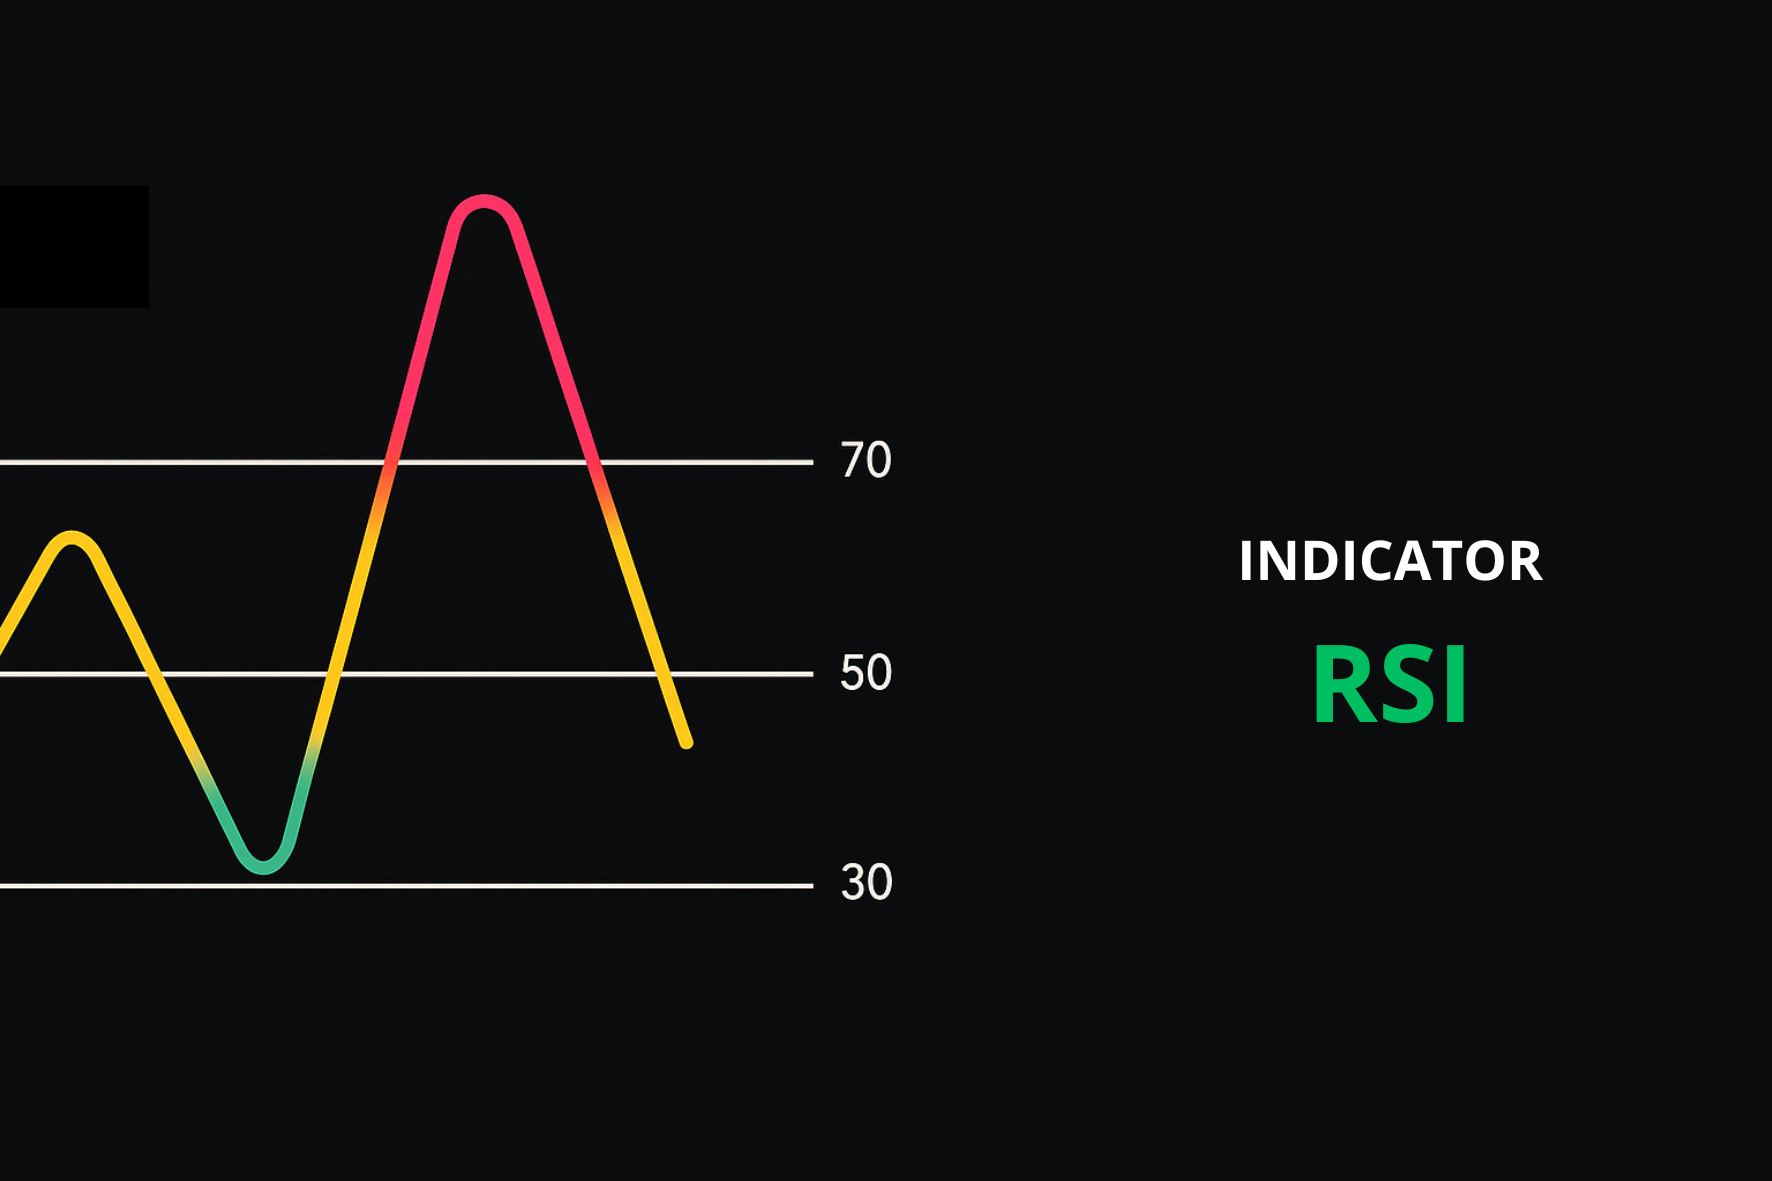
- RSI (Relative Strength Index)
RSI measures how fast and how far the price has moved. It helps spot when the market might be “overbought” (too high) or “oversold” (too low). This can be a signal that reversal is around the corner.
- MACD (Moving Average Convergence Divergence)
MACD tracks the strength and direction of a trend. It’s useful for spotting when momentum is building or fading, which can help with timing entries or exits.
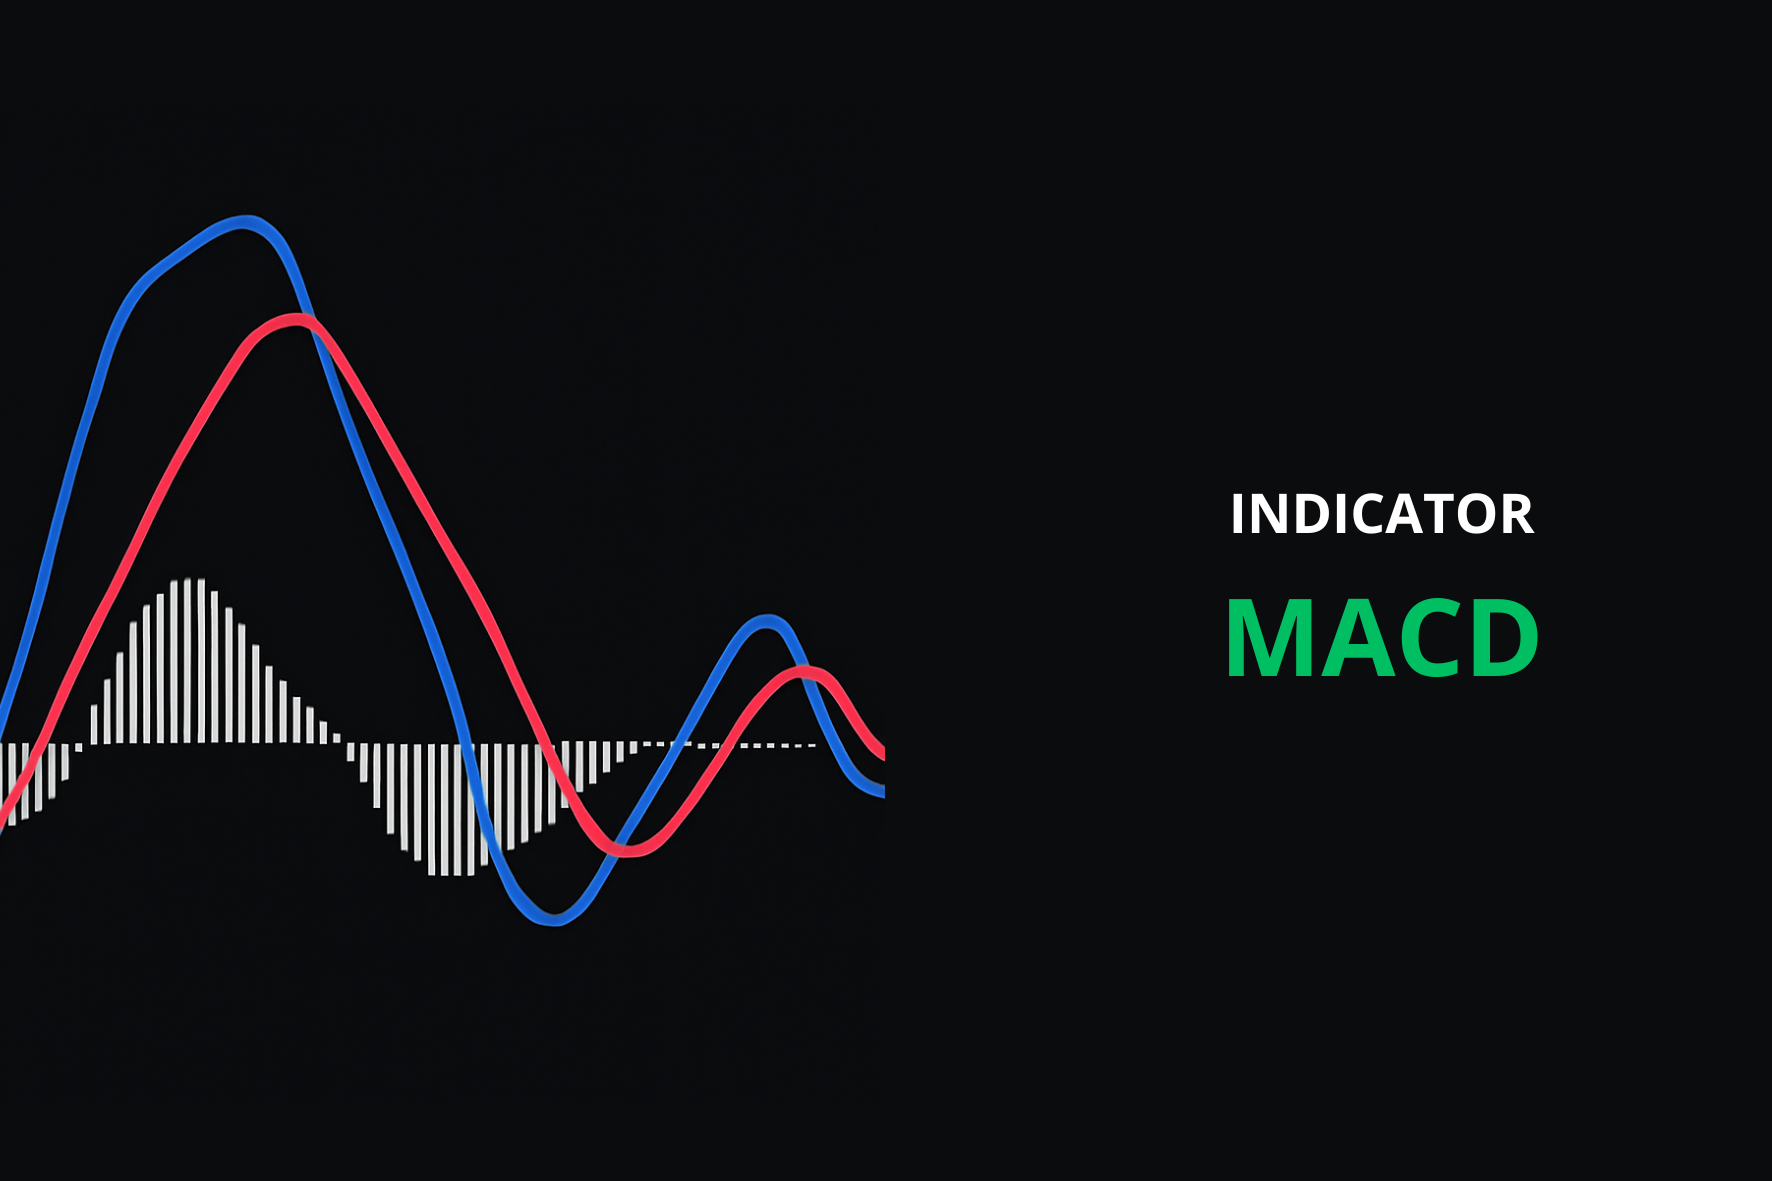
Chart patterns: from flags to pennants
Among the more recognisable chart patterns, we have flags and pennants. Those two classic setups are well known and are used by traders quite often.
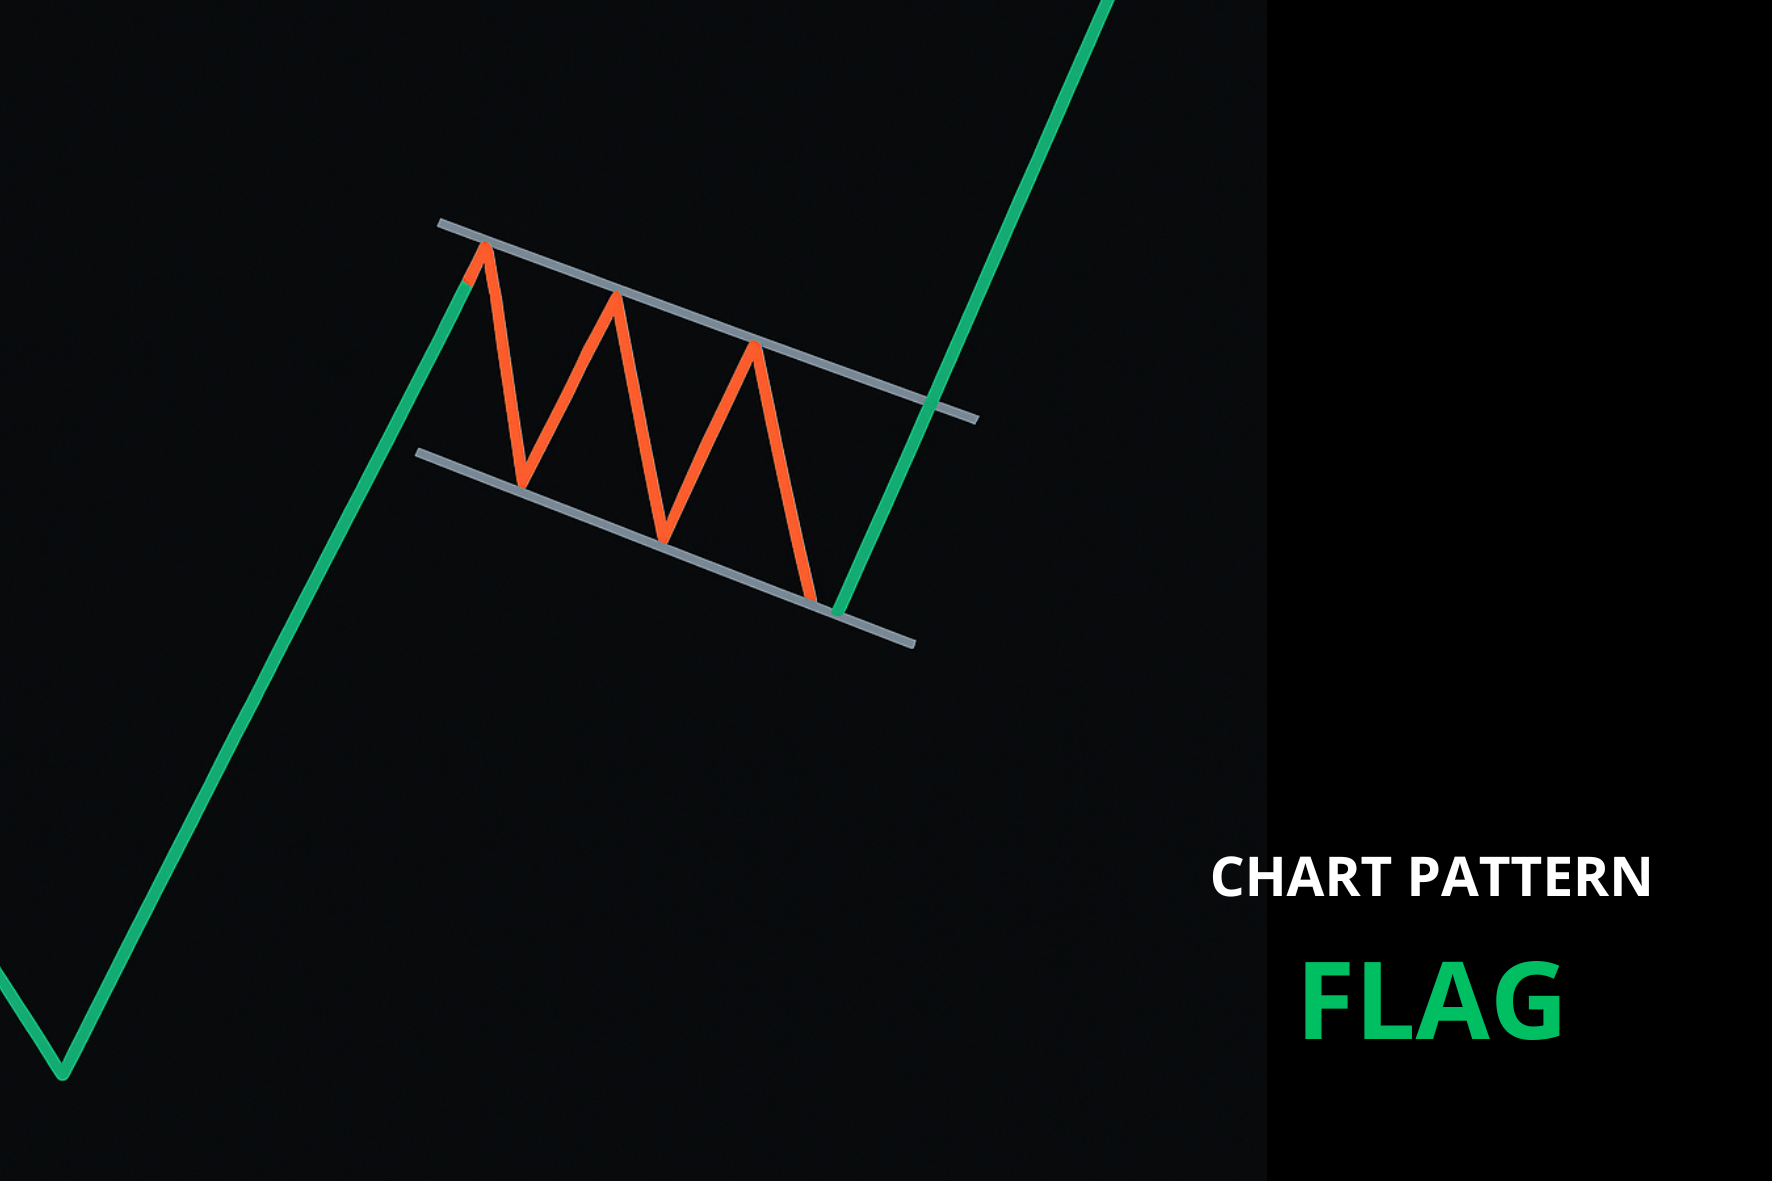
- Flag
A flag forms after a strong and fast price move, either up or down. The price starts to move sideways or slightly in the opposite direction, creating a small rectangular shape on the chart. This pause is usually not long and looks like, as a name suggest, a flag.
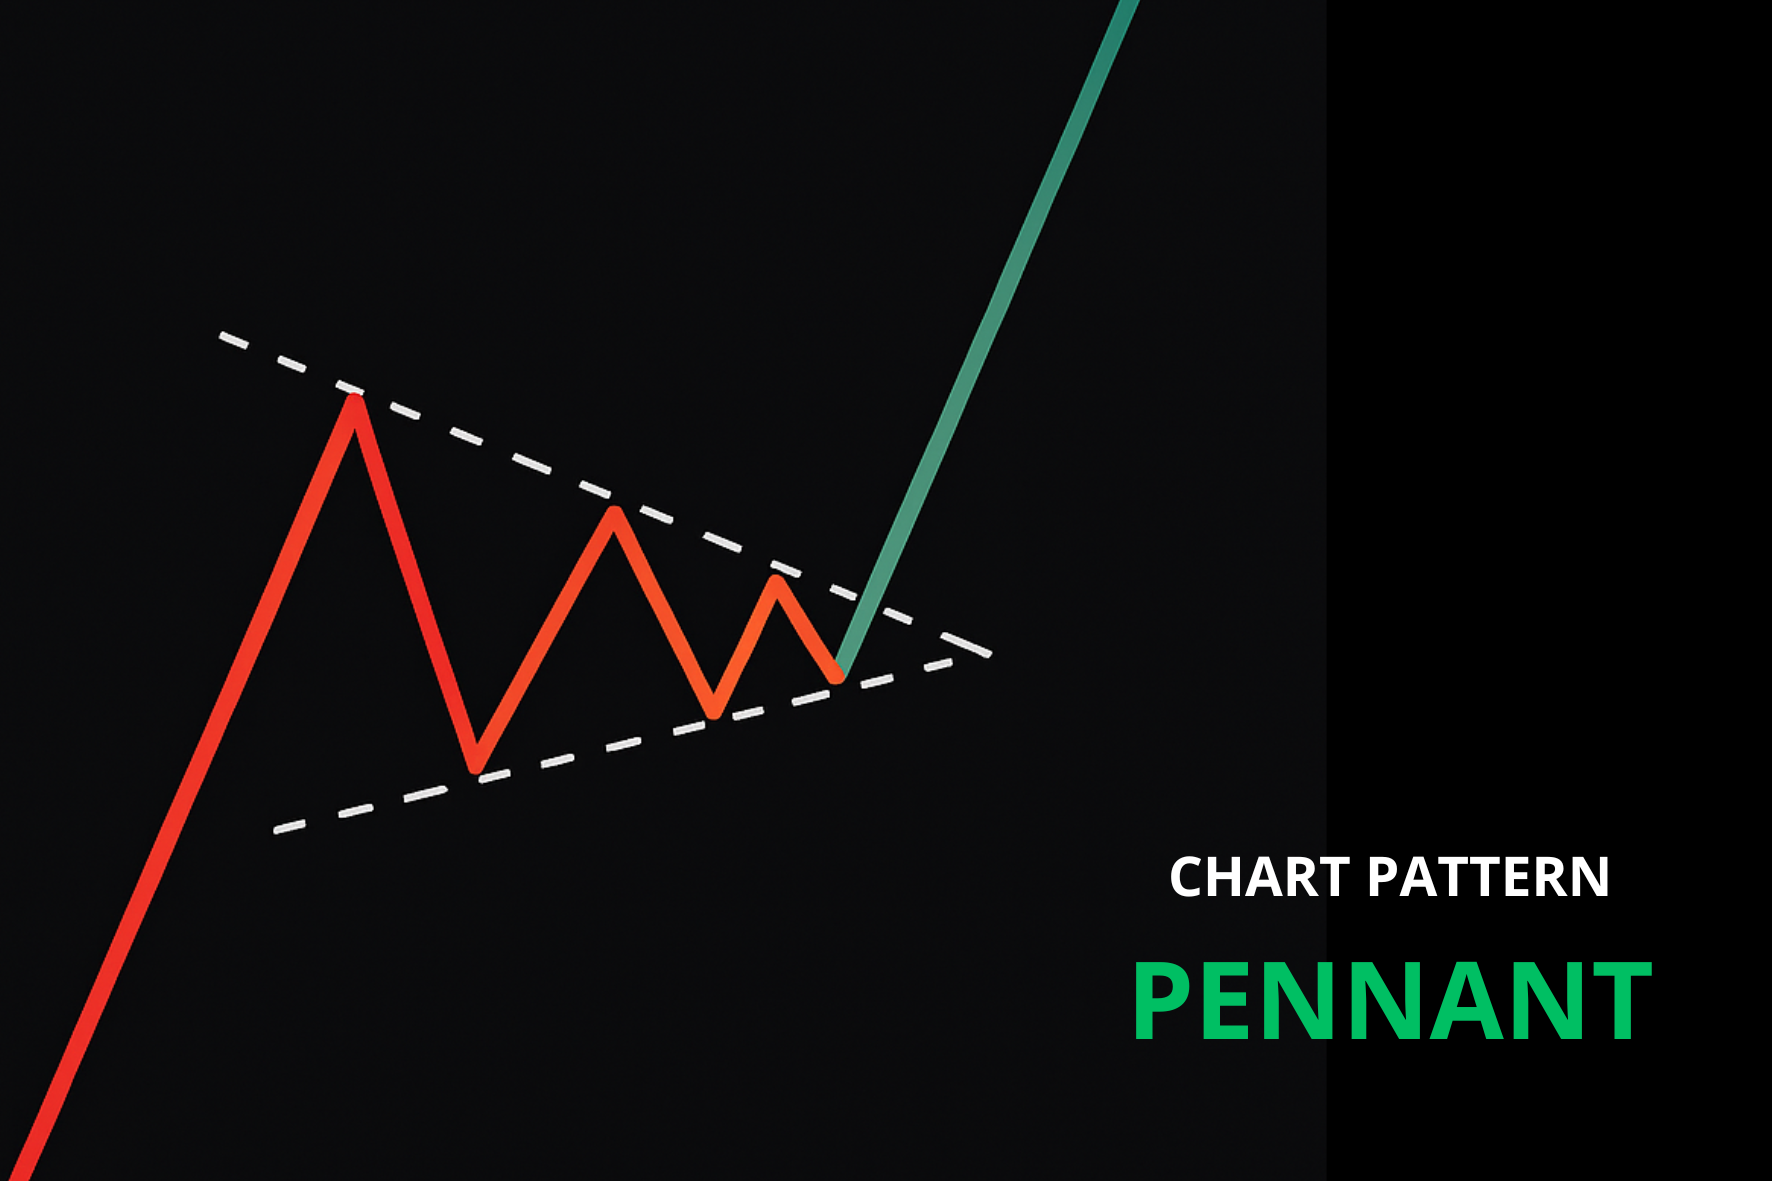
- Pennant
A pennant looks a bit different, though it forms under similar conditions. After a strong price surge or drop, instead of a rectangle, the price starts to squeeze into a small triangle shape. Once this tight range breaks, the price often continues in the same direction, following either upward or downward trend.
Interpreting candlestick charts
Candlestick patterns often act as visual clues. They reflect human decisions and those are driven by emotions. It’s market psychology in a nutshell. So, which candlestick formations are worth knowing?
- Doji
A small-bodied candle with long wicks on both ends. A doji shows indecision in the market and often appears before a change in direction.

- Engulfing
Slightly harder to spot at first, but with a bit of practice, it becomes easy to recognise. An engulfing candle fully covers the previous one, often signalling a shift in momentum.

- Hammer
Usually seen at the bottom of a downtrend, this candle has a long lower wick and a small body on top. It resembles a tail, as it may suggest that a potential reversal is on the way.

Trading involves risk.
Popular strategies for trading USD/JPY
There’s no one-size-fits-all approach to trading USD/JPY. Some traders go for quick trades, while others prefer to dive deeper into fundamentals and hold positions for days or even weeks.
So what are the most commonly used strategies across different timeframes?
Intraday and scalping approaches
These strategies focus on making small profits from short-term price movements throughout the day. Traders who follow this style often use low timeframes, such as the 1-minute, 5-minute, or 15-minute charts, along with tight stop-losses. In this case, timing and fast execution are everything.
Trading on economic news
Volatility often rises around key announcements. Traders place pending orders before major data drops. Others take a more aggressive approach, positioning for a surprise outcome for potentially larger gains.
Swing and longer-term strategies
This style works well for traders who prefer to hold positions for longer periods. It combines big-picture thinking with technical signals on the chart. The goal? To enter before a larger move and stay in the trade for several days.
Strategies based on pair correlations
By comparing USD/JPY to other popular trading pairs like GBP/USD or even assets like gold, traders can spot patterns and time trades more effectively.
Trading USD/JPY with CFDs: practical tips and risks
CFDs stands for Contracts for Difference. In short, they allow traders to speculate on price movements without owning the actual asset.
When trading CFDs, you’re essentially predicting whether the exchange rate will go up or down, while being exposed to both potential profits and significant risk.
Advantages and drawbacks of trading CFDs
Pros:
- Access to larger positions with relatively small capital
- Flexibility to go long or short
- Access to a wide range of instruments
Cons:
- Leverage increases position exposure
- Potential overnight fees for holding trades open longer
- Requires careful position sizing and margin awareness
A step-by-step guide to opening a trade
Opening a GBP/USD position is straightforward. The steps are as follows:
- Choose GBP/USD from the list of available currency pairs.
- Analyse the chart based on patterns and indicators in order to find an entry point.
- Set stop loss and take profit levels to avoid emotional trading and minimise the risk.
- Set the position amount and leverage.
- Place the trade.
Calculating margin and selecting leverage
Before placing any trade, it’s worth understanding how margin and leverage work. Let’s look at some simple calculations based on a 100-unit position.
- With 20:1 leverage, you’d need 1/20th of the position size as margin:
100,000 ÷ 20 = 5,000 USD - With 50:1 leverage, the required margin drops further:
100,000 ÷ 50 = 2,000 USD
Using leverage allows access to larger positions with less capital, but it also means price movements have a bigger impact on your position.
Managing risk while trading USD/JPY
Let’s go even further. Risk management is a key part of any trading strategy. Following consistent risk management strategies can help maintain control, even during tough market conditions. Why? Because it helps build a structure around your decisions, no matter what the market does.
By defining your limits and following a simple routine, you can stay calm at all times. That’s the way to keep your risk appetite under control.
Setting stop-loss and take-profit
These tools help define the boundaries of your trade. It’s important to define how much you’re willing to risk and when you want to take profits.
For example, if you enter a USD/JPY trade at 150.00, you might set a stop-loss at 149.50 and a take-profit at 150.80. This gives you a clear plan and helps prevent second-guessing once the trade is active.
Defining daily risk limits
How do you stay disciplined while trading? Set a daily loss limit. For example, you could risk no more than 3 percent of your account balance. This way, you’ll know when to step back if the market isn’t going your way.
Building a simple risk management plan
A solid plan outlines how much to risk per trade, how many trades to take, and when to step away. Keeping it written helps you stay consistent.
Trading involves risk.
Common trading mistakes to avoid
Overtrading
Boredom and frustration can cloud good judgement. Placing too many trades or trying to recover losses quickly can lead to mistakes. It’s a good idea to take breaks, reset your focus, and avoid spending too much time glued to the charts.
Letting emotions drive decisions
Emotions can play a big role in trading outcomes. Decisions driven by fear, frustration, or excitement, such as entering a trade because of FOMO, can lead to actions you might not take in a calmer state. Recognising emotional triggers is the first step toward avoiding them.
Overlooking fundamental news
Focusing only on charts while ignoring economic events can be risky. Even a strong technical setup can be disrupted by a surprise rate decision or unexpected news. Keeping an eye on the economic calendar helps you stay prepared for potential market shifts.
How to start USD/JPY trading
It only takes a few minutes to get started and open your first USD/JPY position.
Here’s how:
- Sign up for your personal PrimeXBT account.
- Set up your trading account and verify.
- Deposit funds.
- Select USD/JPY from the currency pairs and wait for the right entry point to place an order!
Final thoughts
Trading the USD/JPY currency pair offers a wide range of opportunities connected with the US dollar and Japanese yen, whether you’re after quick intraday setups or prefer a longer-term, more strategic approach.
In this guide, we’ve covered how the pair moves, what drives its volatility, and how to manage risk effectively. It doesn’t matter if you’re getting started or just refining your strategy, success often comes down to staying informed, keeping your plan clear, and reacting with discipline, not emotion.
Looking for a place to put it all into practice? PrimeXBT is a trusted broker for traders at every level. With advanced tools, fast execution, MT5 integration, and flexible trading options, it offers everything needed to take the next step.
Trading involves risk.
Is USD/JPY good to trade?
USD/JPY is one of the most popularly traded forex pairs, bringing in around 13.5% of daily forex turnover.
Where can I trade USD/JPY?
You can trade USD/JPY through online brokers and trading platforms. Look for one that offers low spreads and useful risk management tools. Global brokers like PrimeXBT can help you fine-tune your strategy as you gain experience.
What is the best session to trade USD/JPY?
The busiest time is when the London and New York session overlap. This period often brings the highest liquidity and volatility of the day.
What is the best indicator for USD/JPY?
There’s no one-size-fits-all answer, but RSI, MACD, and moving averages are among the most popular indicators. These indicators help highlight trend direction and potential reversal points.
The content provided here is for informational purposes only. It is not intended as personal investment advice and does not constitute a solicitation or invitation to engage in any financial transactions, investments, or related activities. Past performance is not a reliable indicator of future results.
The financial products offered by the Company are complex and come with a high risk of losing money rapidly due to leverage. These products may not be suitable for all investors. Before engaging, you should consider whether you understand how these leveraged products work and whether you can afford the high risk of losing your money.
The Company does not accept clients from the Restricted Jurisdictions as indicated in our website/ T&C. Some services or products may not be available in your jurisdiction.
The applicable legal entity and its respective products and services depend on the client’s country of residence and the entity with which the client has established a contractual relationship during registration.


