A successful entry or exit from a trade depends on many factors, among which is the traders ability to properly evaluate current market conditions.
The TTM Squeeze indicator is a complex technical analysis tool that helps traders understand price trends, and search for the best trading opportunities to successfully unfold their strategies.
What is TTM Squeeze indicator?
The TTM Squeeze, originally developed by John Carter, is a volatility-based indicator. It represents a combination of the Bollinger Bands and the Keltner channel indicators, and reflects if a price of an asset is going into a trend to reverse the market from one direction to another.
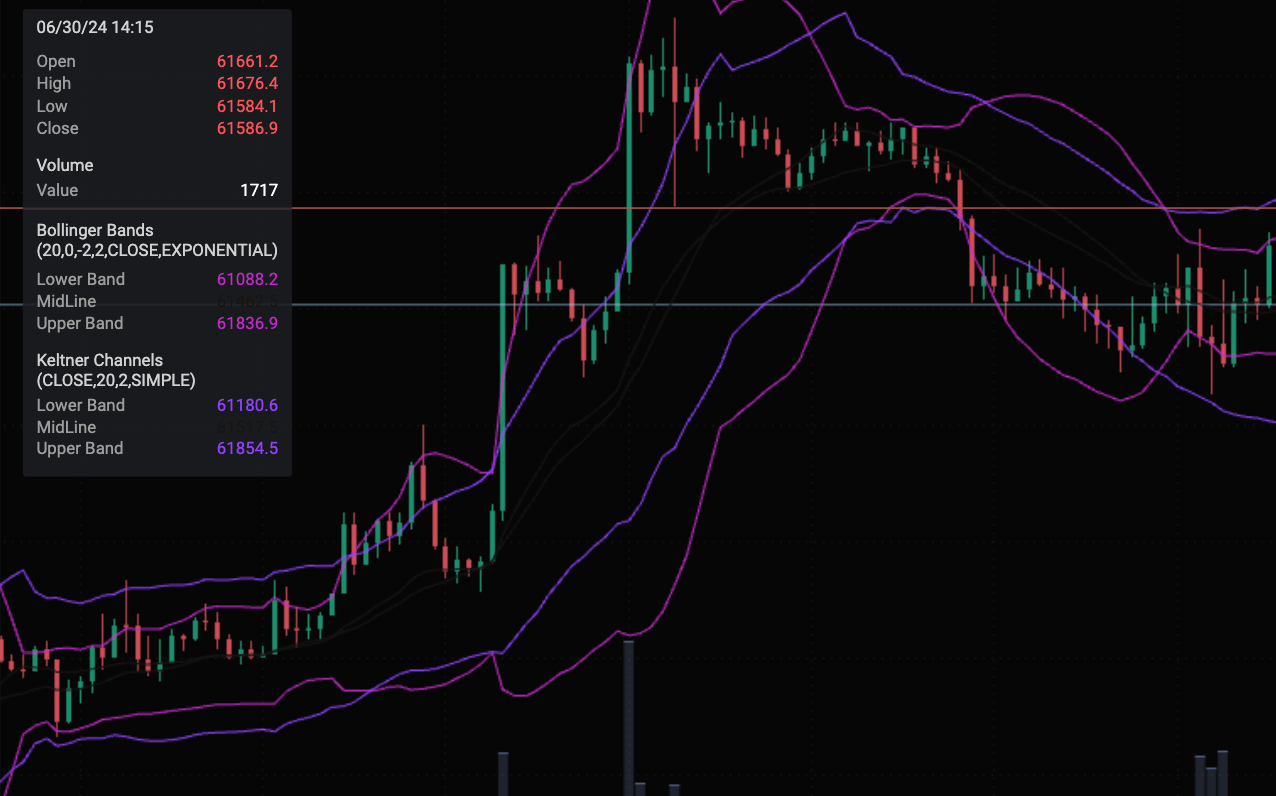
The term “squeeze” speaks for itself and explains the mechanics of this indicator. The squeeze condition occurs when the Bollinger Bands, that represent volatility changes, “squeezes” in or out of the Keltner channels – moving price average of an asset.
The intersection of these two indicators signals to a probable increase or decrease in volatility which may affect the price of an asset, and potentially resulting in a big directional move.
Why is the TTM Squeeze indicator important for traders?
The TTM Squeeze provides essential information for traders seeking to find the best entry and exit points on the market.
Correlation between the volatility component and the average price moves of an asset allows traders to identify potential trends, and benefit by placing trades before the asset actually enters them.
Components of the TTM Squeeze indicator
A well set out strategy using the TTM Squeeze indicator requires understanding of its basic components and what information about the market these components can provide you.
Default indicator settings include 4 core components:
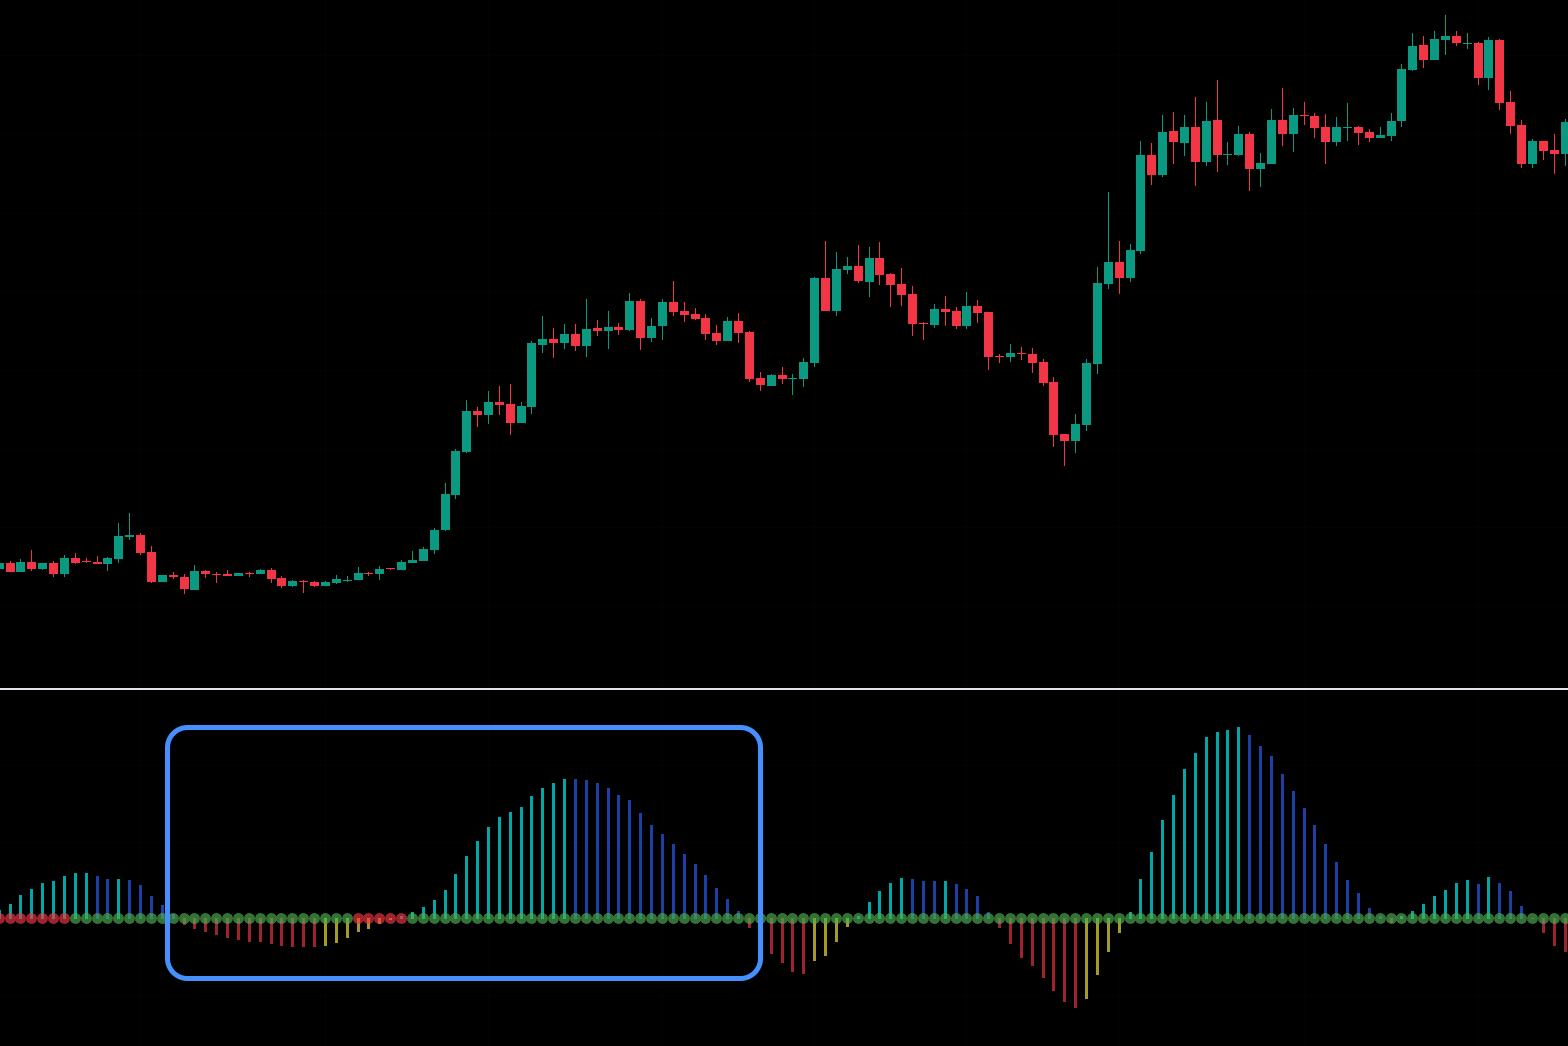
Zero line with red and green dots alternately following each other.
Red dots on the zero line indicate that the Bollinger Bands are moving within the Keltner channels. These readings display periods of low volatility during an assets price compression, or also know is the “squeeze”.
The squeeze fires when the first green dot replaces the red ones. This scenario implies that the Bollinger bands expand beyond the Keltner channels, providing a signal that a potential price action is likely to happen.
TTM squeeze histogram.
The histogram, also known as the momentum oscillator, forms bars above and below the zero line. If the histogram is forming red and dark blue bars, the expected direction is downwards. On the opposite, when the histogram bars turn yellow or light blue – an uptrend is anticipated.
How to use the TTM Squeeze?
The TTM Squeeze indicator provides fundamental data a trader needs to determine the current price trend. However the TTM Squeeze alone cannot provide exhaustive information.
Using the TTM Squeeze along with other indicators allows traders to see a more complete picture of the market and what could be expected.
At a crucial moment, when the Bollinger bands no longer trade inside Keltner channels, volatility is expected to change.
The TTM Squeeze indicator used with such tools as ADX or the TTM Wave can help develop an effective trading strategy.
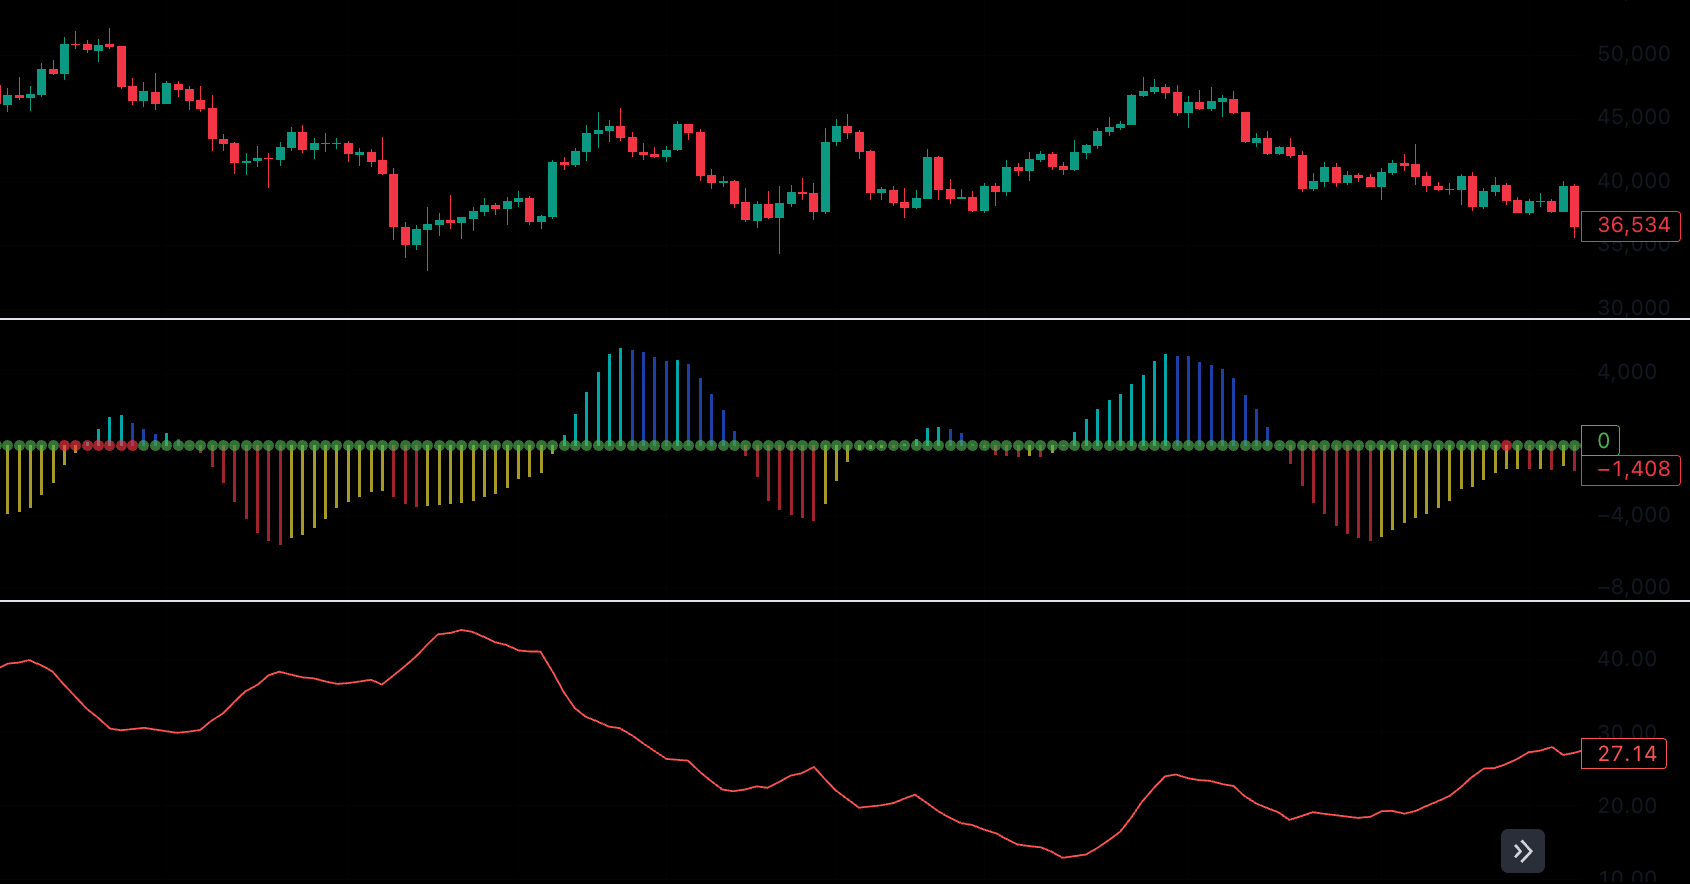
Some of the most dynamic squeezes unfold when volatility raises. Knowing the scales at which the squeeze fires, supplies a trader with invaluable information about the strength of the trend.
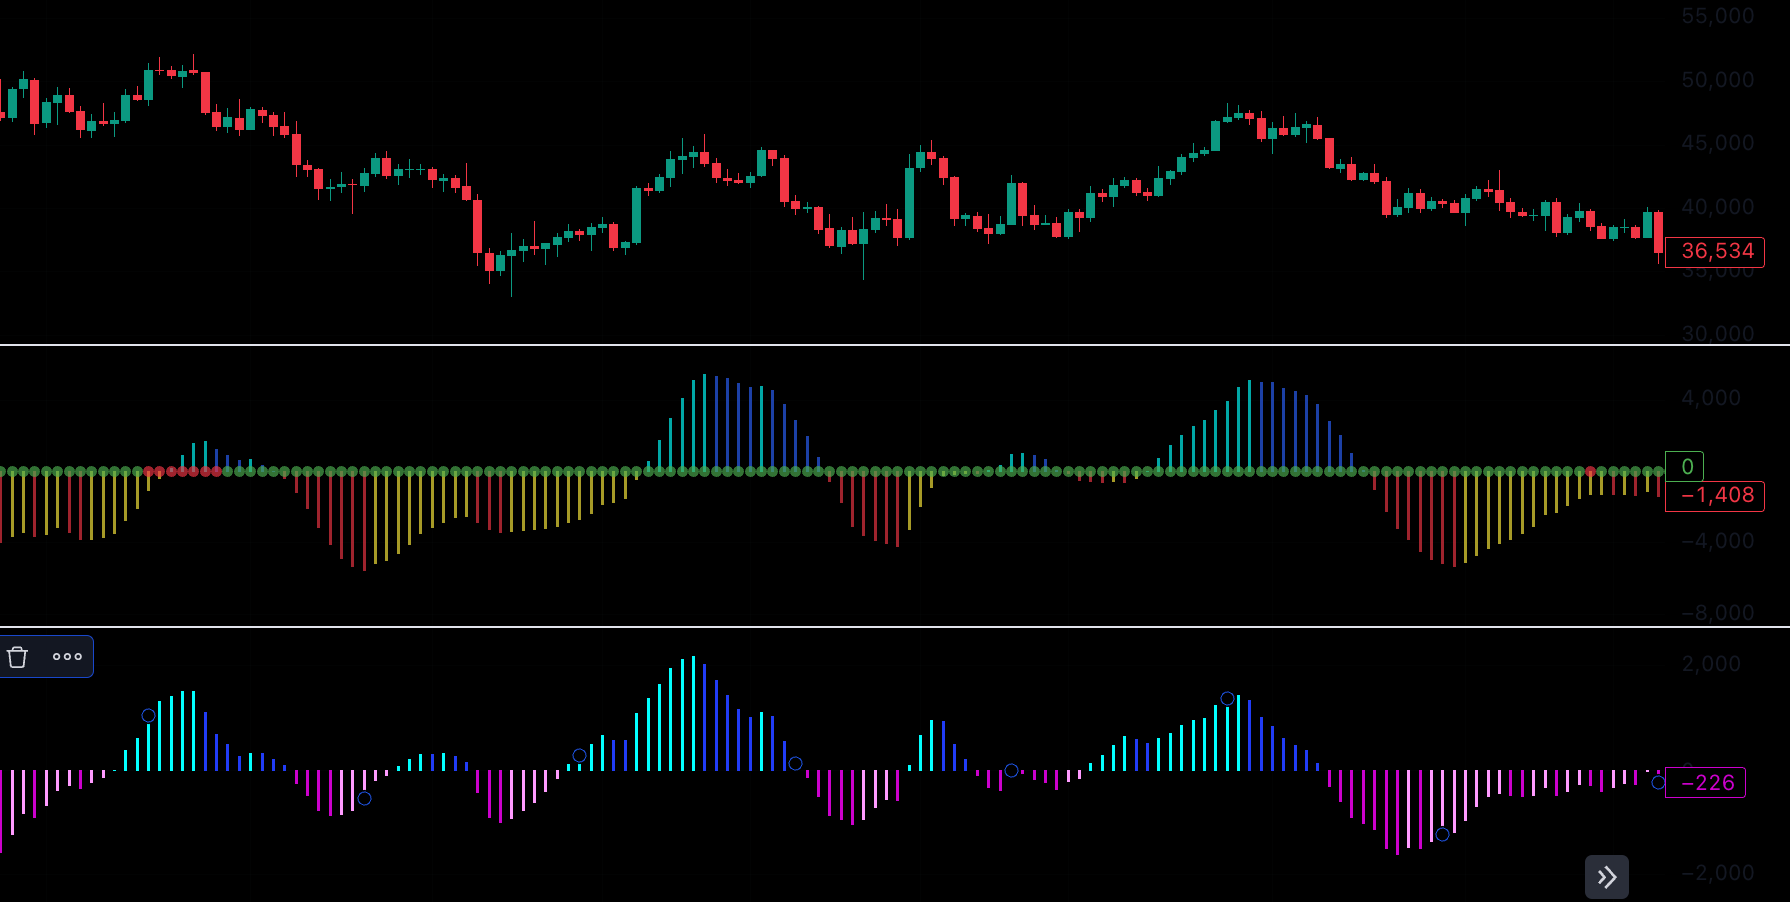
However, knowing the strength of the trend is just a half measure. Analysing the direction of this volatility allows one to understand how exactly the trade could be set up to extract maximum value from the market action.
Example strategy based on TTM Squeeze
To achieve an effective entry into the market a trader would:
- Overview the zero line and analyse the sequence red and green dots create;
- Identify where the dot color turns green;
- If a potential squeeze is detected, check the histogram bars;
- Inspect their colours and determine where in relation to the momentum oscillator they’re formed – below or above;
- Once the squeeze is confirmed, apply the ADX indicator to measure volatility, and the TTM wave indicator to determine its direction;
For example: if the TTM Squeeze points to a squeeze, while the histogram is starting to form a new sequence of bars, entering the trending market would be effective only if volatility is changing from lower to higher values.
TTM Squeeze indicator vs. popular technical indicators
The TTM Squeeze is a unique analysis tool preferred by many traders for its high efficiency and usability.
However there are many other indicators the TTM Squeeze shares similarities with. Here are just a few of these analysis tools:
TTM Squeeze vs. Rate of Change Oscillator (ROC)
Unlike the TTM Squeeze, the ROC indicator calculations are based on an overall price change of an asset.
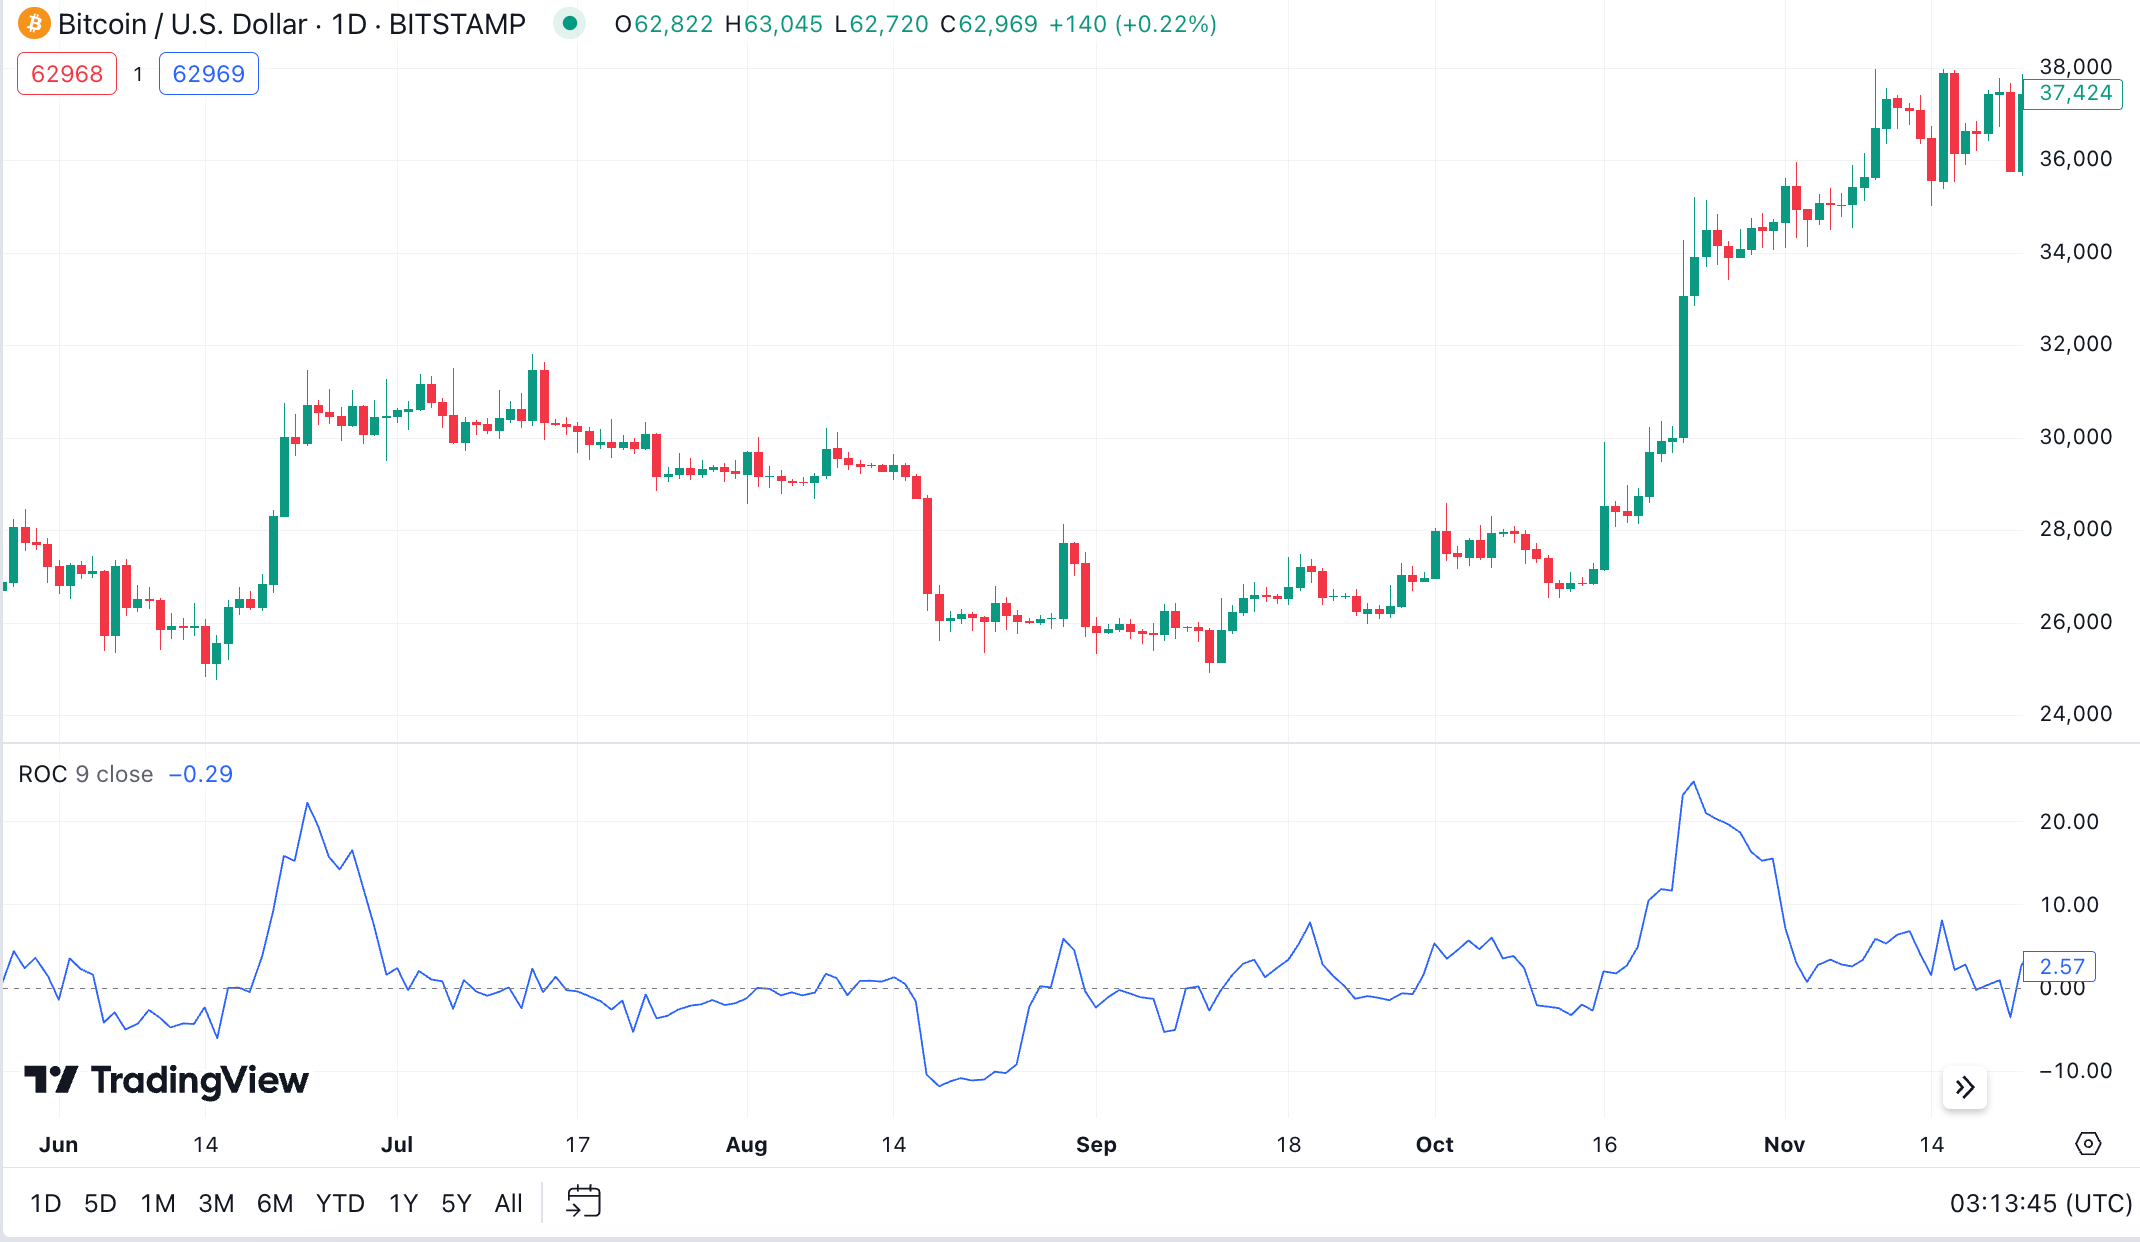
While this tool could be useful on daily chart readings, the TTM Squeeze indicator works well on all timeframes, including daily and hourly chart patterns.
TTM Squeeze vs. Awesome Oscillator (AO)
Similar to the TTM Squeeze, the AO oscillator provides indicative information about upcoming or emerging trends in the market.
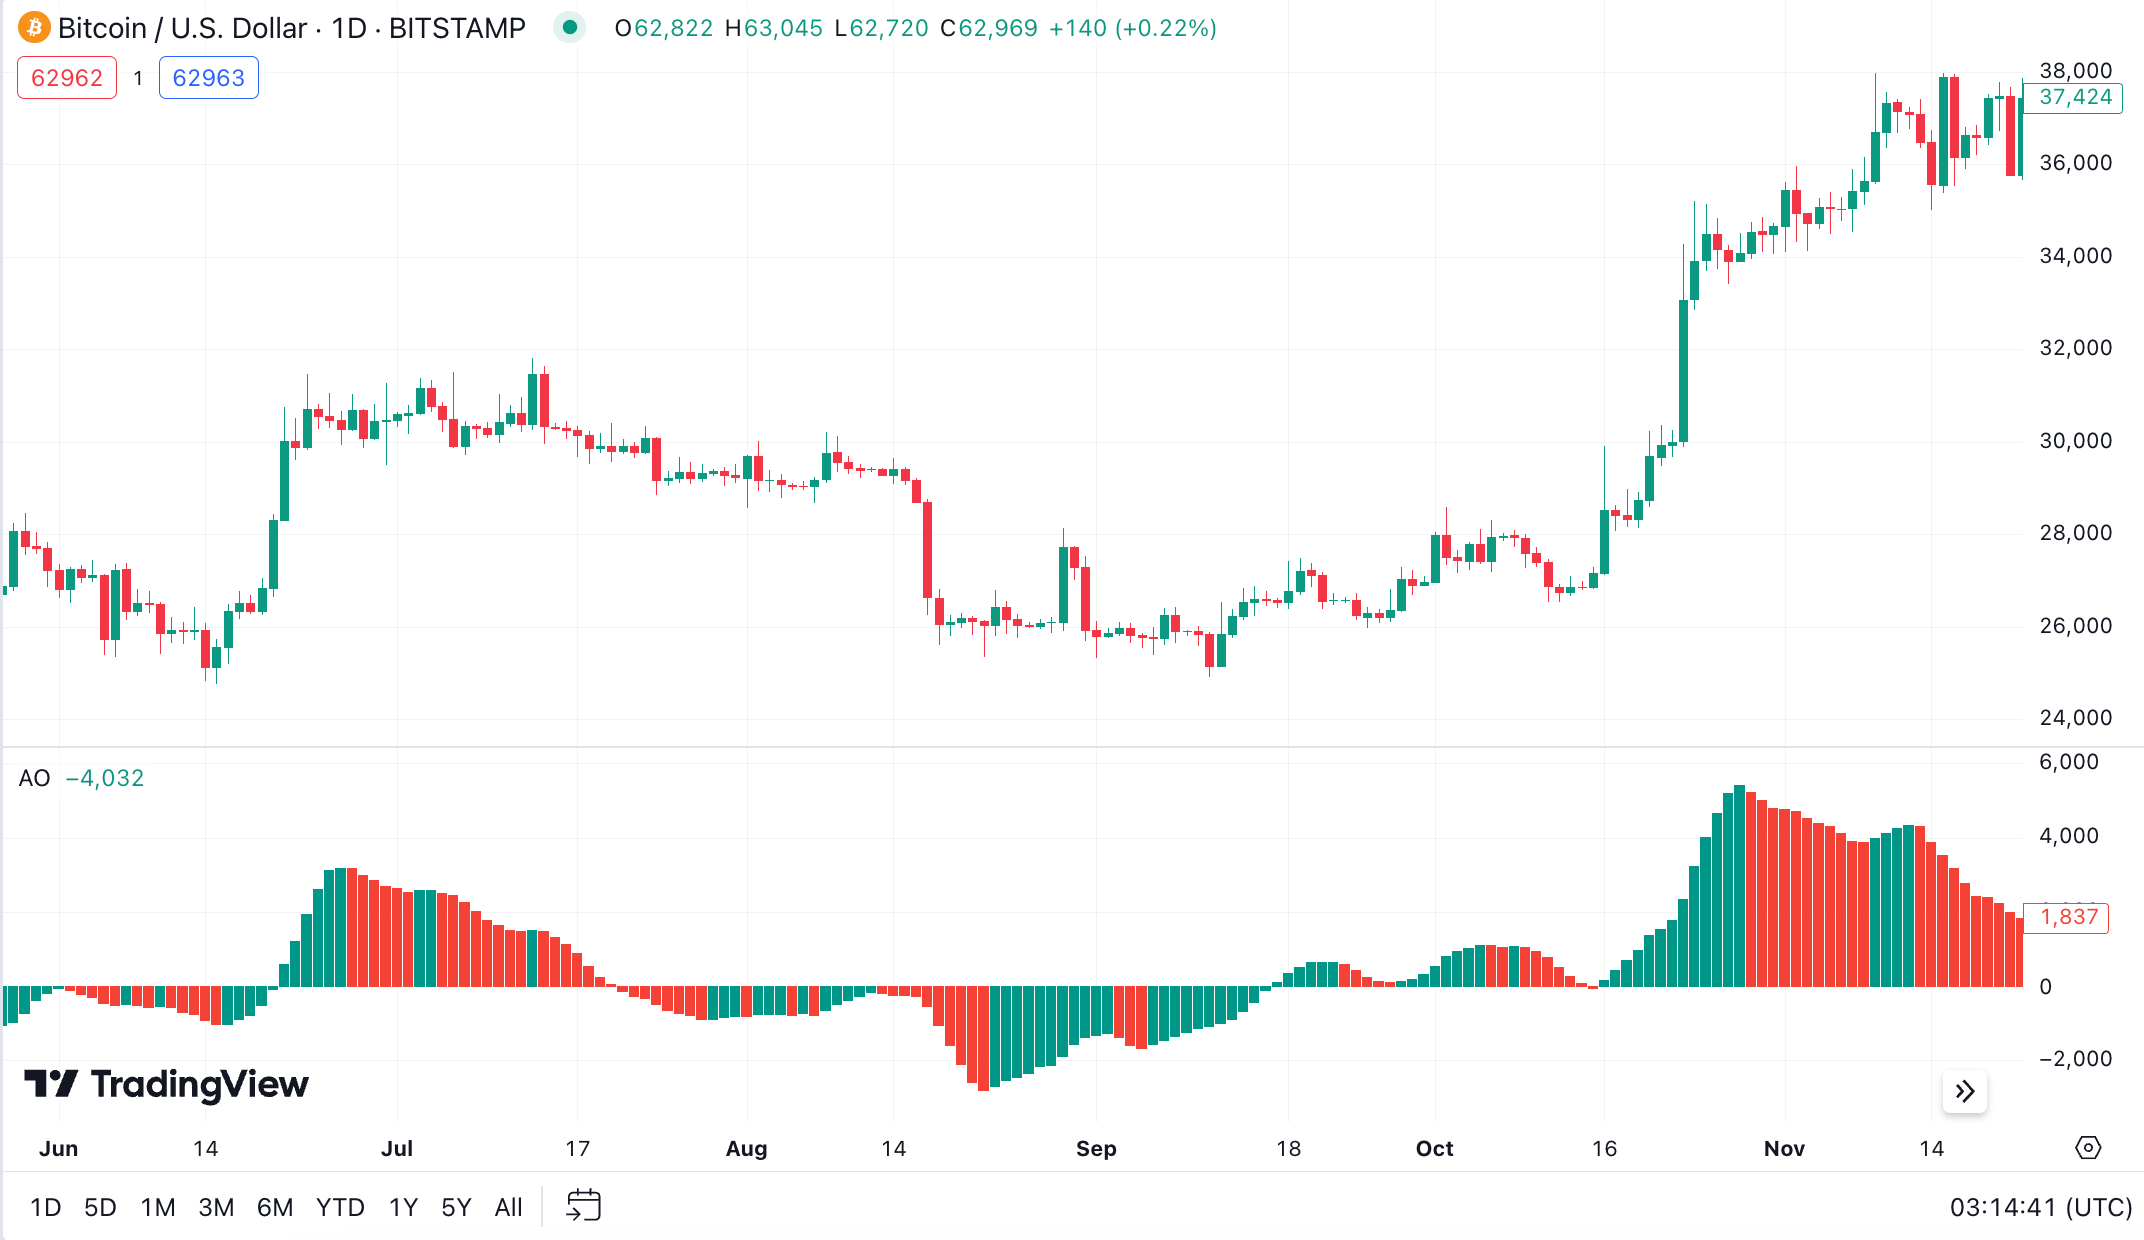
However the core difference is that it uses the SMA price calculation, which is more applicable to the entire trading day period.
TTM Squeeze vs. Moving Average Convergence Divergence (MACD)
The MACD indicator is also very similar to the AO oscillator due to its calculations based on two moving average prices of an asset.
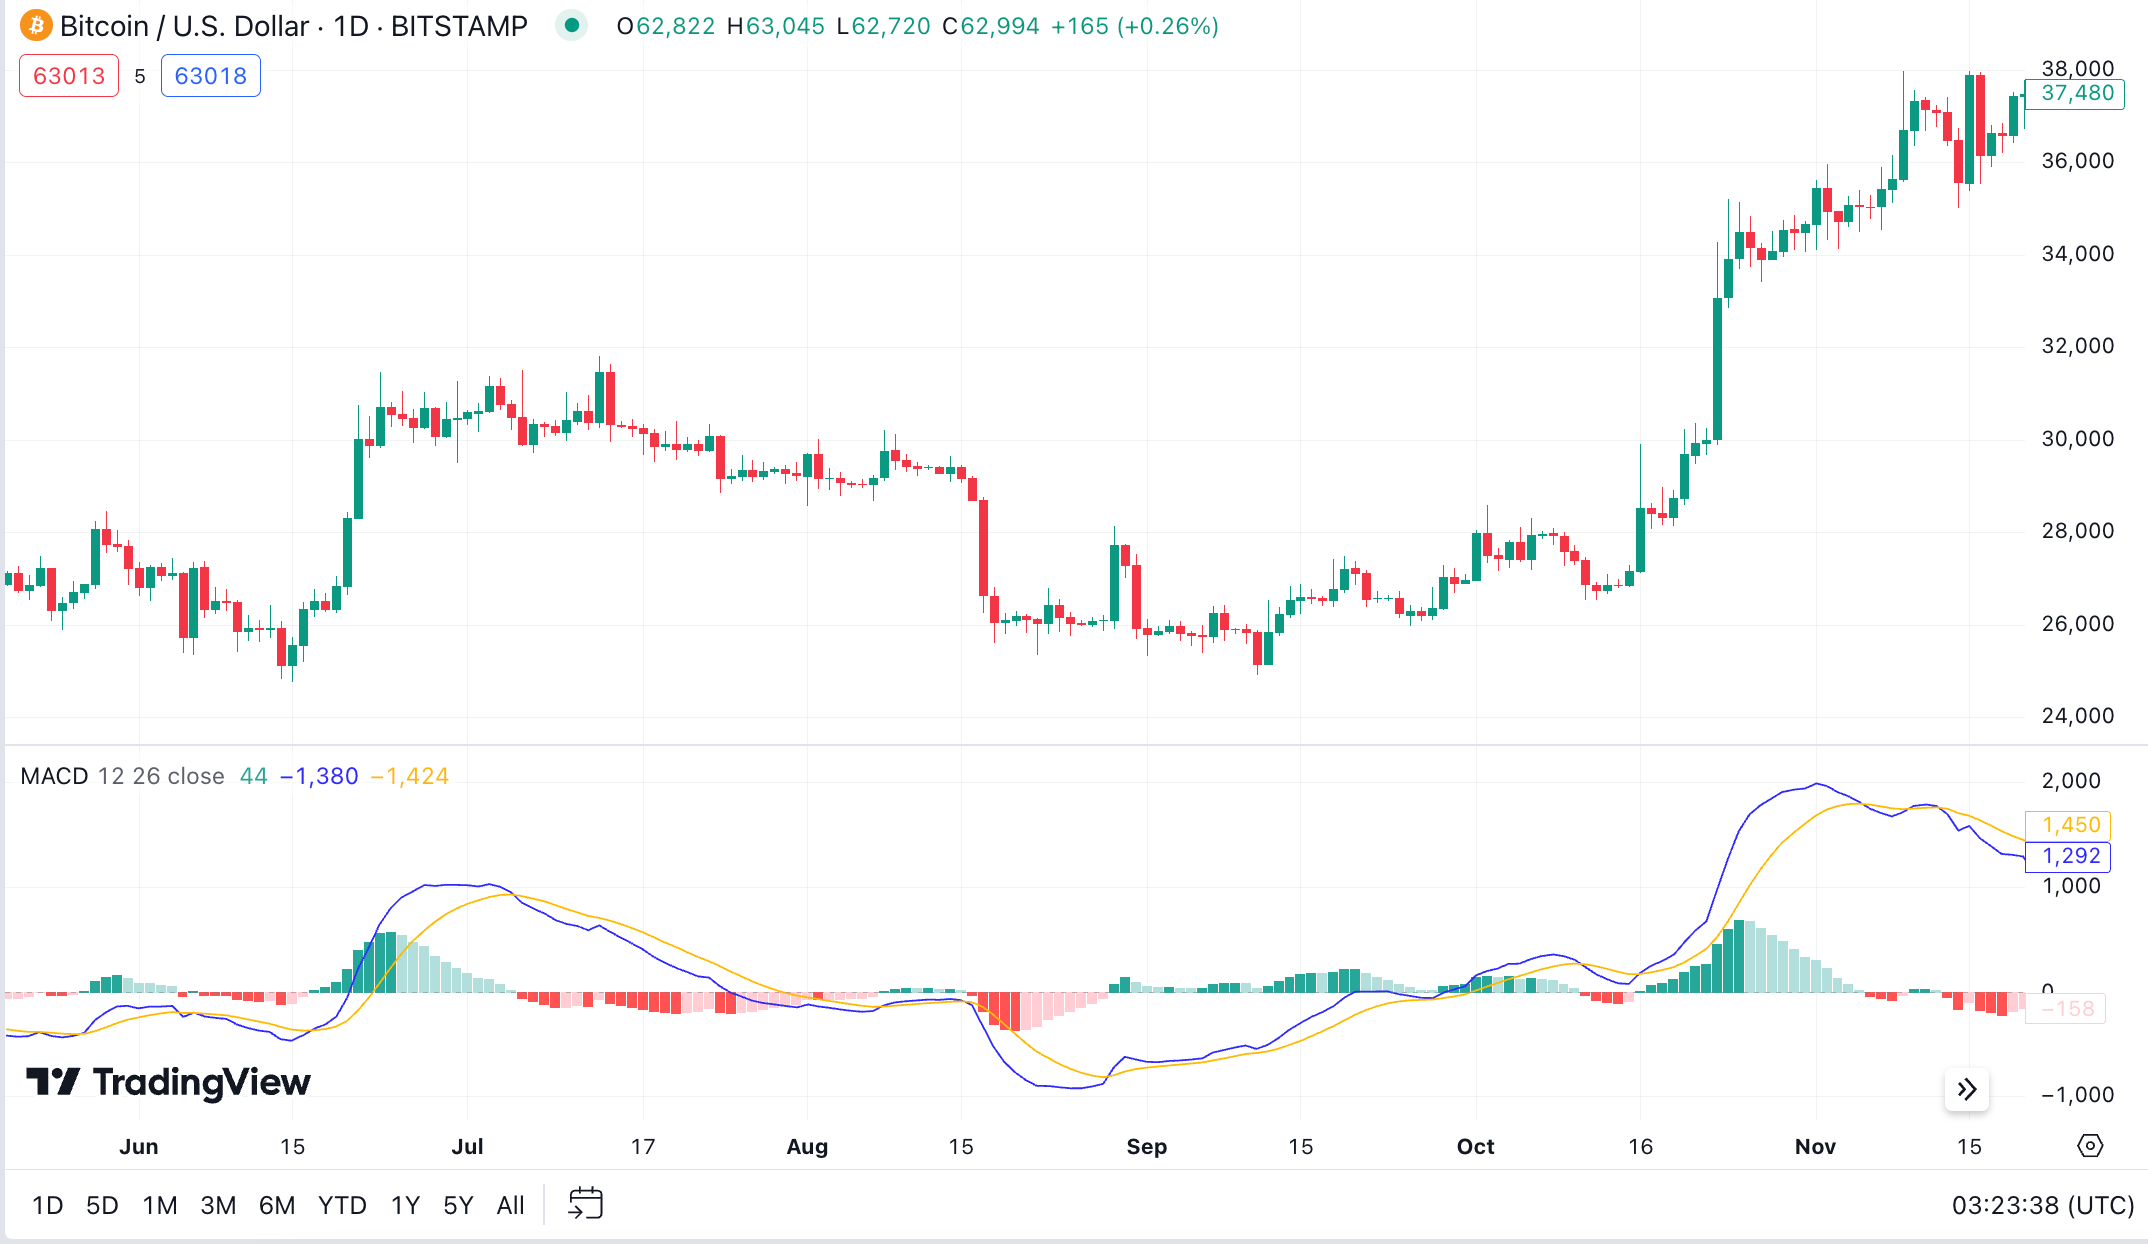
Yet despite the similar calculation method, the MACD focuses more on current data rather than daily chart readings. This makes it rather usable for surgical targeting when searching for potential trend directions.
Conclusion
The TTM Squeeze indicator is a great tool for traders seeking to capitalise from the occurring stock price trends on the market.
This technical analysis tool works well on a tight trading range, as well as in situations when the market is uncertain. Ability to combine this indicator with other tools adds even more value.
Either your new to trading or have a wealth of experience on the Cryptocurrency or Forex markets, the TTM Squeeze indicator can be a fine tune for any strategy you want to deploy.
The content provided here is for informational purposes only. It is not intended as personal investment advice and does not constitute a solicitation or invitation to engage in any financial transactions, investments, or related activities. Past performance is not a reliable indicator of future results.
The financial products offered by the Company are complex and come with a high risk of losing money rapidly due to leverage. These products may not be suitable for all investors. Before engaging, you should consider whether you understand how these leveraged products work and whether you can afford the high risk of losing your money.
The Company does not accept clients from the Restricted Jurisdictions as indicated in our website/ T&C. Some services or products may not be available in your jurisdiction.
The applicable legal entity and its respective products and services depend on the client’s country of residence and the entity with which the client has established a contractual relationship during registration.

