Bitcoin is currently trading just below a key resistance zone, with bulls showing some momentum as they attempt to break through. While price has not yet confirmed a move beyond this level, activity around this area remains worth watching. Before diving into the lower timeframes, let’s zoom out and take a look at the long-term trend.
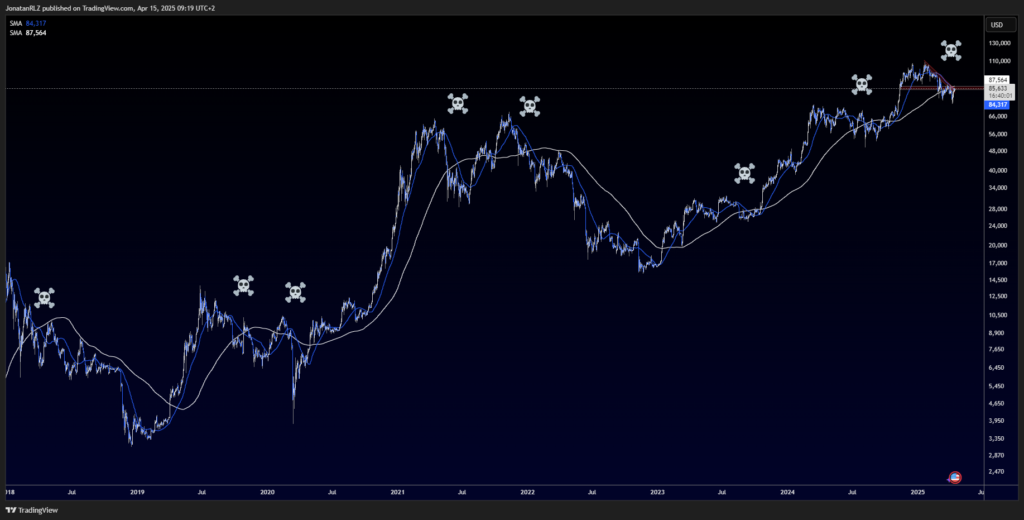
On the daily chart, covering price action from 2018 to today, Bitcoin has recently printed a death cross, where the 50-day Simple Moving Average has crossed below the 200-day. This is similar to what we observed on the S&P 500 and is generally considered a potential signal of shifting momentum.
However, Bitcoin’s history shows that death crosses occur more frequently compared to traditional markets, and they tend to be less consistent as trend indicators. This may be due to the asset’s highly volatile nature and shorter market cycles.
Still, the appearance of a death cross on Bitcoin is not without meaning—it can act as a technical signal for caution or potential change in tone, especially when combined with other structural clues.
This also serves as a good reminder that technical analysis is not one-size-fits-all. In Bitcoin’s case, traders may want to consider longer moving averages or alternate trend tools to help filter out noise and better align with the asset’s unique volatility.
With resistance still intact and broader structure developing, the coming sessions may offer further clarity on how this signal fits into Bitcoin’s current trend.

Mid -Term Outlook
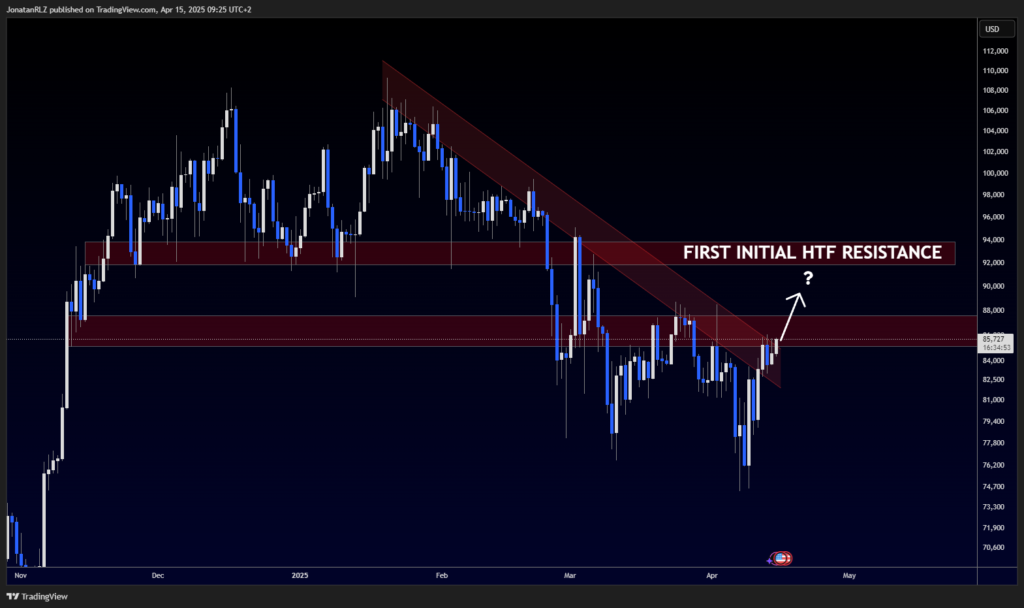
On the shorter timeframes, Bitcoin appears to be breaking out of the descending trendline channel that’s been in place over the past few days. While this development may suggest a potential shift in momentum, price is still facing strong overhead resistance between $85,000 and $88,000.
This zone remains a key barrier, and until it is cleared with sustained price action, the broader trend remains technically unresolved. If Bitcoin does manage to break above this resistance area, the next major high timeframe level sits around $93,000—a zone that could attract interest from breakout traders and short-term profit-taking.
These are the key levels to monitor today, especially if momentum continues to build. As always, staying reactive to structure and price behavior is essential.
Thanks for reading, and be sure to check back tomorrow for more updates on price developments across the major markets.

The content provided here is for informational purposes only. It is not intended as personal investment advice and does not constitute a solicitation or invitation to engage in any financial transactions, investments, or related activities. Past performance is not a reliable indicator of future results.
The financial products offered by the Company are complex and come with a high risk of losing money rapidly due to leverage. These products may not be suitable for all investors. Before engaging, you should consider whether you understand how these leveraged products work and whether you can afford the high risk of losing your money.
The Company does not accept clients from the Restricted Jurisdictions as indicated in our website/ T&C. Some services or products may not be available in your jurisdiction.
The applicable legal entity and its respective products and services depend on the client’s country of residence and the entity with which the client has established a contractual relationship during registration.


