Welcome to today’s daily technical update on Bitcoin.
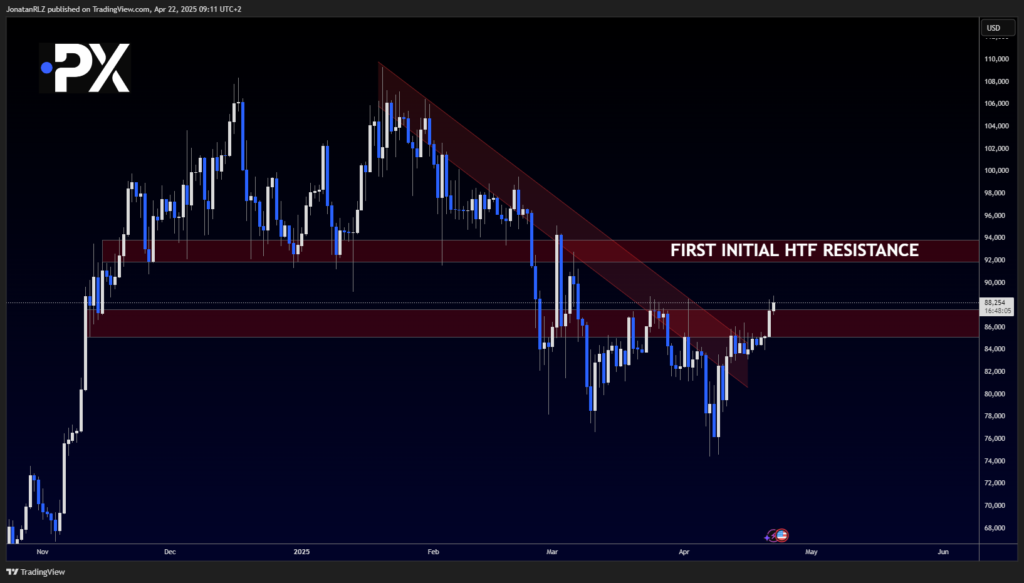
Bitcoin is showing notable strength today, especially when compared to the recent downside action in the S&P 500. While equities are retracing, Bitcoin is pressing up against a key resistance zone, with the range highs marked around $87,640 now being tested.
When confirming a breakout, different traders have different approaches. One commonly used method is to look at the timing of candle closes.
- For some, a daily candle closing above the level is sufficient to confirm a breakout.
- extra confirmation comes when adaily candle both opens and closes above the level.
In this case, that kind of confirmation could come as early as Wednesday’s daily candle close, which may provide a clearer signal that the resistance has been decisively broken.
If the breakout is confirmed, the next high timeframe resistance zone, starting around $92,000, would become the primary area to watch.
Let’s now zoom into the lower timeframes to assess whether this move has the intraday momentum to back it up—or if price is still in the process of building structure.

Intraday View – Bitcoin (4H Chart)
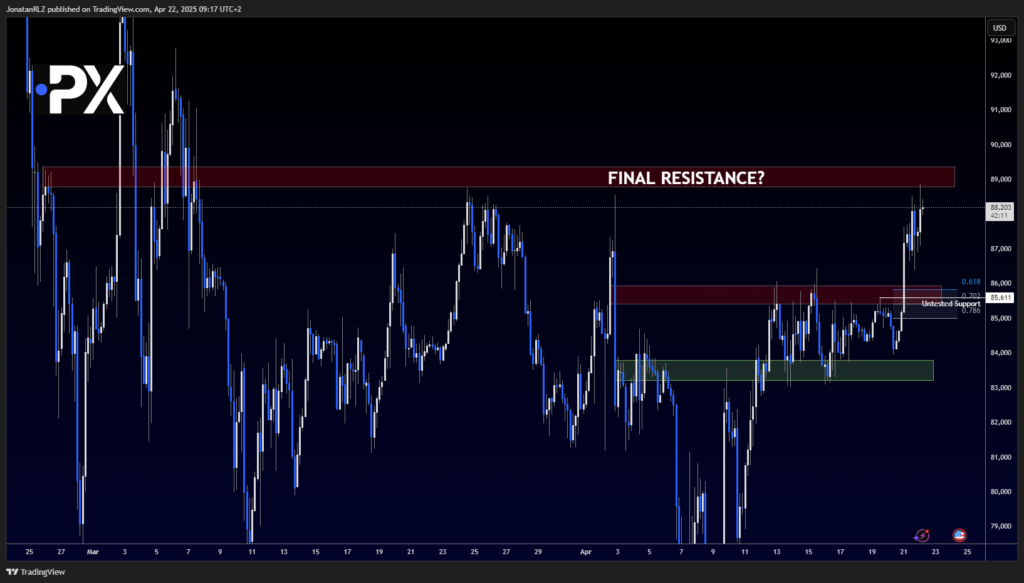
Zooming in on the 4-hour timeframe, we can see that the range structure outlined in last week’s updates served as a well-defined boundary for price action. On Monday, price broke above the range highs, and Bitcoin is now testing the $89,000 region—a zone we’ve marked as a critical resistance area that could potentially trigger a confirmed high timeframe breakout if cleared.
It’s worth noting that just below current price, there is an untested support level around $85,600. This level aligns well with the Reload Zone (RLZ)—the area between the 0.618 and 0.786 Fibonacci retracement levels, which often acts as a support zone in strong trending environments.
If Bitcoin fails to push through the $89,000 resistance, a retest of the $85,600 breakout level could be a likely scenario. This would give the market a chance to test former resistance as support—often a key characteristic in healthy breakout structures.
For now, the two most important levels to monitor for intraday and short-term swing traders are:
- Resistance: $89,000
- Support: $85,600 (confluent with RLZ and previous breakout zone)/li>
How price behaves between these levels throughout the week could offer important clues about whether this breakout attempt will be sustained or if a retracement is on the horizon.

The content provided here is for informational purposes only. It is not intended as personal investment advice and does not constitute a solicitation or invitation to engage in any financial transactions, investments, or related activities. Past performance is not a reliable indicator of future results.
The financial products offered by the Company are complex and come with a high risk of losing money rapidly due to leverage. These products may not be suitable for all investors. Before engaging, you should consider whether you understand how these leveraged products work and whether you can afford the high risk of losing your money.
The Company does not accept clients from the Restricted Jurisdictions as indicated in our website/ T&C. Some services or products may not be available in your jurisdiction.
The applicable legal entity and its respective products and services depend on the client’s country of residence and the entity with which the client has established a contractual relationship during registration.


