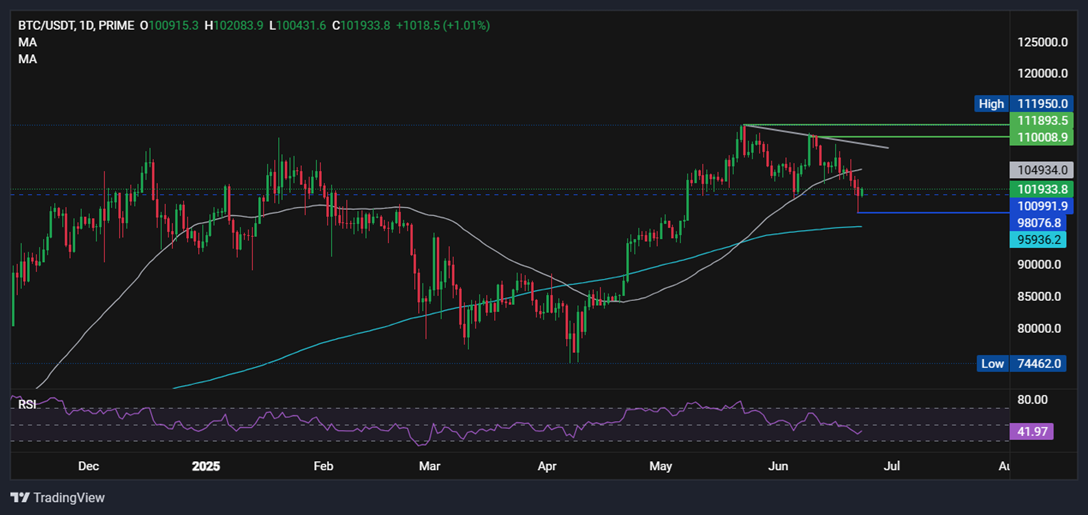
Bitcoin fell 3.2% last week and is flat at the start of the new week despite briefly dropping below the key 100,000 level as risk sentiment soured over the weekend. Bitcoin started the previous week at 105K and traded in a relatively tight range before dropping sharply at the end of the week and extending those losses over the weekend as geopolitical tensions ramped up. The price is at 102k as the new week begins.
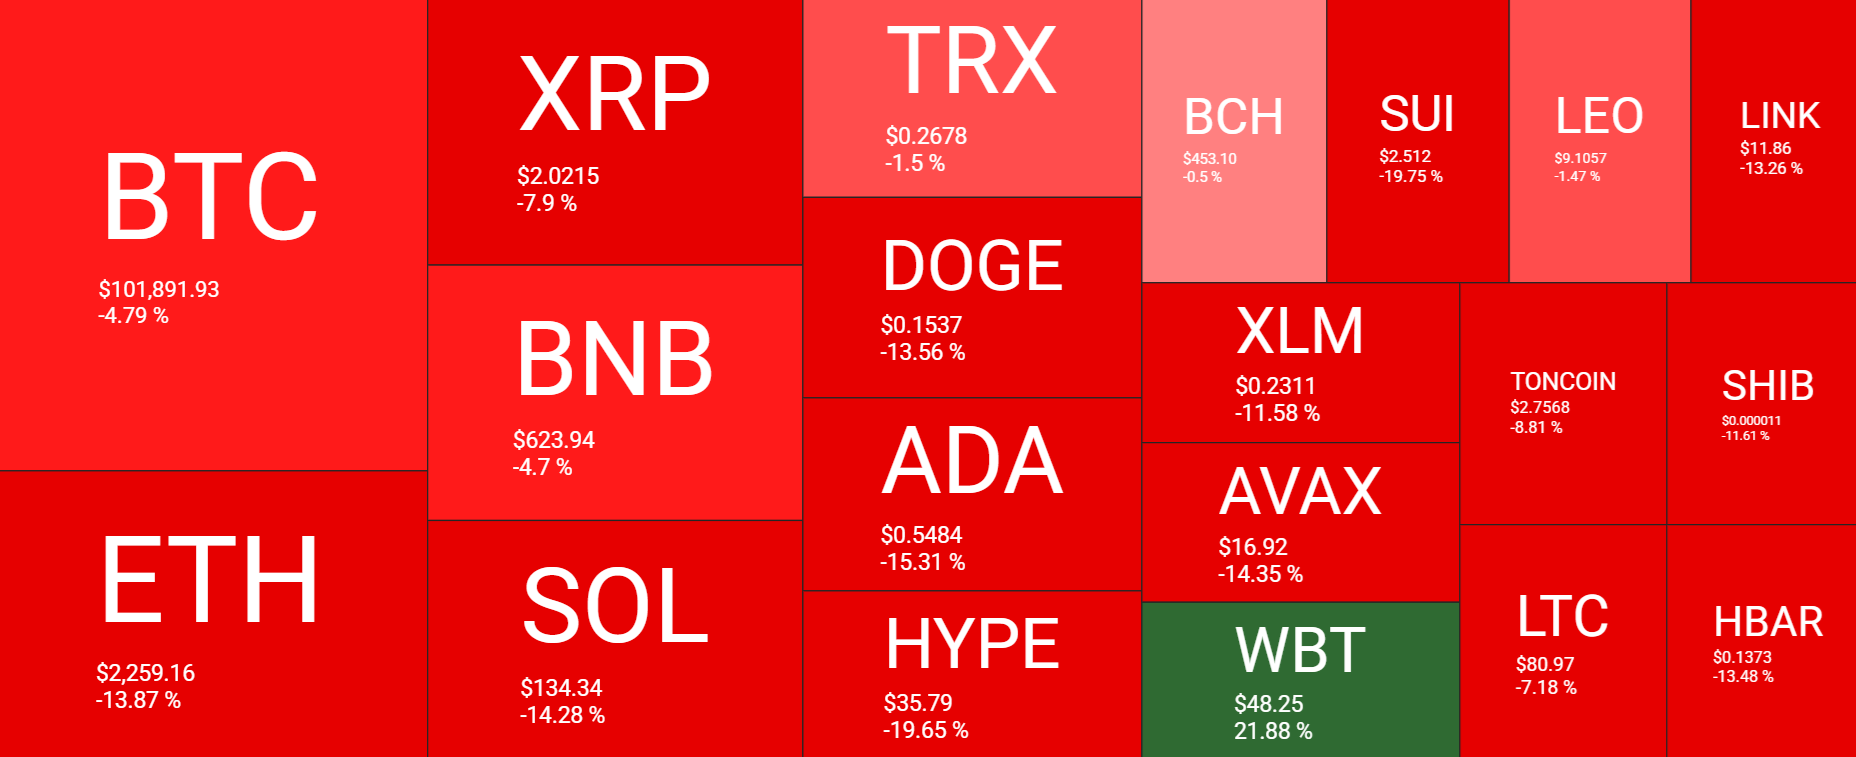
The chart shows a sea of red for the past seven days. Bitcoin has dropped 4.8%, Ethereum and Solana are down around 14%, and XRP tumbled 7.9%. Smaller coins such as ADA, AVAX, and DOGE have fallen between 13% and 15%.
The cryptocurrency market capitalization has fallen sharply, from a peak of $3.39 trillion last Monday to current levels of $3.12 trillion, recovering from a weekend low of $3.03 trillion, a level last seen in early May. The Fear and Greed index has fallen to 37 in Fear, dropping from 50 in neutral last week, and 73 in Greed last month.
The sharp drop in Bitcoin and crypto prices recently sparked a wave of liquidations. Since Friday, the crypto market has experienced over $1.38 billion in long position liquidations as speculative leveraged positions got flushed out.

Bitcoin ETFs highlight structural demand
While investors moved into risk-off mode, structural demand for BTC remained resilient. Bitcoin ETFs recorded nine straight days of net inflows as the typically strong correlation between BTC and BTC ETFs wavered. This appeared to be a sign of dip buying by longer-term investors.

Across the week, BTC ETFs posted inflows of $1.02 billion, marking the second straight week of net inflows. June has seen net inflows of $2.29 billion so far, putting it on track for a third straight month of inflows. BTC ETF demand will be watched closely over the coming days as risk sentiment is tested. Persistent institutional demand could help to support the BTC price; however, signs of institutional demand weakening as sentiment wavers could pull BTC lower.
Corporate demand
Corporate demand for Bitcoin has also remained robust throughout the week. Last Monday, Japanese investment firm Meta Planet announced that it had purchased an additional 1112 BTC, taking its total holding to 10,000 BTC. That same day, Strategy, formerly MicroStrategy, announced it had added a further 10,100 BTC for $1.05 million, at an average cost of $104.080 per BTC.
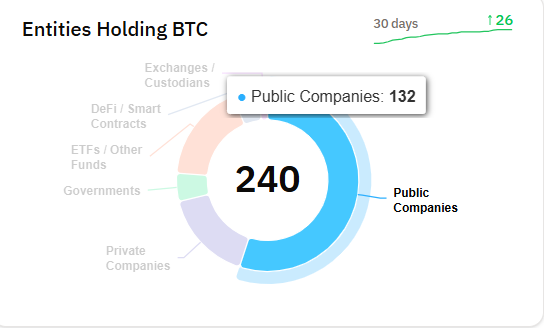
More and more companies across the globe are on a Bitcoin buying spree, often in industries that have nothing to do with cryptocurrency. They are mimicking the stockpiling strategy that has produced explosive share price growth. According to Bitcoin Treasuries.net, there are 132 public companies holding around 3.2% of all BTC that will ever exist. Ongoing corporate purchases will continue supporting the BTC price while adding legitimacy.
Geopolitical tension fuels risk-off trade
Political tensions have ramped up considerably in the Middle East after the US bombed Iran’s main nuclear sites over the weekend, escalating the situation. Iran says all options are open, with the Strait of Hormuz in focus. The Strait of Hormuz is a key chokepoint through which around 20% of global oil and gas demand flows. The Iranian parliament has approved the closure of the Strait; the Supreme National Council has the final say. Oil prices remain elevated as the market awaits Iran’s response.
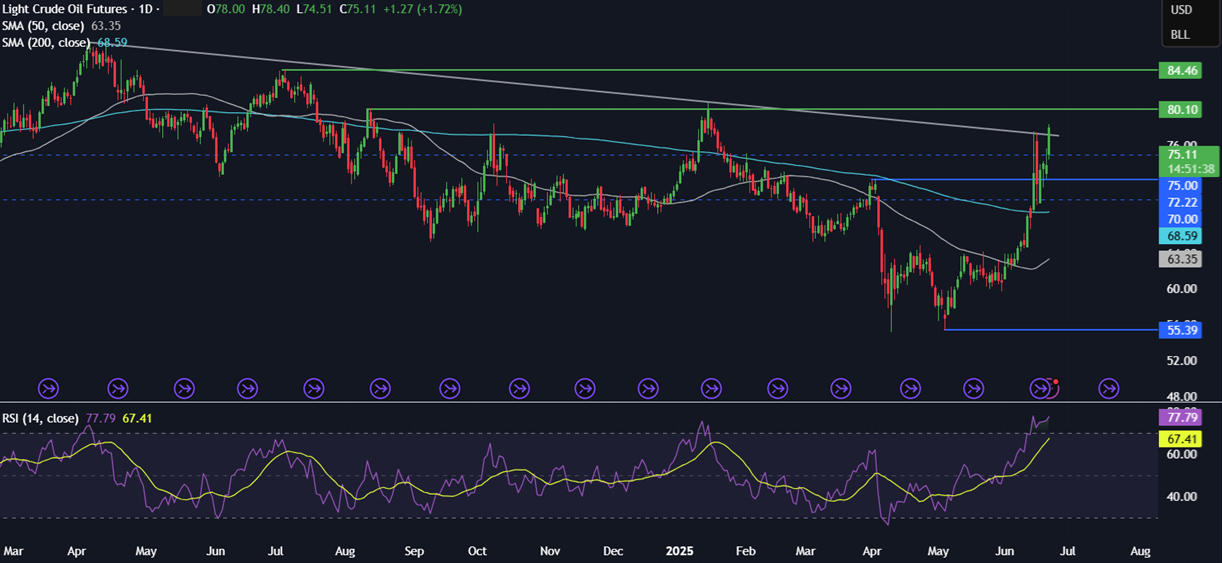
Why does this matter for Bitcoin? While the war in the Middle East does not directly impact Bitcoin, it is affected by risk sentiment in the short term and also by the prospect of central banks keeping interest rates higher for longer if inflationary pressures are revived. Rising oil prices are inflationary.
Last week, the Federal Reserve left interest rates unchanged at 4.25 to 4.5% but warned of a meaningful increase in inflation owing to Trump’s trade tariffs. Should oil prices remain high, this would only add to inflationary expectations.
On-chain analysis signals a softening
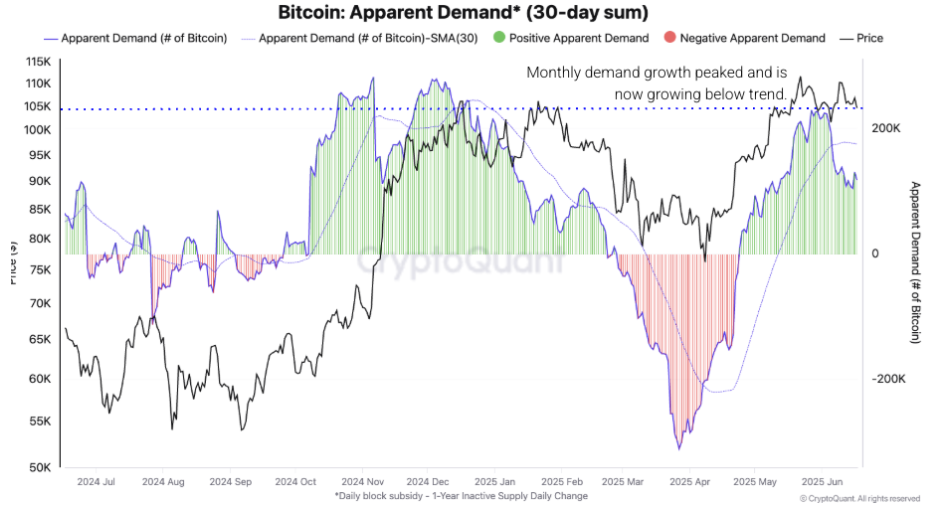
Amid rising uncertainty, on-chain data also shows early signs of weakness. According to CryptoQuant, the Bitcoin Apparent Demand chart growth is 118,000 in the last 30 days, down from 128,000 reached on May 27. Of note, demand has fallen below the 30-day moving average, suggesting a softening in demand.
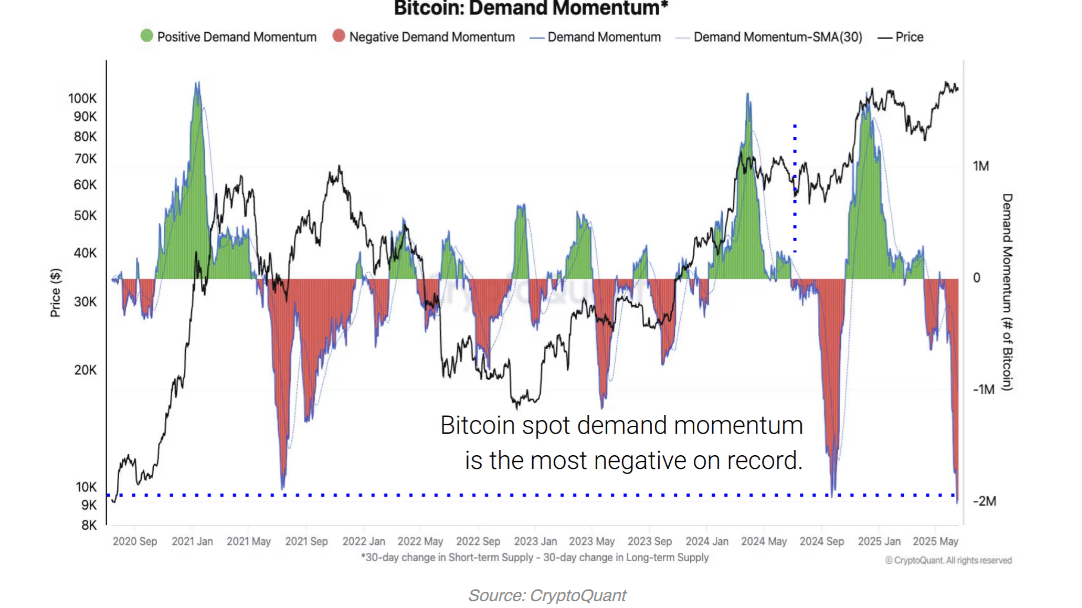
Crypto Quant data also shows that demand for new participants entering the Bitcoin market is weakening, and demand momentum has turned negative, which supports a bearish outlook. Short-term holders now account for 4.5 million BTC, a drop of 0.8 million from the 5.3 million of BTC controlled by this cohort at the end of May.
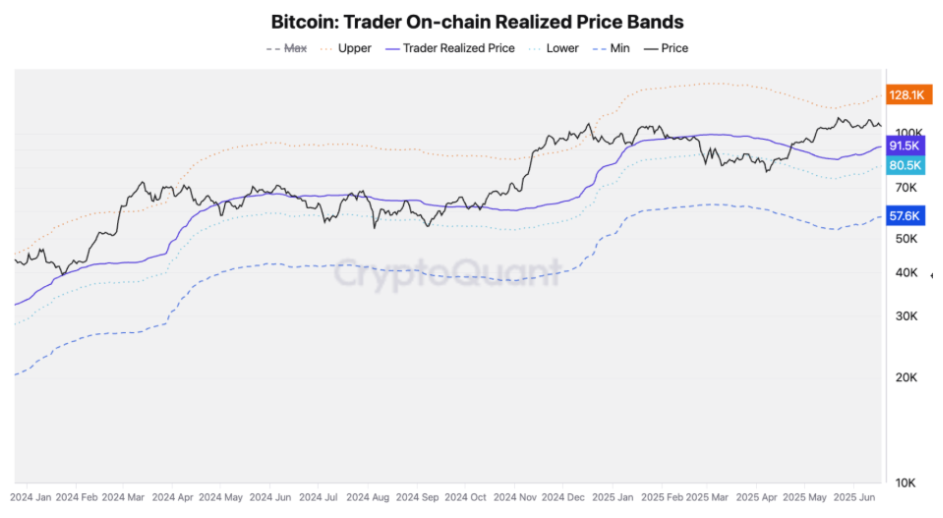
According to Bitcoin Trader’s Behaviour Dominance, investors sold out at $110k last week and opened new short positions below 105k as tensions in the Middle East ramped up. If demand continues to decline, the on-chain realized price is 92k, which often supports a bull market. Below here, 84k is the lower band of the on-chain realised price.
Sidelined capital ready to rotate back in?
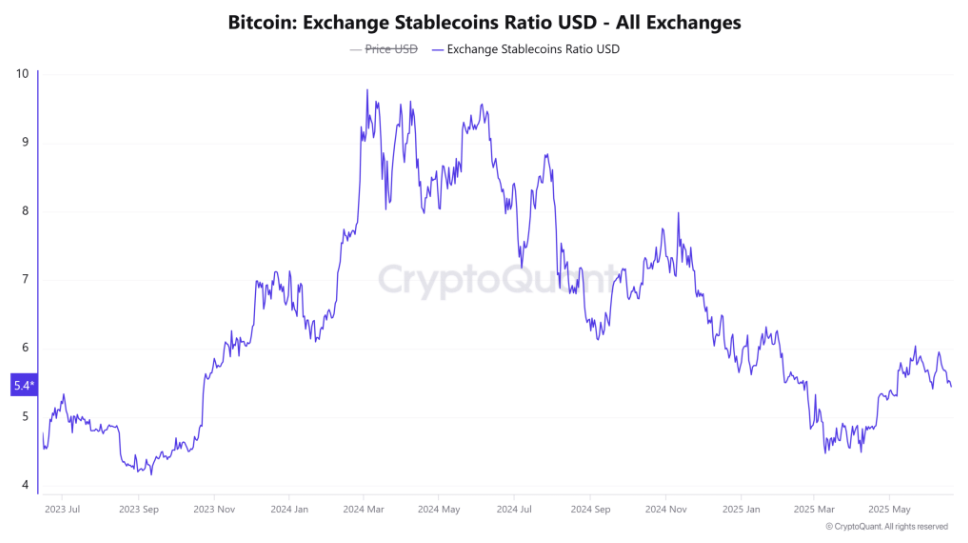
The Exchange Stablecoin Ratio is 5.45, down over 1%, which means that stablecoins now make up a higher share of exchange assets. A falling ratio often shows stronger potential buying power, as more funds are set aside in reserve and ready to be deployed. In other words, liquidity hasn’t left the market; it’s just on standby for now. If sentiment stabilizes, that capital could rotate rapidly into BTC positions.
Bitcoin closed below its 50 SMA
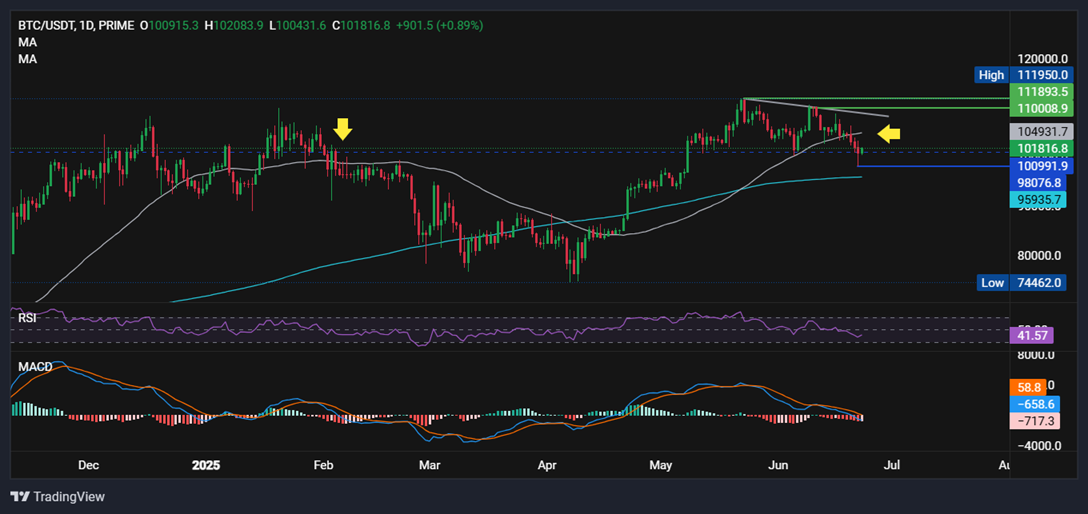
Looking at the technical picture, BTC has closed below its 50-day moving average on the daily trading chart. The last time this happened was four months ago when Bitcoin then tumbled to 74k. The 50 SMA is a technical and lagging indicator; therefore, it helps identify the prevailing market trend. A move below the 50 SMA typically signals bearish momentum. The RSI has also moved below 50, suggesting bearish momentum, and the MACD adds to bearish evidence. However, the 100k level is acting as a convincing support for now. Sellers will need a close below the 100k level for bears to extend the downtrend.
Longer-term support
1. M2 Money supply
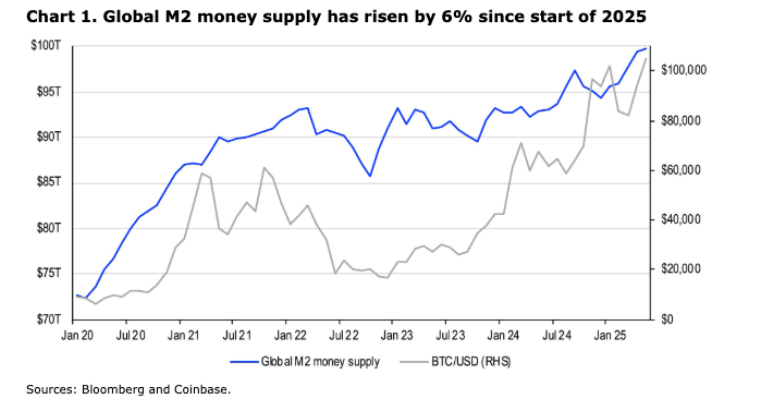
Despite near-term risks, the longer-term outlook remains bullish, as the M2 money supply is expanding despite the Fed’s quantitative tightening. The money supply is up 6% since the start of the year to $99.8 trillion, partly due to the ECB cutting rates by 100 basis points and Japan’s significant fiscal stimulus. The expansion in the M2 money supply is often well aligned with the rally in Bitcoin.
2. Stablecoin scores a regulatory win
The most significant regulatory development was the US Senate’s 68- 30 vote on the landmark Guiding and Establishing National Innovation for US Stablecoin (GENIUS) Act. The bill is the first regulatory framework for fully reserved, anti-money laundering-compliant stablecoins. It now needs to pass the House of Representatives before becoming law.
It comes as stablecoin usage reaches a record high. Total supply has grown 22.5% since 2024 to exceed $250 billion, while on-chain transfer volumes have surged above $20 billion.
Trading involves risk.
The content provided here is for informational purposes only. It is not intended as personal investment advice and does not constitute a solicitation or invitation to engage in any financial transactions, investments, or related activities. Past performance is not a reliable indicator of future results.
The financial products offered by the Company are complex and come with a high risk of losing money rapidly due to leverage. These products may not be suitable for all investors. Before engaging, you should consider whether you understand how these leveraged products work and whether you can afford the high risk of losing your money.
The Company does not accept clients from the Restricted Jurisdictions as indicated in our website/ T&C. Some services or products may not be available in your jurisdiction.
The applicable legal entity and its respective products and services depend on the client’s country of residence and the entity with which the client has established a contractual relationship during registration.


