Bitcoin booked modest gains of 0.9% across last week, despite a choppy week which saw the price rise to a new record high of 124.4k before falling to 118k. BTC price has slipped below 116k at the start of the new week amid signs of caution ahead of the Fed’s Jackson Hole Symposium.
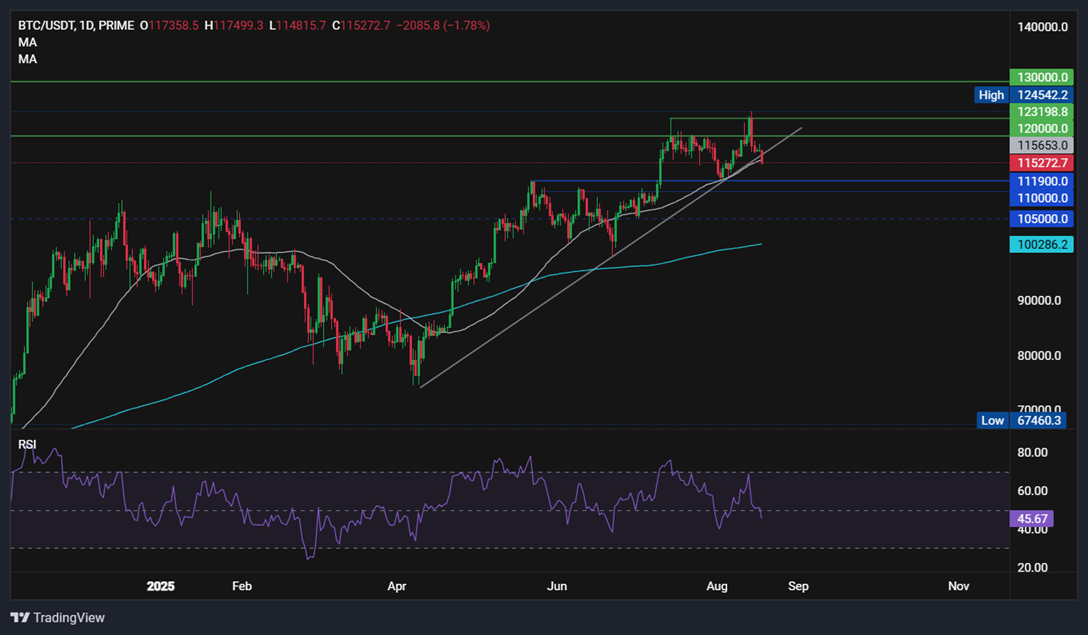
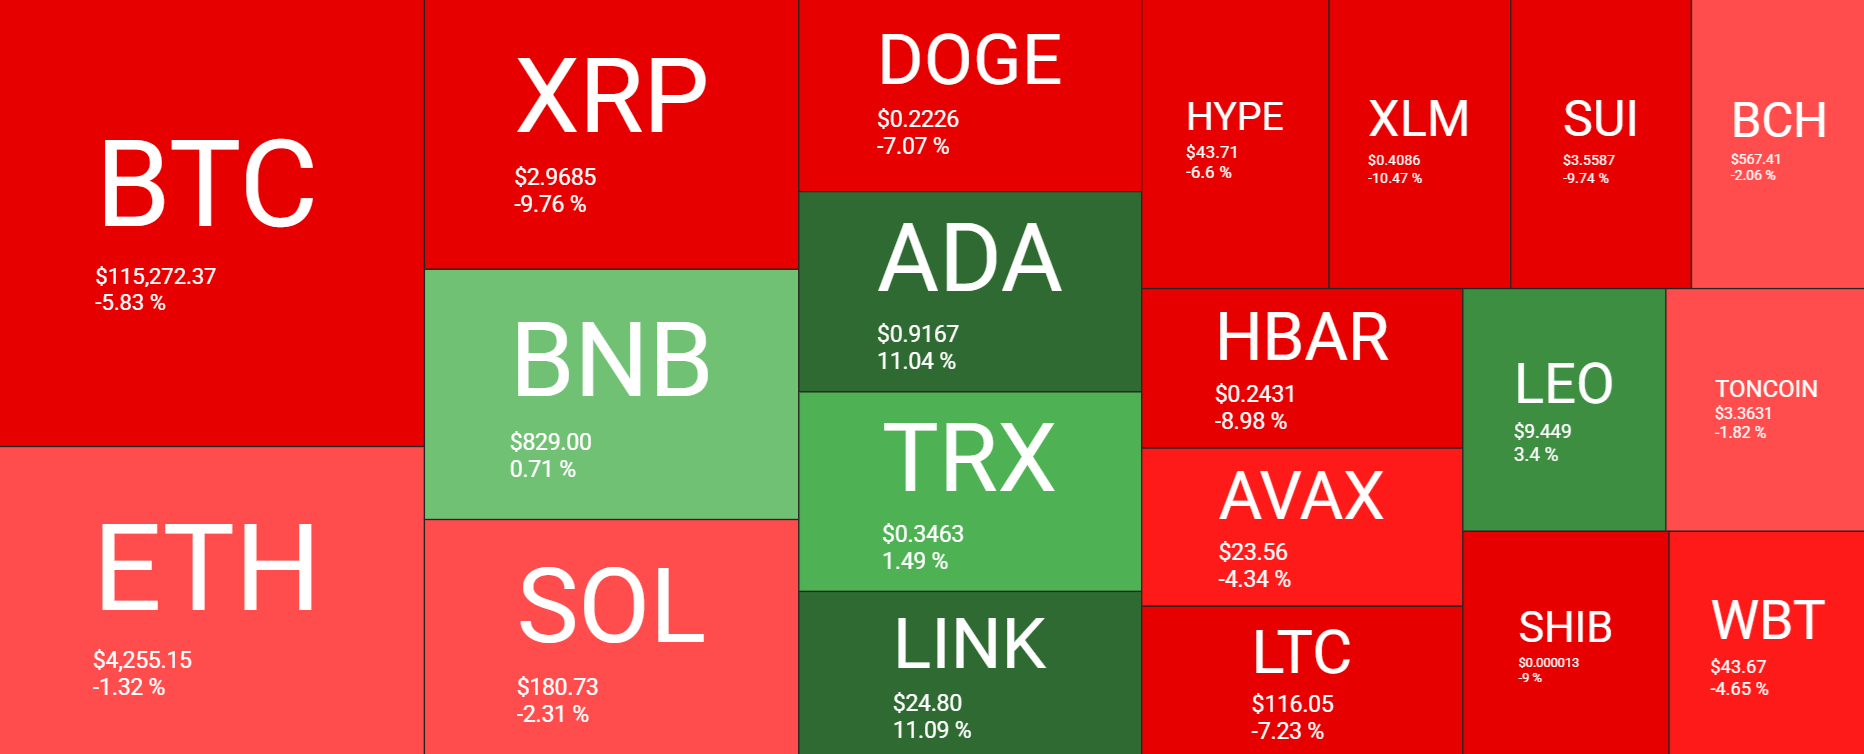
Given Monday’s sell-off, the picture for BTC over the past 7 days is weaker, with the largest cryptocurrency down 5%. The price now trades over 7% from its record high. Ethereum has fallen 1.3% dropping away from its 4-year high. Other large altcoins are also under pressure, with XRP falling 9% and SOL falling 2.3%. However, there are still some net gainers, including ADA, BNB and TRX.
The cryptocurrency market cap rose to a record $4.2 trillion on Tuesday as Bitcoin reached a record high, before slumping to $3.88 trillion at the time of writing, a 10-day low.
Meanwhile, the fear and greed index is 56, in Neutral, down from 62 last week and falling from the Greed stage, suggesting a near-term lack of direction.
Macro backdrop
During the first half of last week, BTC broadly trended higher as risk appetite was boosted by US CPI data on Tuesday. Data showed that inflation came in slightly softer than expected at 2.7% YoY, strengthening the case for a September rate cut from the Fed. Following the data, U.S. Treasury Secretary Scott Bessent also said the Fed should cut by 20 basis points next month, fueling larger rate cut expectations.

However, the optimism quickly waned after hotter-than-expected US Producer Price Index data, which showed that inflation is accelerating at the factory gate level, rising 3.2% YoY. PPI is expected to feed through to higher CPI data. The figures triggered a wave of selling with the market quickly ruling out the possibility of a 50 basis point rate cut.

It’s worth noting that components of the PPI that feed into the Personal Consumption Expenditure PCE price index, the Fed’s preferred measure for inflation, remained relatively subdued. As a result, the Fed is still expected to cut in September, and we believe it will likely cut again before the end of the year.
The next catalyst: Jackson Hole Symposium
This week’s Fed Jackson Hole Symposium could provide further insight into the Fed’s path for rates. Fed Powell will address the economic outlook and the Fed’s policy framework. With the markets pricing in an 85% probability of a rate cut in September, anything less than a dovish stance from Powell could unnerve the markets. Signs of those nerves are weighing on risk assets such as crypto at the start of the week, while safe-haven gold is recovering higher. A dovish tone from Powell could be the next catalyst to propel crypto higher.
Institutional and corporate BTC demand remains strong
Despite some caution over the rate outlook, institutional and corporate demand continued to strengthen, which helped to push Bitcoin to record highs. These flows will likely offer a floor to the selloff
Listed companies such as Strategy, Metaplanet, and Smarter Web Company, among others, have added more BTC to their treasury, highlighting growing adoption, legitimacy, and confidence in crypto.
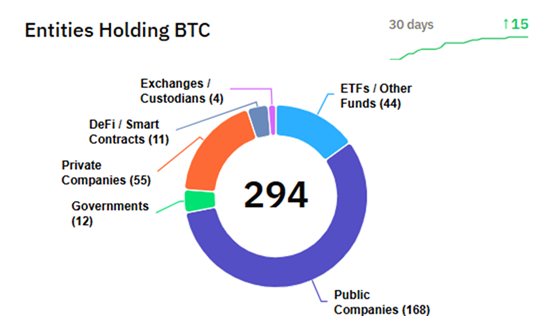
According to Bitcointreasuries.com, 294 entities, including companies and governments, now hold a total of 3.67 million BTC. Looking at the breakdown, public companies have 57%, private companies 18% and most governments and other entities hold 4.2%.
Institutional demand continued to ramp up. According to SoSoValue data, Bitcoin ETF saw net inflows of $547.8 million last week, slightly above the previous week but still low compared to net inflows in mid-July.

Liquidations
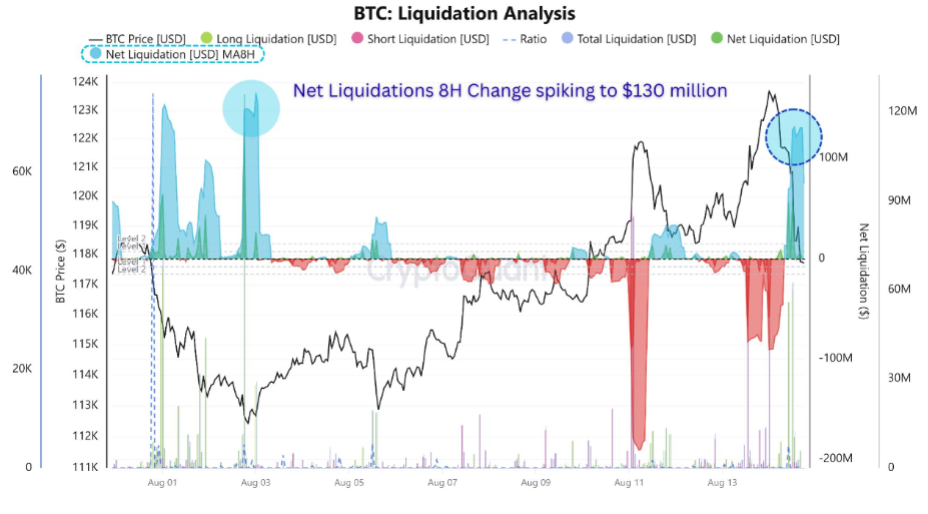
The cryptocurrency market experienced $1 billion in liquidations on Thursday when BTC suddenly crashed under $118k. Liquidations are also rising sharply today.

The liquidation data revealed that the largest round of forced position closures since the start of August impacted late long positions, indicating that traders were excessively bullish. The Nets Liquidations chart below shows a spike up to $130 million, with the pattern pointing to a long squeeze, where falling prices trigger cascading sell orders from overleveraged buyers. The clearing out of overleveraged positions provides a more substantial base to build gains from.
Altcoin liquidation flips BTC liquidation activity
Looking at a broader picture, data from 2025 shows that traders are taking on more risk in altcoins than in Bitcoin, marking a reversal from the trend seen last year. In 2024, Bitcoin dominated liquidations with BTC liquidations far outpacing all altcoins combined. However, since January this year, the tables have turned, and cumulative altcoin liquidations began rising steeply, eroding Bitcoin’s lead.
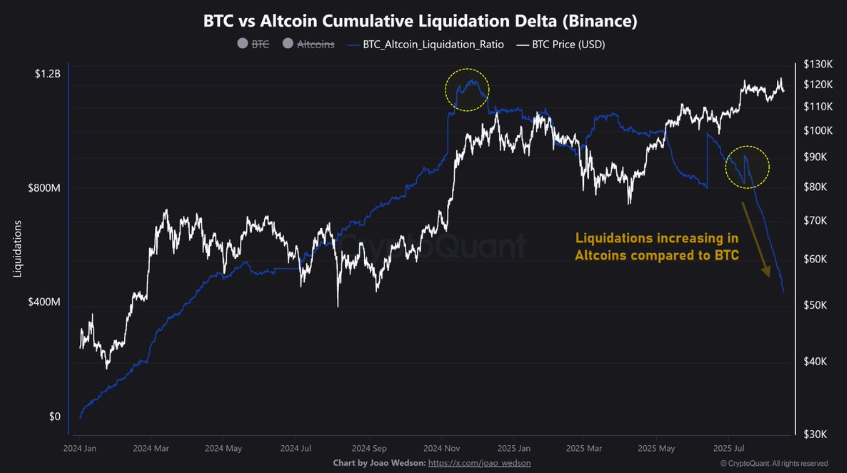
Last month, the balance flipped as altcoins recorded a surge in both long and short liquidations, pushing the BTC versus altcoin cumulative liquidation delta on Binance to new lows. This shows that July marks an inflexion point with altcoin liquidation activity overtaking Bitcoin liquidation activity for the first time.
This could be considered a deeper shift in sentiment with traders speculating more aggressively on altcoins than on Bitcoin, chasing higher volatility and potential upside.
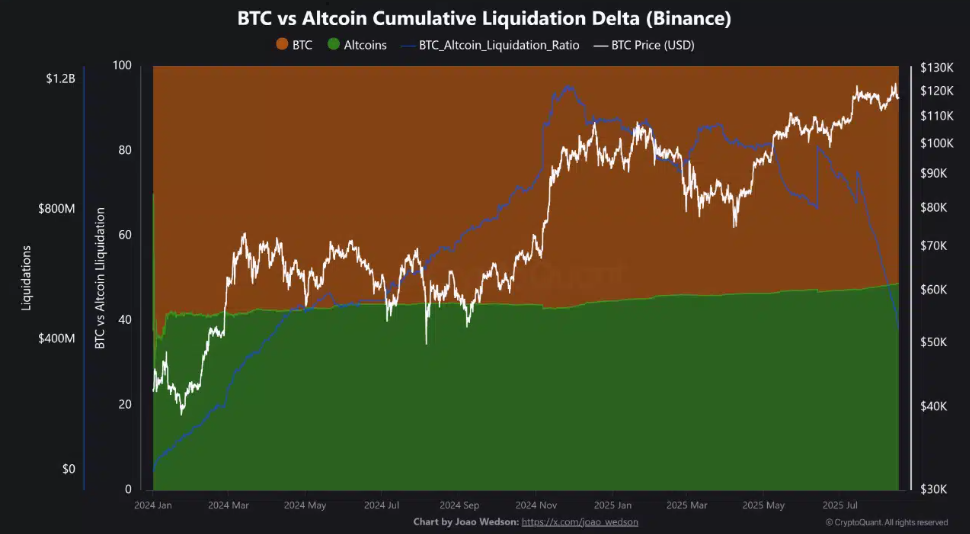
Historically, heightened altcoin liquidation activity coincided with the early stage of the altcoin season, when capital rotates out of Bitcoin into altcoins, leading to explosive rallies. Therefore, this spike in altcoin liquidations could be a signal that the market is entering another speculative rotation phase.
Other signs that the altcoin season is near:
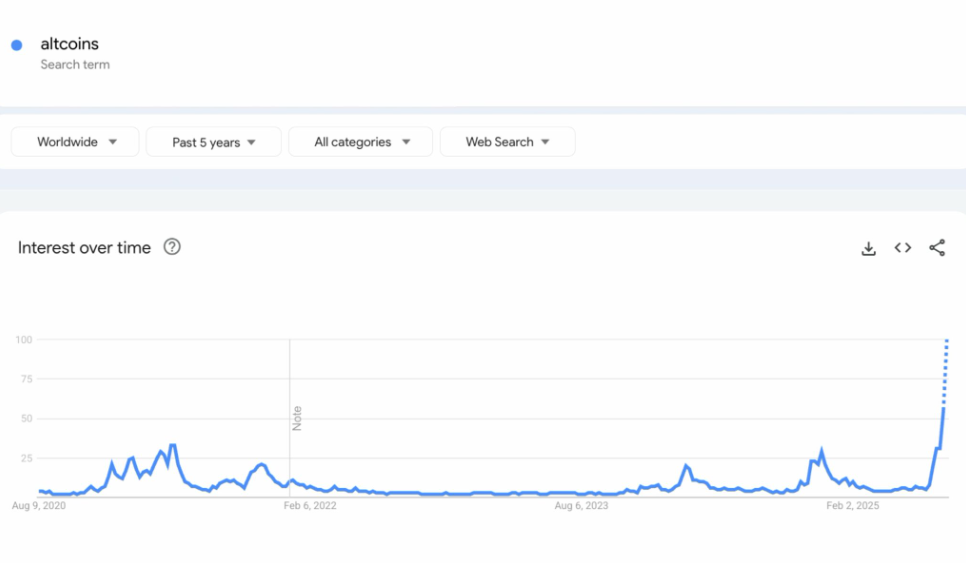
Google “altcoin” search hits 5-year high.
Retail interest appears to be rotating towards altcoins; in fact, Google Trends data showed that searches for “altcoins” hit a five-year high, breaching the 50% mark. The jump in search interest comes after months of subdued activity following peaks in late 2024 and early 2025. This could be a further sign that altcoin season is near.
Capital flows tilt towards altcoins
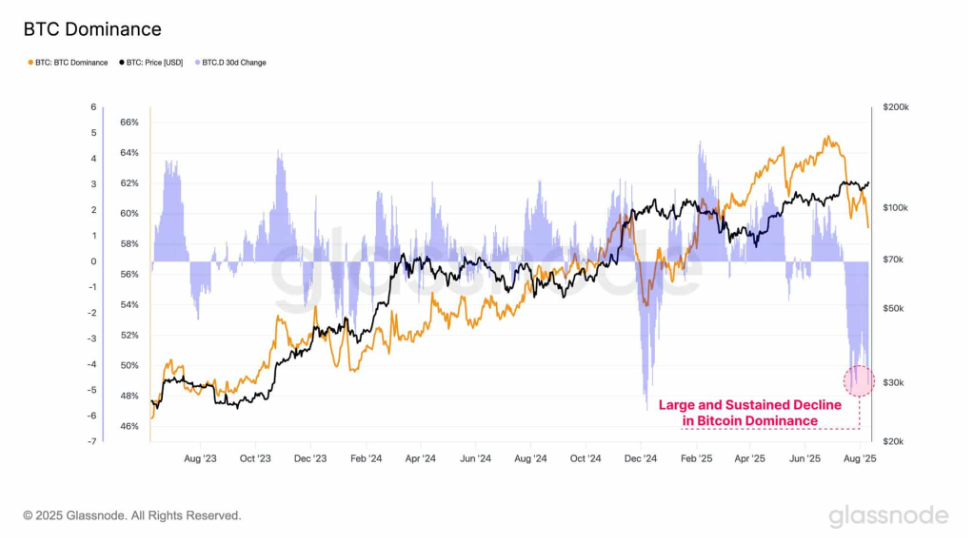
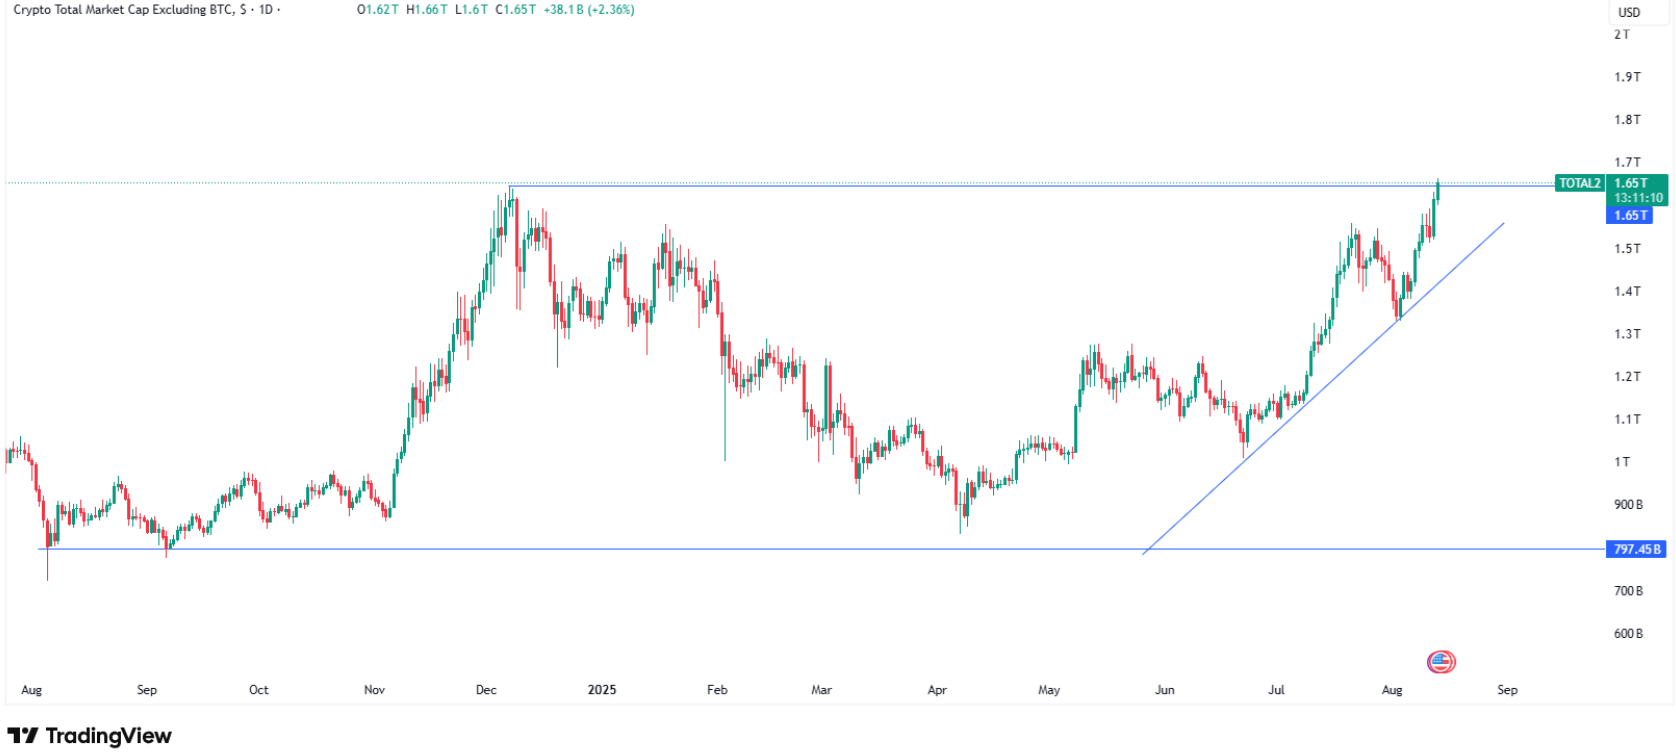
The total altcoin market cap touched a three-month high of $1.67 trillion, still behind Bitcoin’s $2.39 trillion; however, capital rotation appears to be underway. According to data from Glassnode, Bitcoin dominance is below 59% having fallen from 65% in 2 months, even as Bitcoin rallied 15% and hit multiple record highs. This suggests that BTC’s gains are not fully capturing market flows.
The altcoin season index also climbed to 42, up from 29 a month ago, and has surged 270% from 16 just two months ago. The 75 level is often associated with full-on altcoin season.
Will history rhyme?
Historically, altcoin seasons occur in the following year after a Bitcoin halving. Some parallels can be drawn with the altcoin rally seen in 2017 and 2021.
The gains seen last week reinforce the view of capital rotation into altcoins, reflecting an elevated speculative bid and momentum building in high-beta assets. For now, price discovery is still led by BTC, but altcoins are taking the lion’s share of the flows, meaning they could be a stronger play in Q3. Should the altcoin market cap (minus Bitcoin) TOTAL2 break meaningfully above the December high, further gains could be on the cards.
ETH remains a market focus
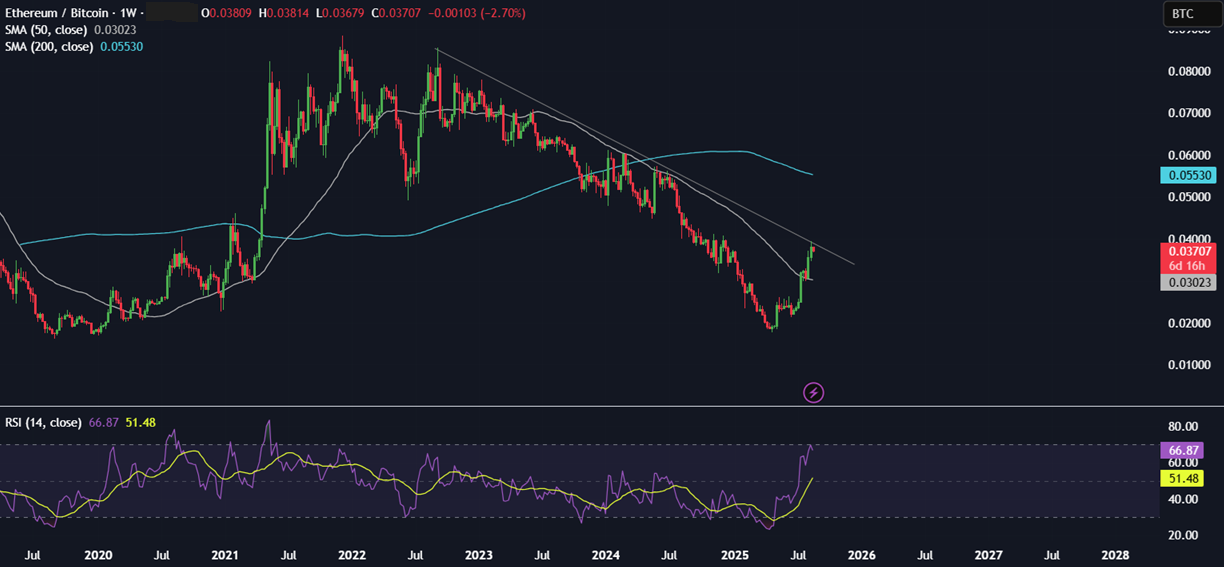
Ethereum’s rally continues to be a key market focus after reaching its highest level since 2021. Furthermore, against peers, the ETH / BTC cross has doubled from the lows reached in April this year, although it remains far from the peak of December 2021. ETH/BTC is testing a key trendline resistance; a break above here could see ETH propelled sharply higher.
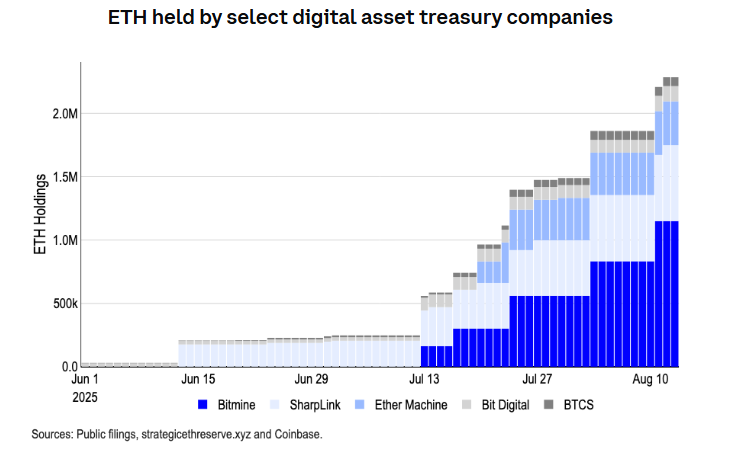
ETH activity is being driven by demand for digital asset treasuries (DATs). Since the start of this month, the major ETH DATs have purchased over 795k ETH worth over $3.6 billion; these new entities are now controlling over 2% of the total ETH supply. Given the difference in ETH vs BTC trading volumes on centralised exchanges, the impact of $3.6 billion of buying flows is significantly higher than for Bitcoin.
Spot ETF EHF inflows have also been significant this week. According to SoSo Value data, ETH ETFs had net inflows of 2.85 billion last week, seeing almost five times the inflows of BTC. ETH ETFs saw a record $1.02 billion in inflows on Monday, followed by a second record high of $729 million on Thursday.

Persistent institutional and corporate demand provide a floor to today’s selloff, which has seen ETH drop to 4275. The selloff is most likely a bout of profit-taking rather than a collapse of conviction.
Trading involves risk.
The content provided here is for informational purposes only. It is not intended as personal investment advice and does not constitute a solicitation or invitation to engage in any financial transactions, investments, or related activities. Past performance is not a reliable indicator of future results.
The financial products offered by the Company are complex and come with a high risk of losing money rapidly due to leverage. These products may not be suitable for all investors. Before engaging, you should consider whether you understand how these leveraged products work and whether you can afford the high risk of losing your money.
The Company does not accept clients from the Restricted Jurisdictions as indicated in our website/ T&C. Some services or products may not be available in your jurisdiction.
The applicable legal entity and its respective products and services depend on the client’s country of residence and the entity with which the client has established a contractual relationship during registration.


