ETHEREUM (ETH/USD):
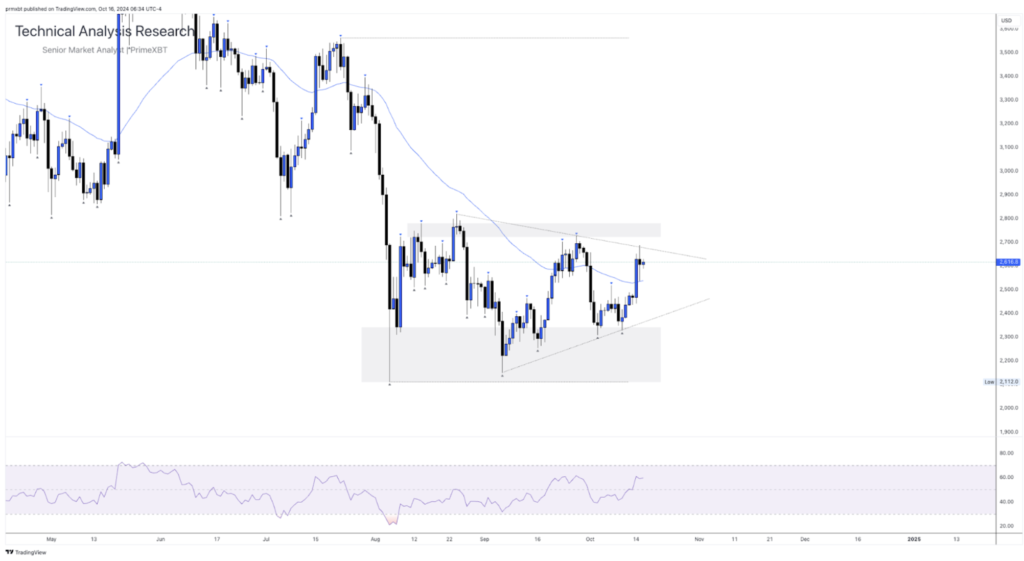
As noted in my previous articles, ETH continues to lag in price action volatility. It is currently trading just above $2,600. A closer look at the technicals reveals the formation of a pennant pattern, with the price currently being rejected by an internal descending trend line.

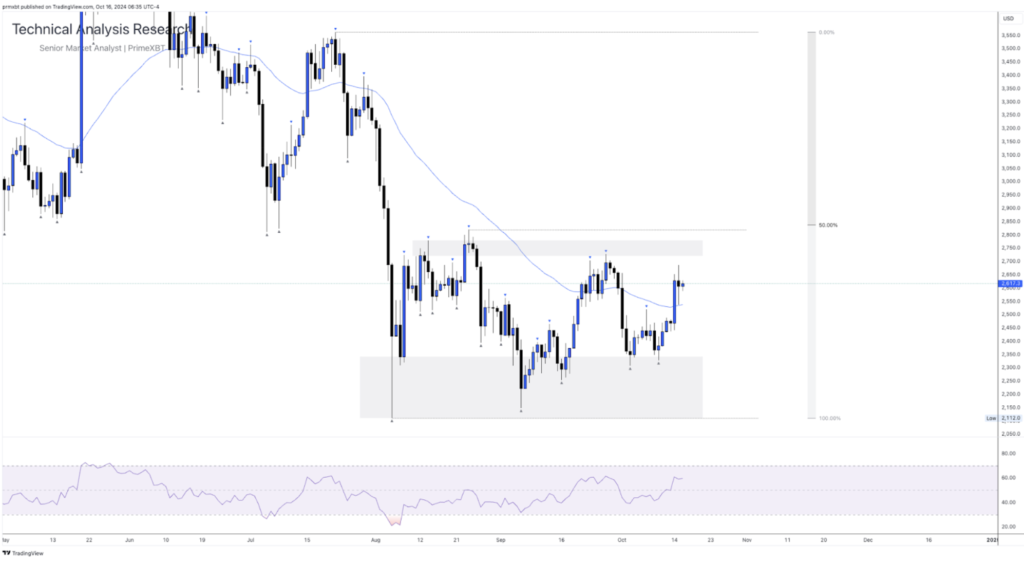
If price continues to move higher, I’ll be watching how it reacts within discounted trading zones, such as the 50% level on the Fibonacci tool, based on the previous bearish leg. There’s also some internal resistance identified between $2,700 and $2,800. At the moment, there are no signs from the RSI indicator suggesting that this move is overbought.

The content provided here is for informational purposes only. It is not intended as personal investment advice and does not constitute a solicitation or invitation to engage in any financial transactions, investments, or related activities. Past performance is not a reliable indicator of future results.
The financial products offered by the Company are complex and come with a high risk of losing money rapidly due to leverage. These products may not be suitable for all investors. Before engaging, you should consider whether you understand how these leveraged products work and whether you can afford the high risk of losing your money.
The Company does not accept clients from the Restricted Jurisdictions as indicated in our website/ T&C. Some services or products may not be available in your jurisdiction.
The applicable legal entity and its respective products and services depend on the client’s country of residence and the entity with which the client has established a contractual relationship during registration.


