ETHEREUM (ETH/USD):
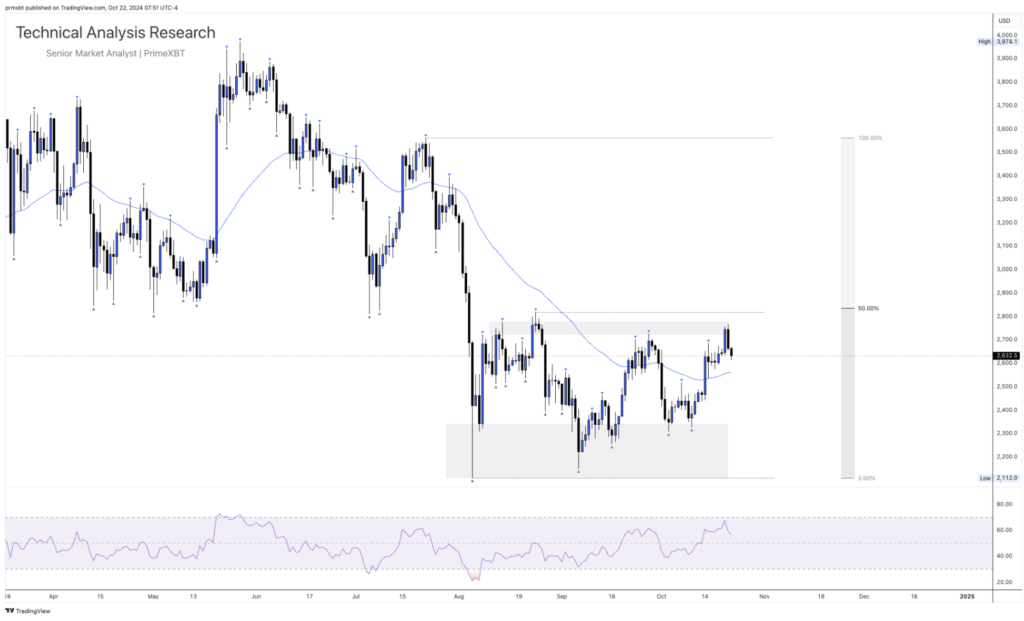
ETH appears to remain confined within the daily range shown below. Currently, it’s trading just below an internal resistance zone near $2,700. If the price can break above this level, I’d be keen to see how it responds to the 50% level on the Fibonacci tool.

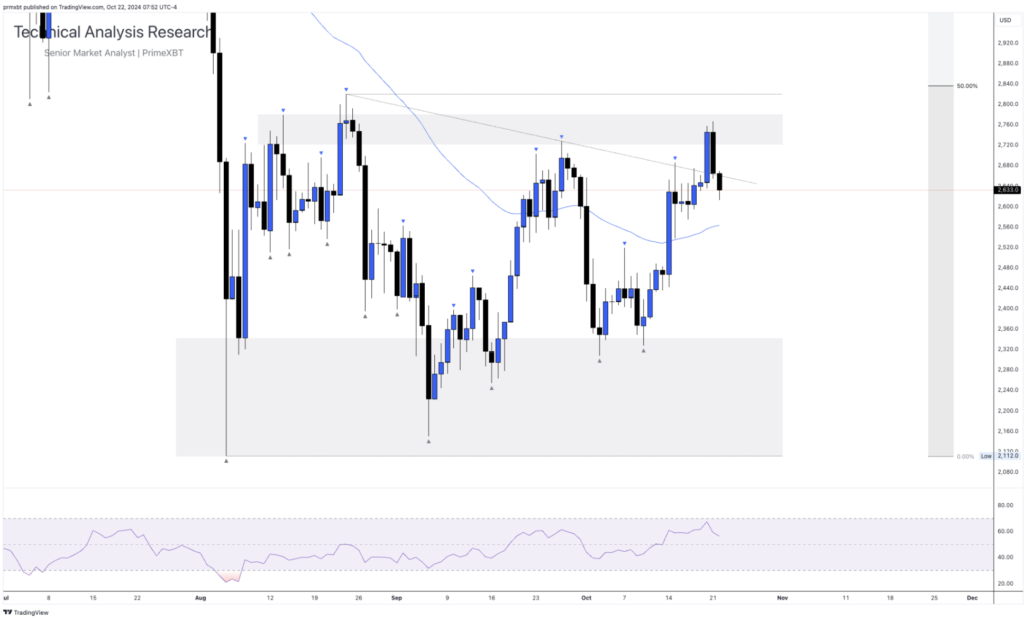
Looking more closely at the technicals, we can see that the price briefly broke out above the internal descending trend line and now appears to be retesting it. If the trend line fails to hold as support and the price doesn’t continue to rise, I’ll be watching how it performs in the lower support areas around $2,400. The RSI indicator doesn’t currently suggest that the price is overbought.

The content provided here is for informational purposes only. It is not intended as personal investment advice and does not constitute a solicitation or invitation to engage in any financial transactions, investments, or related activities. Past performance is not a reliable indicator of future results.
The financial products offered by the Company are complex and come with a high risk of losing money rapidly due to leverage. These products may not be suitable for all investors. Before engaging, you should consider whether you understand how these leveraged products work and whether you can afford the high risk of losing your money.
The Company does not accept clients from the Restricted Jurisdictions as indicated in our website/ T&C. Some services or products may not be available in your jurisdiction.
The applicable legal entity and its respective products and services depend on the client’s country of residence and the entity with which the client has established a contractual relationship during registration.


