BITCOIN (BTC/USD)
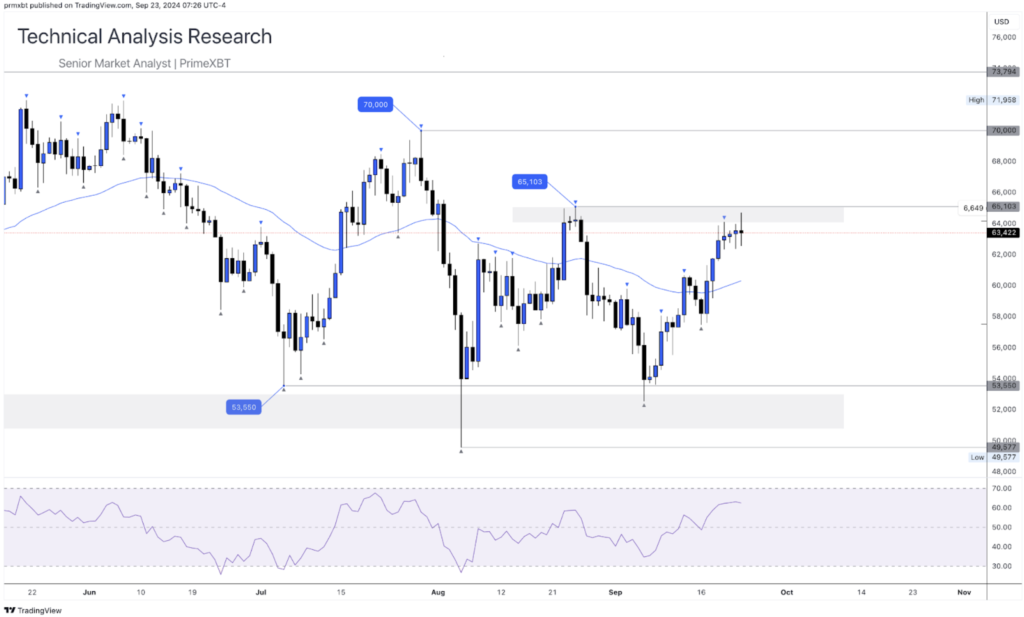
Last week, I highlighted this area on Bitcoin’s daily timeframe as a key point of interest, where I was curious to see how the price would react upon reaching it. For now, it seems that the price is facing resistance at this level, which is closely linked to the $64,000.00 price point.

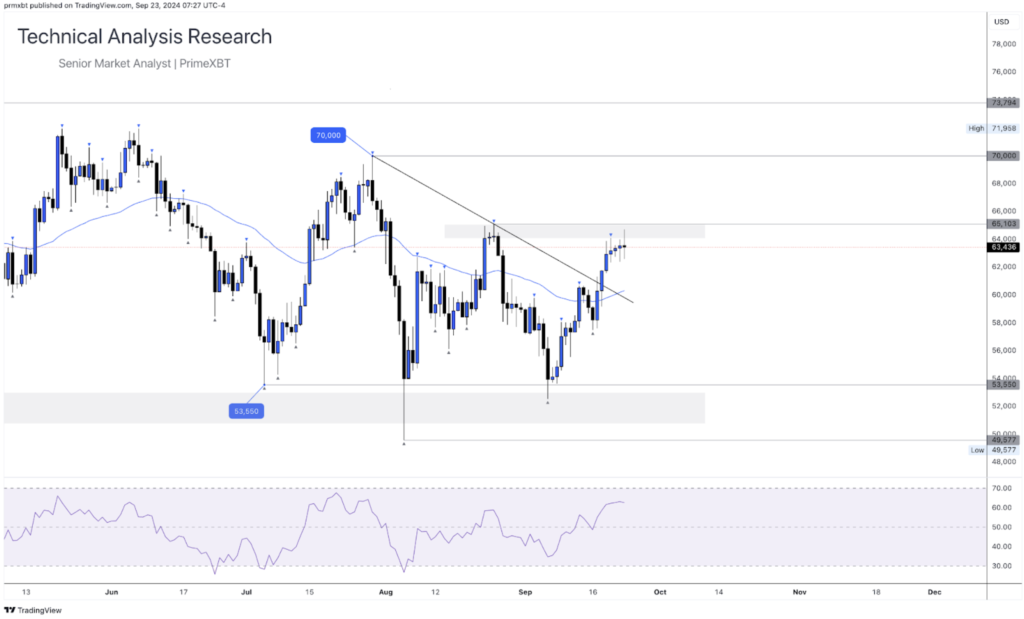
If you look closely, you’ll notice that we’ve broken out of this descending trendline. Typically, when the price breaks through resistance like this, it often retraces before moving higher. I’d be interested to see if we push up to around $65,000.00, which would also coincide with an “overbought” signal on the RSI, approaching 70%. For now, the support level seems to be holding, though we could see some short-term pullbacks before the price continues upward.

The content provided here is for informational purposes only. It is not intended as personal investment advice and does not constitute a solicitation or invitation to engage in any financial transactions, investments, or related activities. Past performance is not a reliable indicator of future results.
The financial products offered by the Company are complex and come with a high risk of losing money rapidly due to leverage. These products may not be suitable for all investors. Before engaging, you should consider whether you understand how these leveraged products work and whether you can afford the high risk of losing your money.
The Company does not accept clients from the Restricted Jurisdictions as indicated in our website/ T&C. Some services or products may not be available in your jurisdiction.
The applicable legal entity and its respective products and services depend on the client’s country of residence and the entity with which the client has established a contractual relationship during registration.


