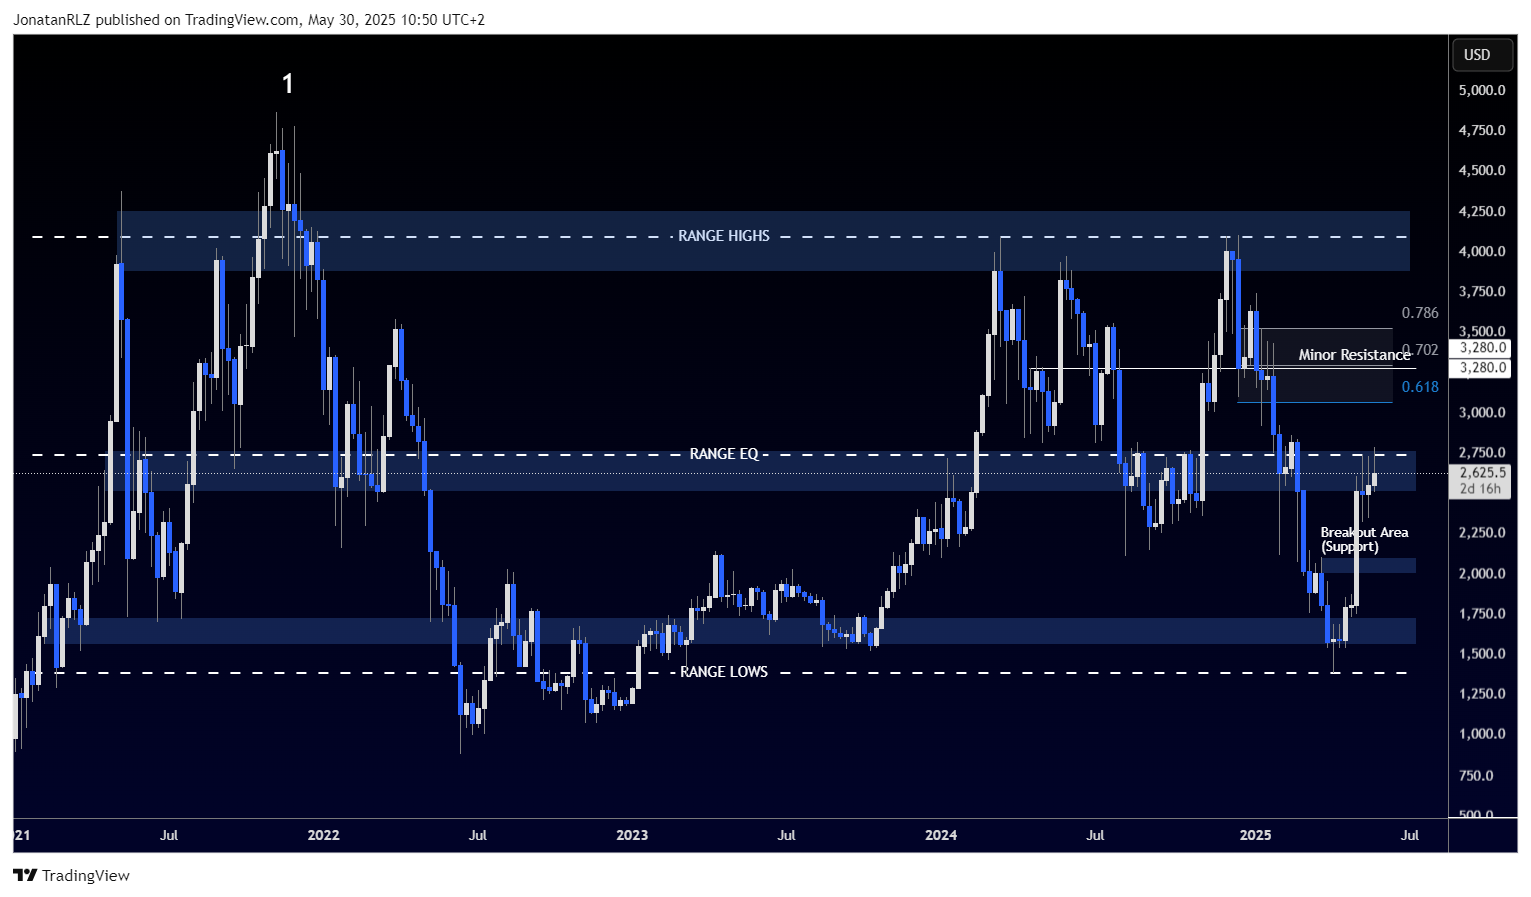
In today’s technical update on Ethereum, we begin by looking at the weekly time frame. What we can see here is Ethereum trading within a fairly clearly defined range, a structure that has been in place for the last 50 to 51 weeks. In early April, Ethereum touched the range lows and formed a major swing low. Since then, it has moved up and is currently testing the range EQ area.
One important note is that the range lows and highs are not exact. The move marked with a number one is being treated as a fake out since there was no significant structure built around that area. As with most horizontal levels, it is better to view these as zones or areas rather than exact prices.
When markets are range bound, price near the range lows increases the probability of a bullish reaction. Conversely, at the range highs, we should expect resistance until proven otherwise. Things get trickier around the range EQ, as this is the midpoint of the range, and directional bias becomes less clear.
Right now, Ethereum is testing the range EQ from below. This could be viewed as a potential bearish retest unless price reclaims that level as support. If Ethereum manages to close back above the range EQ, which sits around 2,750, we have a minor resistance area at 3,280 to watch. This level also aligns with the midpoint of the short reload zone measured from the recent high down to the low.

Given this price action, cautious optimism is warranted while waiting for confirmation.
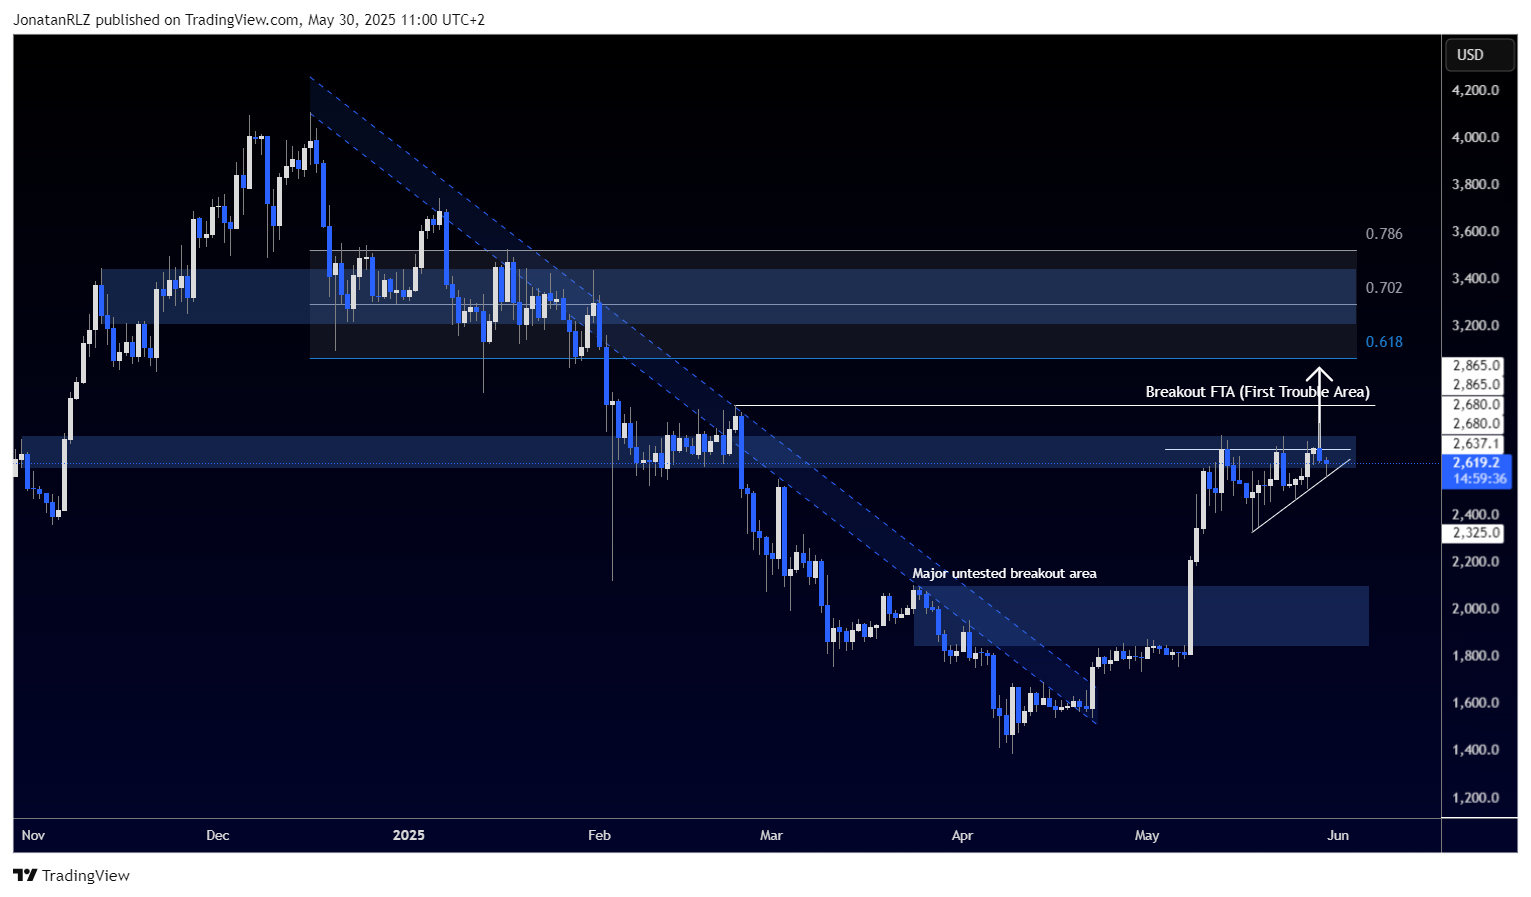
Switching to the daily time frame, we see that Ethereum had a strong breakout above the 2,000 level earlier in May. Price is now testing a local resistance zone around 2,680 and appears to be forming an ascending triangle at this area.
The apex of the triangle is close, and typically, breakouts from these patterns occur around 75 percent into the formation. That’s about where we are now. If we apply the measured move method, a breakout would target the 3,000 level, which also aligns with the 0.618 retracement fib. A more conservative target before that is at 2,865, which could act as the first trouble area.
In summary, price action looks fairly bullish at the high time frame range EQ, and a confirmed breakout from this ascending triangle could signal continuation within the larger range structure. However, if the triangle fails and breaks down, the next major untested breakout area to the downside sits around the 2,000 mark.

Trading involves risk.
The content provided here is for informational purposes only. It is not intended as personal investment advice and does not constitute a solicitation or invitation to engage in any financial transactions, investments, or related activities. Past performance is not a reliable indicator of future results.
The financial products offered by the Company are complex and come with a high risk of losing money rapidly due to leverage. These products may not be suitable for all investors. Before engaging, you should consider whether you understand how these leveraged products work and whether you can afford the high risk of losing your money.
The Company does not accept clients from the Restricted Jurisdictions as indicated in our website/ T&C. Some services or products may not be available in your jurisdiction.
The applicable legal entity and its respective products and services depend on the client’s country of residence and the entity with which the client has established a contractual relationship during registration.


