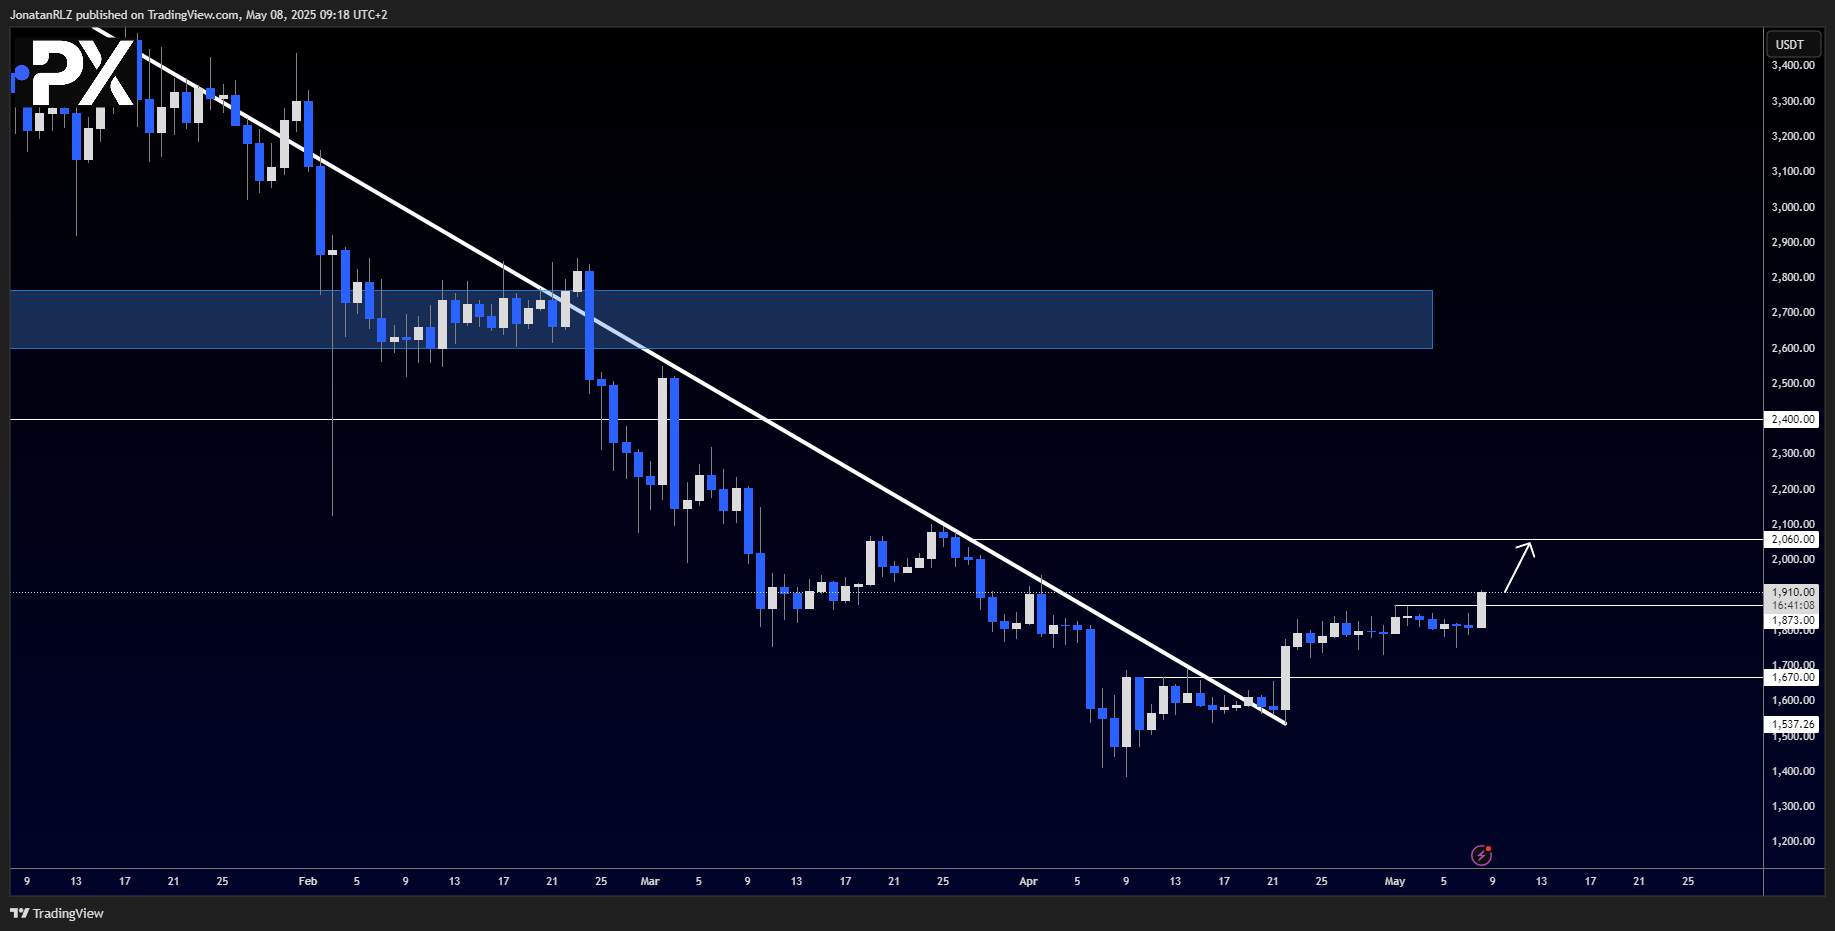
In our previous update on Ethereum (ETH/USD), we highlighted that ETH had broken above a long-term descending trendline but was still trading inside a clear range. Price remained confined within this range for about 15 days before finally breaking out above the range high at 1,873.
With this breakout now confirmed, attention shifts to the next major resistance level at 2,060. Traders will be monitoring price action closely to see if bullish momentum can carry Ethereum toward this level.
Break-and-retest traders will also be watching for potential pullbacks to the breakout area. We will examine this setup further in the 4-hour chart analysis below.

On the 4-hour time frame, we see a structure very similar to Bitcoin (BTC/USD). The breakout area corresponds to the previous range highs at around 1,873, with the initial breakout area just above the range EQ at approximately 1,814.
The key question now is what happens if price retests the range highs. A confirmed bounce from this level could set up a continuation move toward the next high time frame resistance at 2,060. On the other hand, a break back below this level could see Ethereum (ETH/USD) re-enter the previous range structure.
These are the critical levels to monitor for Ethereum (ETH/USD) going forward.

Trading involves risk.
The content provided here is for informational purposes only. It is not intended as personal investment advice and does not constitute a solicitation or invitation to engage in any financial transactions, investments, or related activities. Past performance is not a reliable indicator of future results.
The financial products offered by the Company are complex and come with a high risk of losing money rapidly due to leverage. These products may not be suitable for all investors. Before engaging, you should consider whether you understand how these leveraged products work and whether you can afford the high risk of losing your money.
The Company does not accept clients from the Restricted Jurisdictions as indicated in our website/ T&C. Some services or products may not be available in your jurisdiction.
The applicable legal entity and its respective products and services depend on the client’s country of residence and the entity with which the client has established a contractual relationship during registration.


