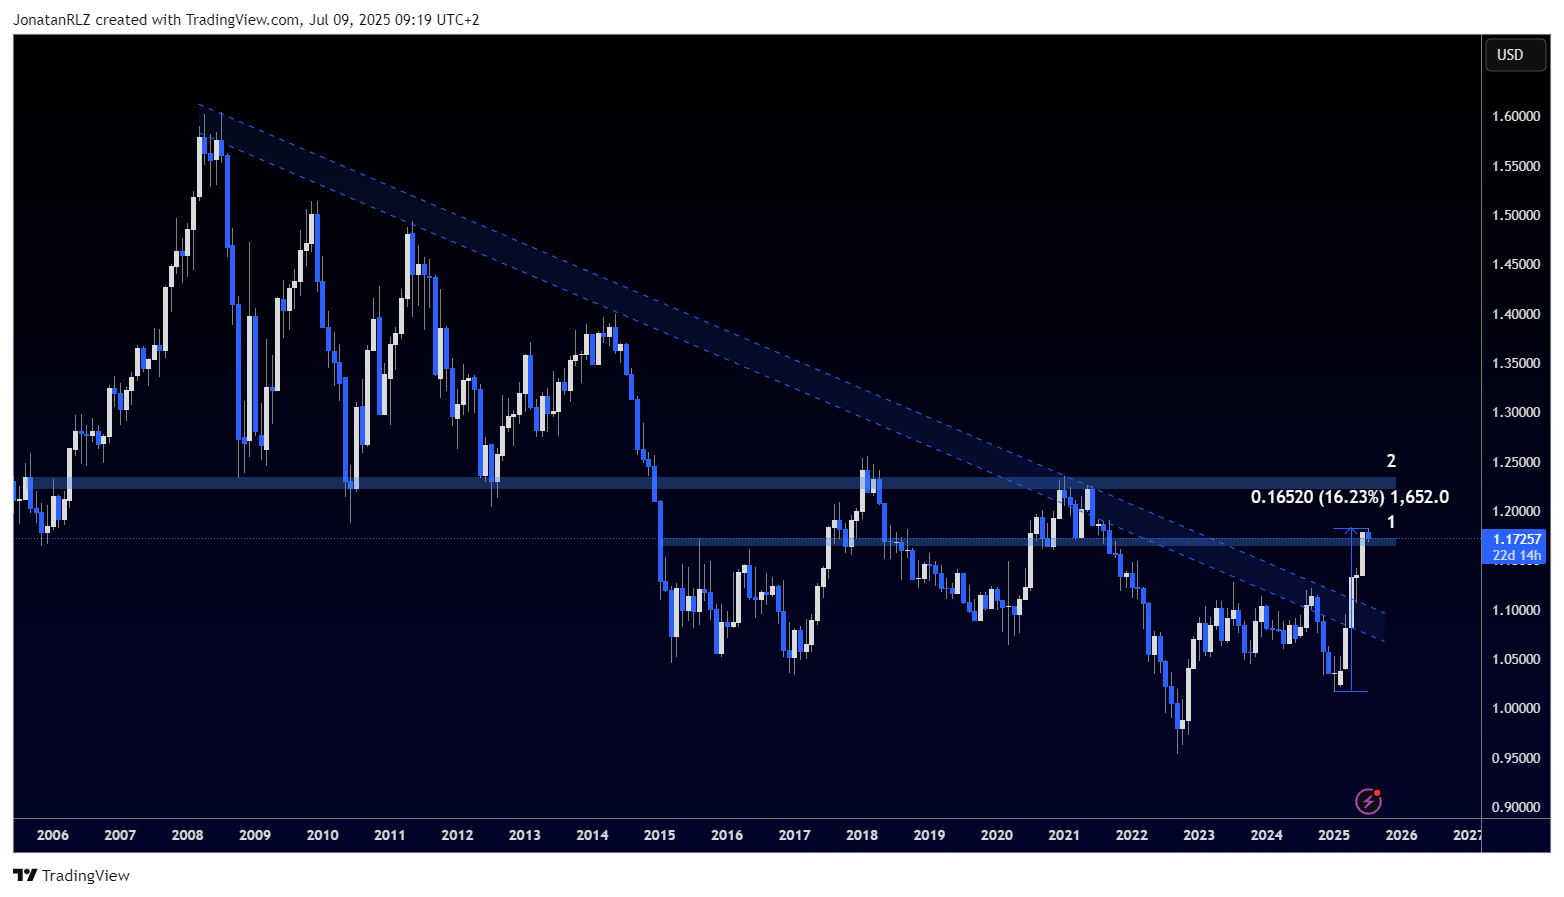
This year, EUR/USD has delivered an impressive performance, rallying over 16 percent since January. On the monthly chart, the magnitude of this move stands out even more when viewed in the context of the higher time frame.
The most significant development has been EUR/USD breaking above the 1.1700 level, marked as number one on the chart. This zone has acted as a major resistance in recent years, and the ability to hold above it suggests a potential shift in the broader high time frame structure. While the break above the long term descending trendline that has capped price since 2008 is also notable, it is better viewed as an interesting observation rather than a decisive signal.
It is worth noting that this descending trendline was drawn using the parallel channel tool on TradingView, creating a trendline area rather than a single line. This approach defines a buffer zone around resistance, much like how horizontal support and resistance levels are treated.
If buyers continue to hold above the 1.1700 level and build structure, we could see the formation of a new high time frame range, with support near 1.1700 and resistance around 1.2200. The potential range midpoint sits near 1.2000. While it is still too early to confirm, these levels highlight the significance of the breakout.

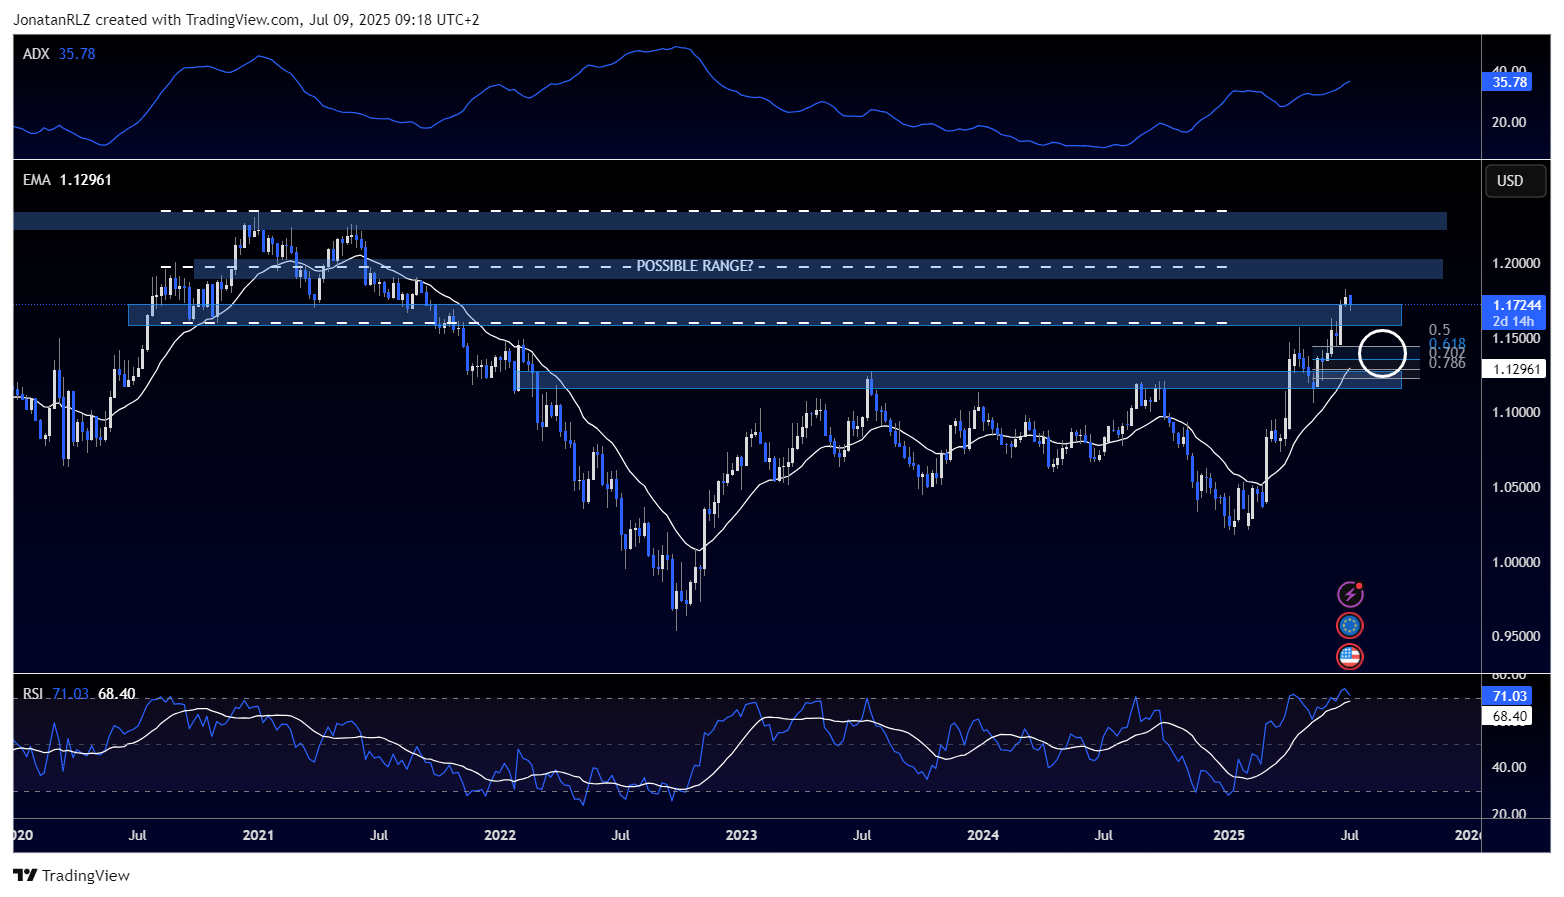
On the weekly chart, the picture becomes clearer. Price is now trading between 1.1700 and 1.2200, with a newly marked horizontal level at 1.2000. A bearish reaction near this midpoint would lend further weight to the idea of a developing range. Conversely, if the breakout fails, strong support sits lower at 1.1450. This area aligns with the 50 percent Fibonacci retracement of the recent move and lies just above the weekly 20 EMA (white line), which may converge closer to this zone in the coming weeks. This area of confluence is marked with a white circle on the chart.
The RSI on the weekly chart is currently overbought and has not been this elevated since late 2018. Overbought conditions like this can persist during strong trends and should not be taken alone as a signal for reversal, but they are worth noting when evaluating momentum and divergences.
Additional confirmation comes from the ADX indicator, which shows the trend remains strong with no obvious signs of slowing down on the higher time frames.

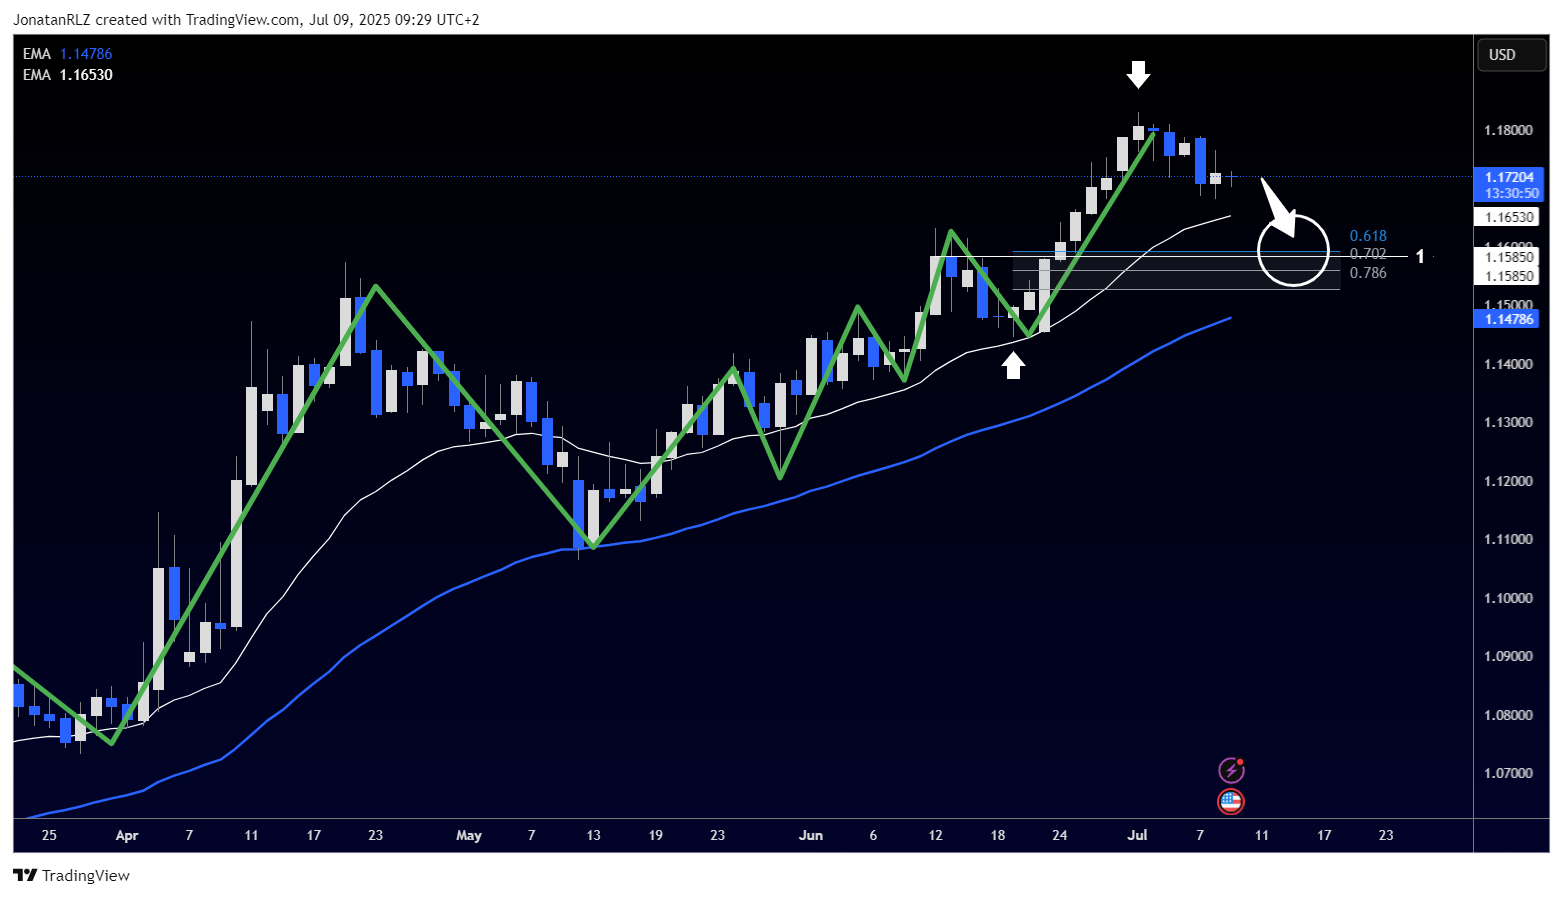
On the daily chart, EUR/USD continues to trade in a strong bullish trend marked by green trendlines. The price is consolidating after a local top, with a key support zone identified at 1.1600 (level one). This area aligns with the reload zone of the latest up move, defined by Fibonacci anchors marked with white arrows. The area of confluence also lies between the daily 20 EMA and 50 EMA, which often act as dynamic support levels in trending markets. If the price retraces, this zone could provide an attractive entry point for bulls.

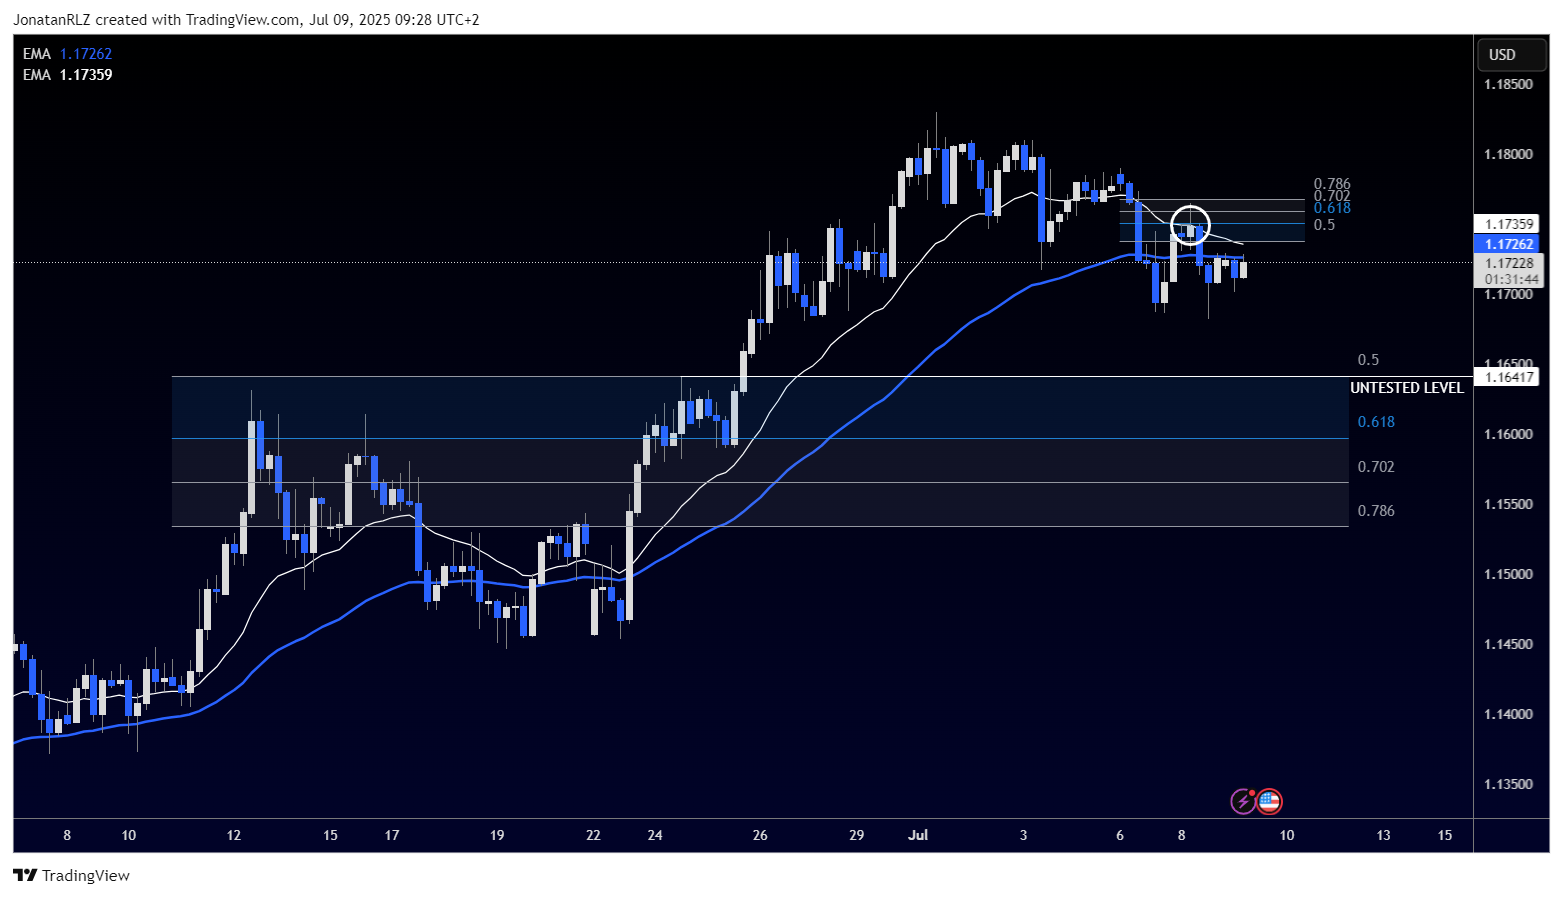
Moving to the 4-hour chart, the picture becomes even more interesting. Here, we see a local downtrend forming and a break and retest of the previous structure. The last lower high, marked with a white circle, occurred inside the short reload zone and near the 4-hour 20 and 50 EMAs. There is also an untested support level below at 1.1650, which aligns perfectly with the 50 percent retracement of the most recent up move.
This suggests that local momentum remains slightly bearish. A bullish reaction at 1.1650 could provide a pivot for renewed upside. However, if the price reclaims the local short reload zone and moves above 1.1700, this would invalidate the bearish scenario and open the door for a potential move toward the high time frame range EQ around 1.2000.
For now, traders should watch 1.1700 on the upside for continued strength and 1.1650 on the downside as a possible support zone for a local bounce.

Trading involves risk.
The content provided here is for informational purposes only. It is not intended as personal investment advice and does not constitute a solicitation or invitation to engage in any financial transactions, investments, or related activities. Past performance is not a reliable indicator of future results.
The financial products offered by the Company are complex and come with a high risk of losing money rapidly due to leverage. These products may not be suitable for all investors. Before engaging, you should consider whether you understand how these leveraged products work and whether you can afford the high risk of losing your money.
The Company does not accept clients from the Restricted Jurisdictions as indicated in our website/ T&C. Some services or products may not be available in your jurisdiction.
The applicable legal entity and its respective products and services depend on the client’s country of residence and the entity with which the client has established a contractual relationship during registration.


