Welcome back to today’s technical update on Gold.
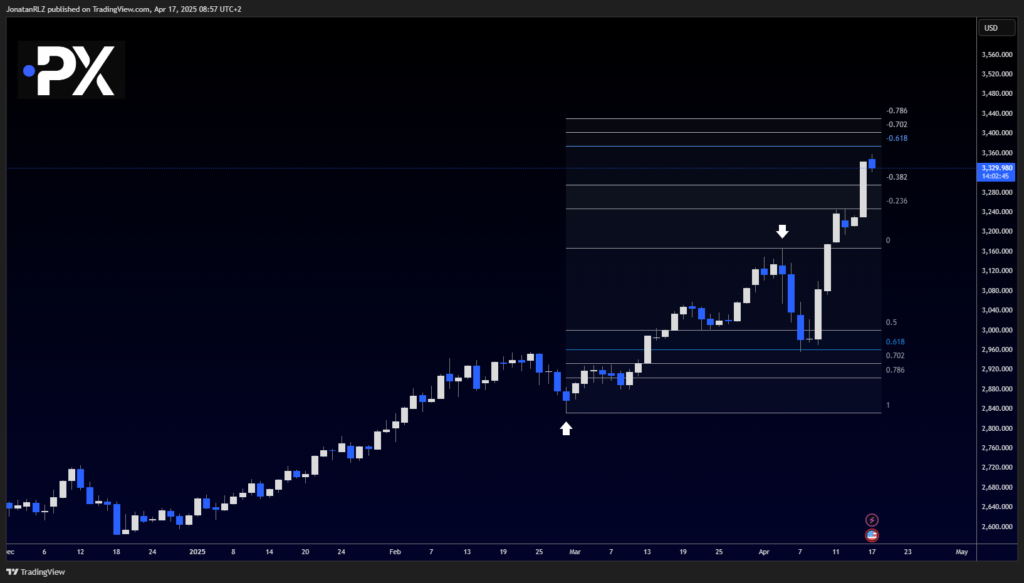
Gold continues to power through to the upside, showing clear bullish momentum. Yesterday’s daily candle closed strongly, with no upper or lower wicks—a sign that bulls maintained control throughout the entire session.
For today’s update, we’re focusing on the lower timeframes to assess whether price continues to respect the Fibonacci extension levels we’ve been monitoring, and to evaluate whether a short-term range may be forming.
We’ll be looking for clues that point to either:
- A reaccumulation range, which could act as a base for further upside
- Or a distribution range, which may signal the start of a pullback or cooling off period
With Gold in price discovery, it could be beneficial to monitor how price behaves around key Fibonacci extension levels and observe whether any clear structure forms at current highs. These zones may help define risk and offer early clues regarding potential momentum shifts.

Intraday View – Gold (1H Chart)
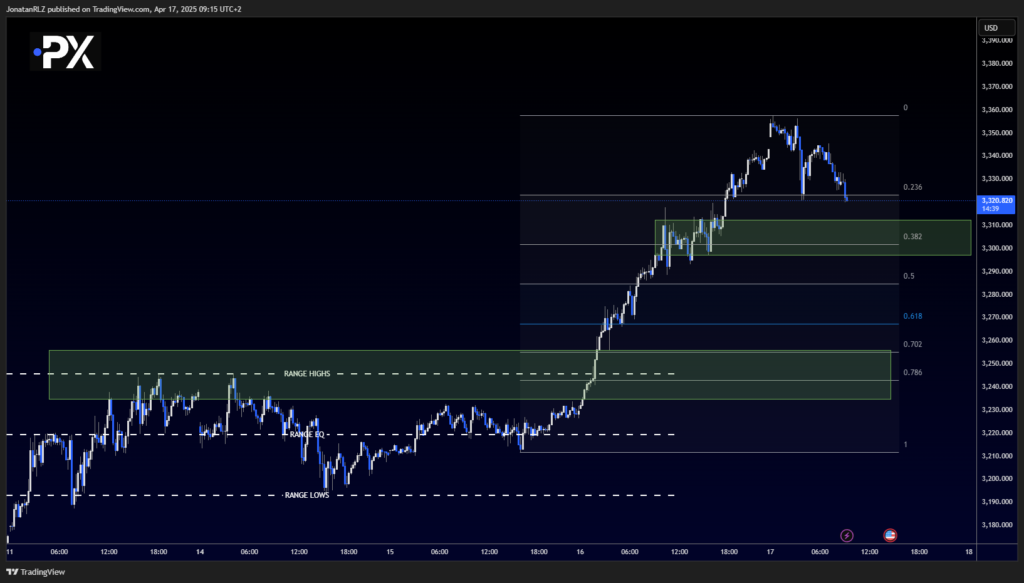
Zooming into the 1-hour chart, we can see that although Gold had a reaction around the -0.382 Fibonacci extension, it wasn’t as pronounced as the clear rejection we previously observed at the -0.236 level.
Following the impulsive move that began Tuesday and led to a breakout above the previous range highs yesterday, momentum now appears to be slowing down. Price has paused, and we’re beginning to see signs of a low timeframe rejection, highlighted by a downward-sloping trendline on the chart.
Below current price, we’ve also marked a support area aligned with the -0.382 Fib level, which could act as a short-term support zone if this pullback deepens.
To get a better view of what could come next, we’ll shift to the next chart and apply a fresh set of Fibonacci levels to this most recent breakout leg. This may help outline possible upside targets if momentum resumes—or define nearby levels that could hold if the market enters a range or retraces further.

15-Minute Chart – Short-Term Fib Structure and Key Support Levels
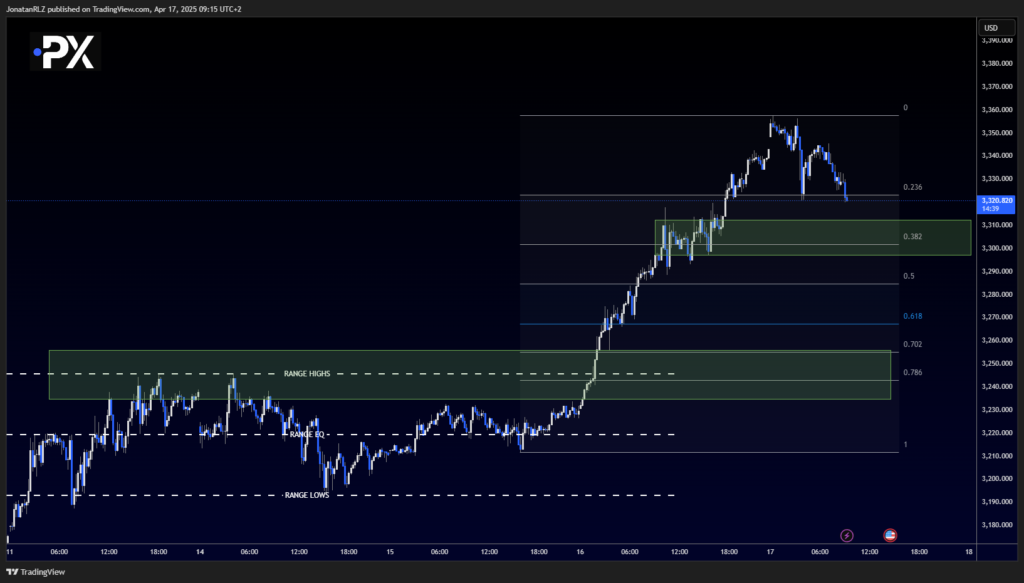
Zooming into the 15-minute chart and applying the Fibonacci retracement tool to the most recent impulse leg, we can see that price is currently reacting to the 0.236 level, within a low timeframe consolidation zone. This area could be viewed as a temporary pause in the broader upward move.
This consolidation zone is also in confluence with the 0.382 Fib level, which may reinforce its importance as short-term support.
Further below, the previous range highs align nicely with the 0.702 and 0.786 levels, forming a clear support zone that could attract interest if price pulls back more significantly.
If price continues to consolidate and eventually breaks to the upside again, attention would likely shift back to the -0.618 high timeframe extension level around $3,375, which may serve as the next resistance.
These levels offer useful structure for intraday and short-term traders monitoring Gold’s momentum in this ongoing trend.

The content provided here is for informational purposes only. It is not intended as personal investment advice and does not constitute a solicitation or invitation to engage in any financial transactions, investments, or related activities. Past performance is not a reliable indicator of future results.
The financial products offered by the Company are complex and come with a high risk of losing money rapidly due to leverage. These products may not be suitable for all investors. Before engaging, you should consider whether you understand how these leveraged products work and whether you can afford the high risk of losing your money.
The Company does not accept clients from the Restricted Jurisdictions as indicated in our website/ T&C. Some services or products may not be available in your jurisdiction.
The applicable legal entity and its respective products and services depend on the client’s country of residence and the entity with which the client has established a contractual relationship during registration.


