Welcome back, everyone, to another technical update on Gold.
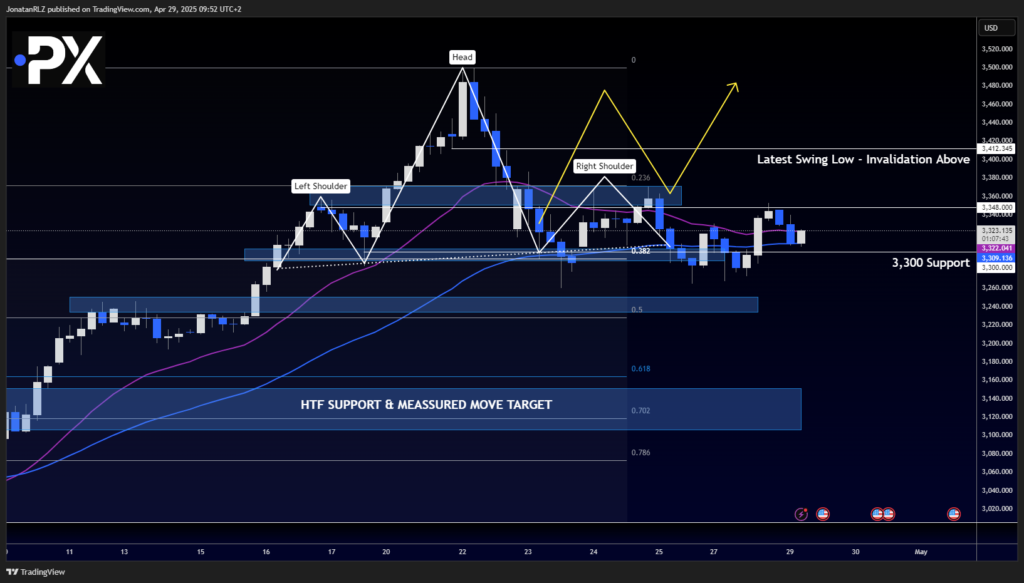
We begin today’s update by revisiting the potential head and shoulders pattern that we have been covering in previous sessions.
Looking at the 4-hour chart, the initial rejection at the 0.236 Fibonacci retracement level (~$3,360) late last week had the potential to form the right shoulder of the pattern.
However, price action has shifted.
What we’re seeing now is a series of equal lows and swing highs forming around the same areas, which is more indicative of a developing range rather than a clean head and shoulders reversal.
At this point:
- Range Highs: ~$3,360 (near the 0.236 Fibonacci level)
- Range Lows: ~$3,300 (near the 0.382 Fibonacci level)
This evolving structure matches the potential range idea discussed in yesterday’s update.
Additionally, we can observe that the 20 EMA and 50 EMA on the 4-hour chart are now moving sideways.
This is a good visual confirmation that price is consolidating, and it’s a great example of how simple moving average analysis can quickly show whether an asset is trending or ranging.
When moving averages flatten out like this, it typically signals that neither buyers nor sellers are currently in clear control.
Given this clearer shift in structure, we’ll now move into the 1-hour timeframe, remove the head and shoulders markings, and properly define the new range structure from a fresh perspective.

1H Chart – Break and Retest of Range EQ as Bulls Push Higher
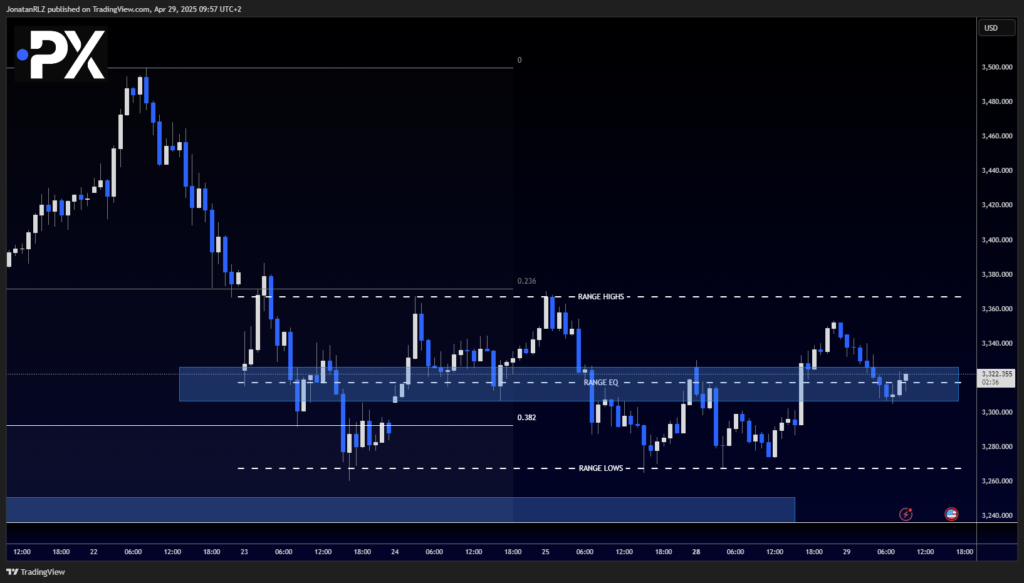
Zooming into the 1-hour timeframe, we can now see a clearly defined range developing:
- Range Lows: ~$3,265
- Range EQ (Equilibrium):~$3,315
- Range Highs: ~$3,365
Currently, price action shows a break and retest of the range EQ at $3,315.
At the time of writing this article, bulls are taking control over the lower timeframes, pushing price higher and potentially aiming for a retest of the range highs around $3,365.
Key Observations:
- For Gold to truly regain the strong bullish momentum that we’ve seen over the past months, we would ideally want to see a clean breakout above the range highs
- A break above $3,365 could open the door for a move toward the all-time highs area near $3,500.
On the flip side:
- If this current rally fails and price breaks down below the range lows at $3,265,
- We would shift our focus back toward the previously marked support zones:
- First major support at $3,250,
- And a higher timeframe support level at $3,150.
The battle between bulls and bears inside this range will likely set the tone for the next major directional move in gold.

The content provided here is for informational purposes only. It is not intended as personal investment advice and does not constitute a solicitation or invitation to engage in any financial transactions, investments, or related activities. Past performance is not a reliable indicator of future results.
The financial products offered by the Company are complex and come with a high risk of losing money rapidly due to leverage. These products may not be suitable for all investors. Before engaging, you should consider whether you understand how these leveraged products work and whether you can afford the high risk of losing your money.
The Company does not accept clients from the Restricted Jurisdictions as indicated in our website/ T&C. Some services or products may not be available in your jurisdiction.
The applicable legal entity and its respective products and services depend on the client’s country of residence and the entity with which the client has established a contractual relationship during registration.


