Bitcoin ended the week at virtually the same level it started, as the much-anticipated bitcoin halving came and went, quietly marking a historical point in the crypto world.
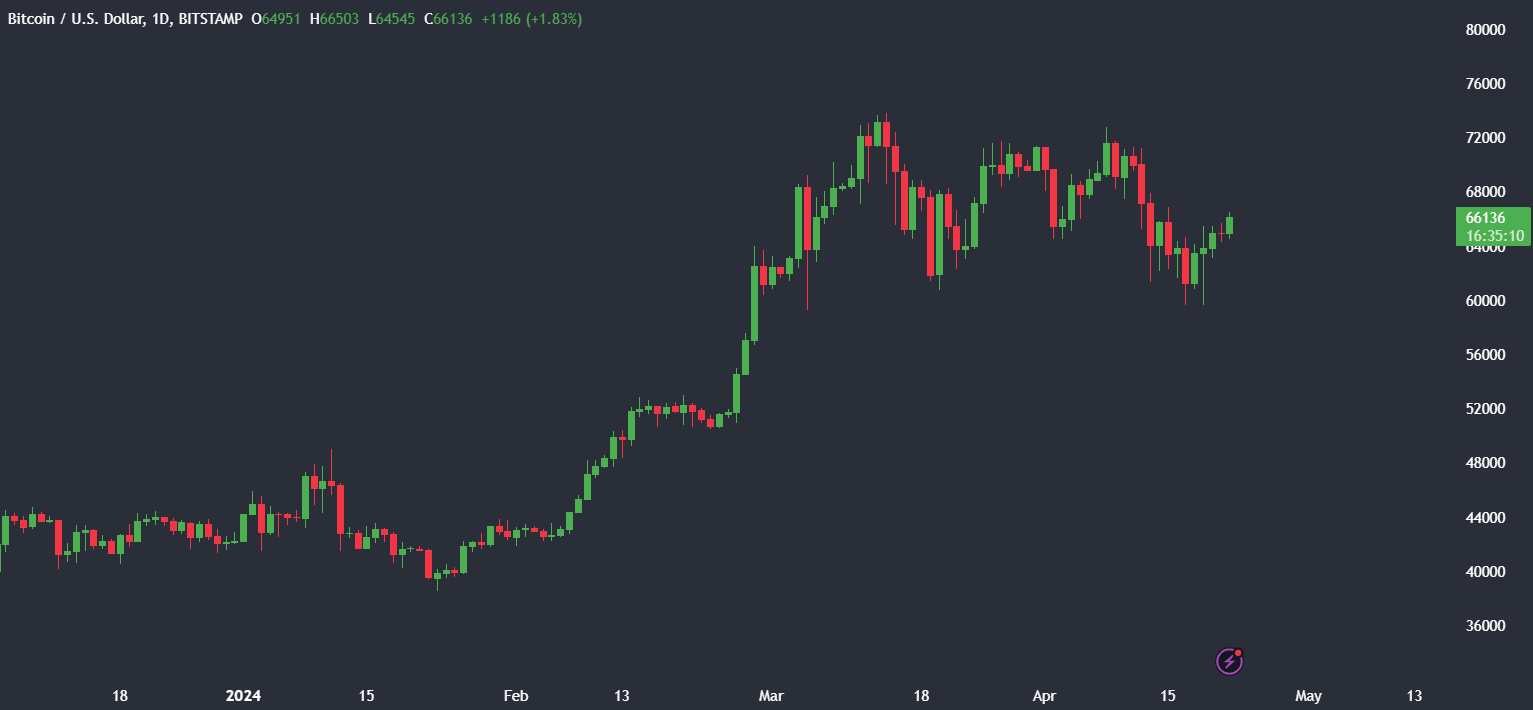
BTC/USD started last week above 65,000 before falling sharply below 60,000 to a three-week low of 59,600 in a risk-off environment, which impacted risk assets across the board. Risk assets came under pressure owing to uncertainty over the timing of Fed rate cuts and geopolitical tensions. The USD rose to fresh multi-month highs versus its major peers, and gold briefly spiked to another ATH.
The Bitcoin price then recovered back up to 65,000 following the halving event and is climbing at the start of the new week towards 66,000 as the market continues to digest this weekend’s key event.
Bitcoin halving
On April 20, at 00:10 GMT, the fourth Bitcoin halving event took place. The reward for miners was cut by 50% from 6.25 tokens to 3.125 tokens per mined block, and the price remained relatively stable at around 64,000 in what initially looked like a non-event. While the cut in issuance helps stave off inflation, it also historically precedes a significant run higher in the price of Bitcoin. Now, investors will need to sit tight to see whether a rally will take off in the coming weeks, supported by additional institutional demands through ETFs.
The four-year blockchain update will wipe billions of dollars off miners’ annual revenue; this effect will be mitigated if the price rises.
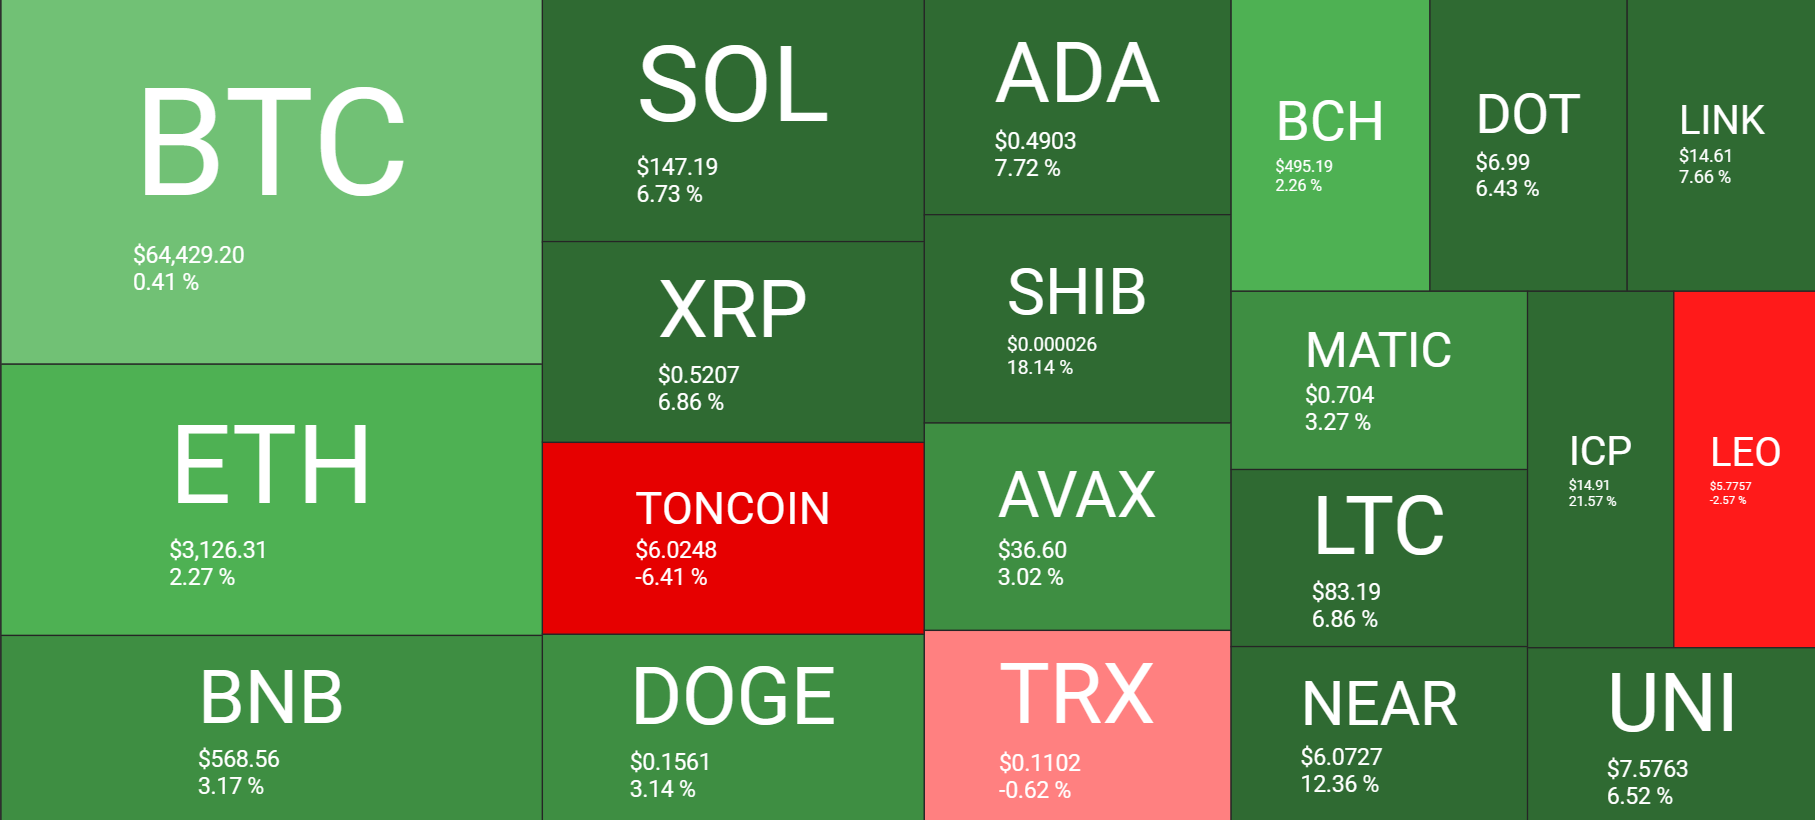
Meanwhile, the broader crypto market outperformed Bitcoin last week. Ethereum rose 2.2%. Solana and XRP rose over 6% during the week, and Cardano booked 7% gains. Meanwhile, Toncoin and Leo, which had outperformed last week, fell.
Bitcoin liquidations drop after halving
Bitcoin liquidations surged last week to a total of 240 million on Saturday, April 13, as the price dropped following Iran’s attack on Israel. Liquidations eased back to around 80 million daily across the past week as the price traded within a range of around $6,000. On April 20, following the halving event, total liquidations were just 21 million, with 13 millions of those liquidations in short positions as the price rose to 65,000.

Bitcoin fees volatility
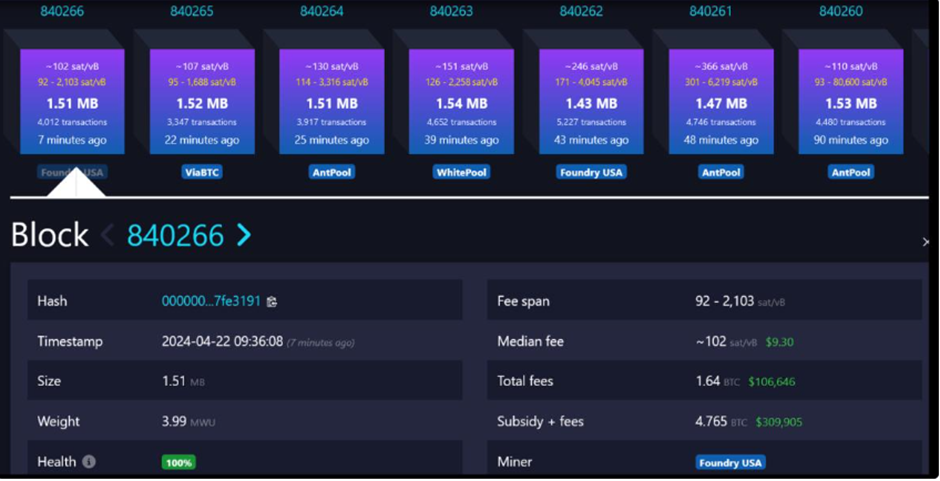
The Bitcoin halving event was supposed to cut the revenue of Bitcoin mining companies dramatically. Instead, soon after the Bitcoin halving, which was triggered at a block height of 840,000, the Bitcoin transaction fees also shot higher. This was thanks in part to the race to get the transaction as the first halving block, in an “I was there moment,” but also owing to the simultaneous launch of the Runes protocol, which resulted in massive network congestion and Bitcoin miners enjoying the highest mining returns in years following the halving event.
For the 15 blocks following 840,000 to 840,014, the average revenue per block rose to 21.74 Bitcoin, and the average transaction fee reward rose to 18.62 BTC. According to YCharts, total revenue for Bitcoin miners, including the lock rewards and transaction fees, surged to $107.8 million for the day, highlighting the impact of the Rune protocol on Bitcoin before transaction fees dropped sharply lower.

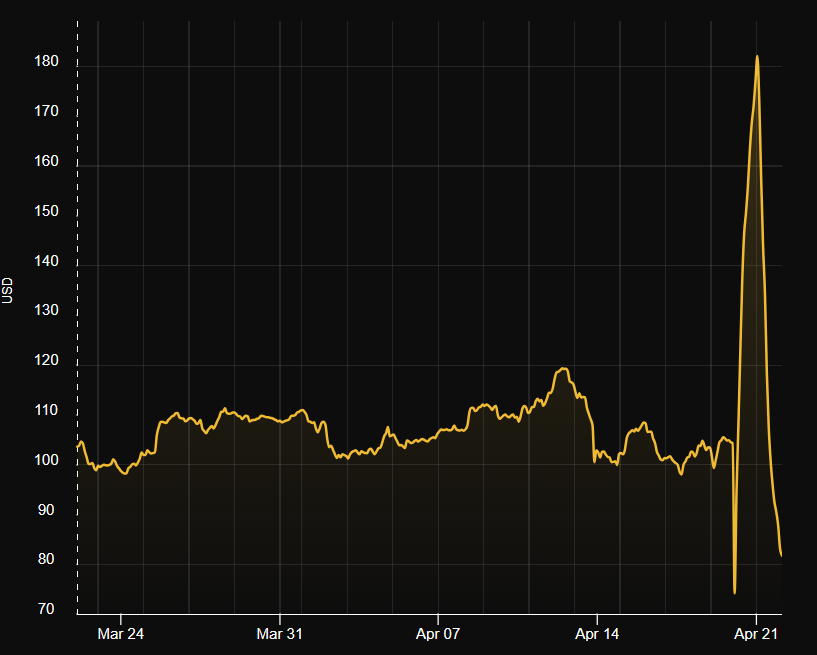
The hashprice index, which quantifies how much a miner can expect to earn from a specific quantity of hashrate, has also dropped from $182.98 per hash/day to $81, a level below its pre-halving level.
About the Runes protocol
The Runes Ordinals protocol emerged at the end of 2022, also known as the second phase of Bitcoin. Ordinals introduced pioneering capabilities enabling users to embed images, audio, and code files onto the Bitcoin blockchain. After the success of the Ordinales launch, developer Casey Rodarmor unveiled the Rubes token protocol. This streamlines the creation of flexible tokens on the Bitcoin network and marks a significant step forward in the crypto economy system.
The launch of Runes was a short-lived boon for Bitcoin miners, who will likely see their revenue drop after the halving. This frenzy has already died down, with average fees paid falling sharply.
However, some consider this a preview of what’s to come in Bitcoin economics decades from here. As Bitcoin grows into a $10 trillion-plus asset, demand for the network will be significantly larger than today.
If transaction fees normalise at a higher level than previously, the impact of halving on miner revenue will be dampened.
Bitcoin supply on exchange drops
Data from Santiment shows that Bitcoin supply on exchange (blue) has fallen sharply since early March. The supply on exchange metric shows the amount of Bitcoin held in exchange wallets and helps build a picture of market sentiment. A fall in supply on exchange could indicate that investors are moving Bitcoin to private wallets, pointing to bullish sentiment. Meanwhile, an increase in supply on the exchange could point to a selloff, which would be a bearish signal. With supply on exchange at a 6.5-year low at around 805k, this could be interpreted as a bullish signal.
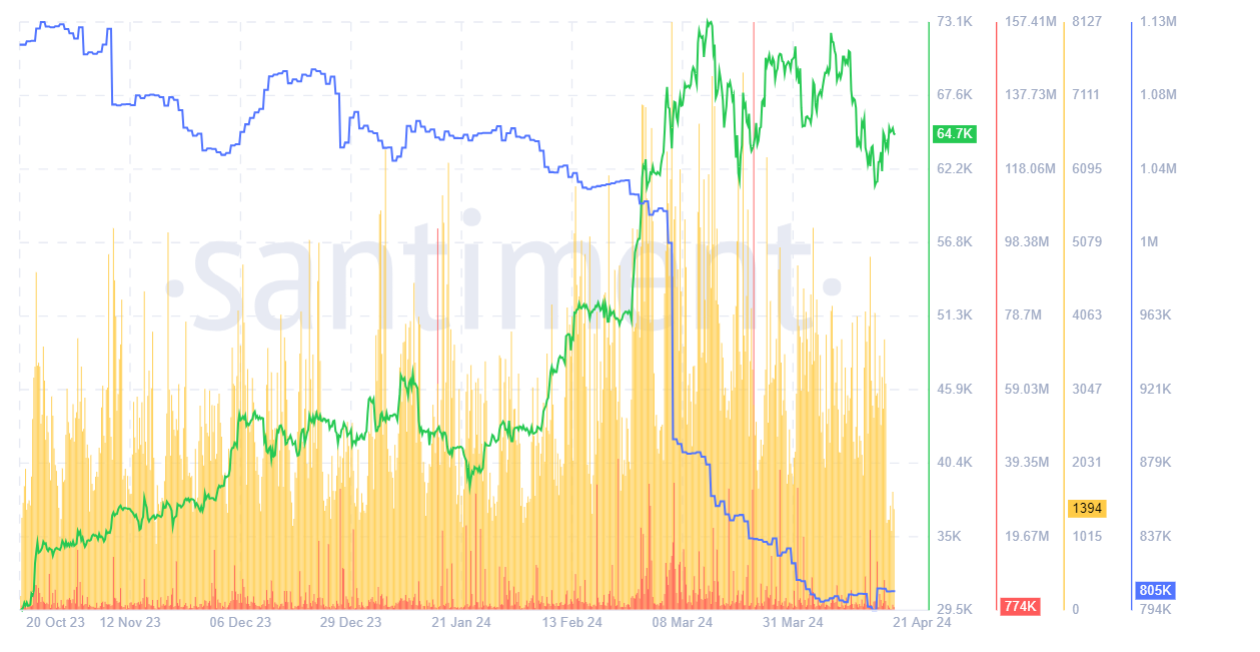
On the same chart, the whale transaction count (yellow), which measures the total number of Bitcoin transfers taking place on the chain on any given day above $100k, fell sharply over the weekend after the halving. This metric helps indicate potential market movements. A surge in whale activity often precedes volatility, which allows traders to anticipate swings in the Bitcoin price. However, a drop in whale transactions could point to a consolidation in the price.
Bitcoin funding rate turned negative
Other notable occurrences last week include Bitcoin funding rates flipping negative and flip-flopping across the zero level multiple times in recent days, which could support a slightly negative bias but by no means widespread panic. Sellers appear to have been de-risking, but at the same time, we have seen strong bids around the 60,000 to 62,000 level, highlighted in the BTC/USD chart by the long lower wicks on these candles.
Risk-off eases, Fed uncertainty remains; attention turns to US core PCE & Q1 GDP & oil falls
Risk-off sentiment dominated last week’s environment as investors continued to rein in Federal Reserve rate cut expectations and amid geopolitical tensions in the Middle East after direct attacks between Iran and Israel. The S&P 500 fell 3%, dropping to a 6-week low.
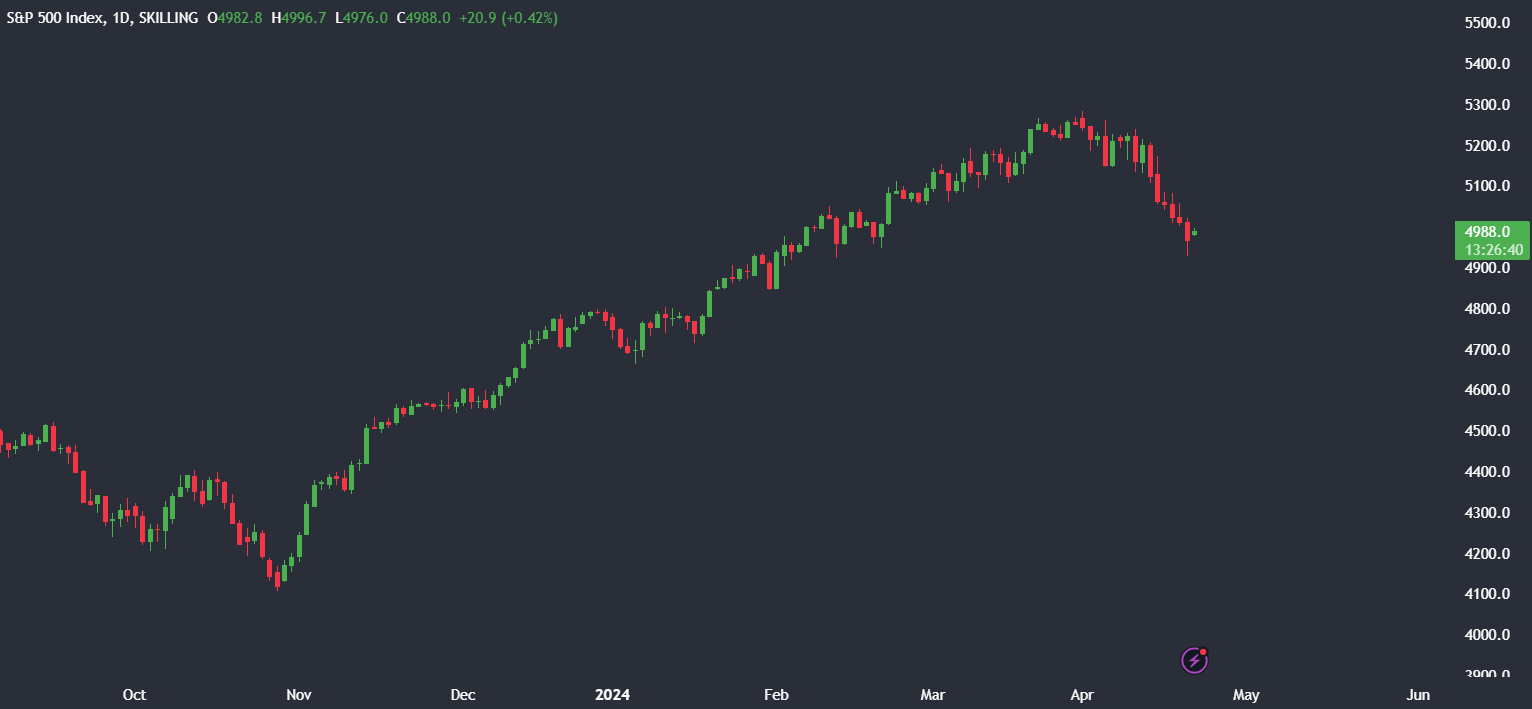
There was little in the way of U.S. economic data. Still, the data released, such as jobless claims, came in stronger than expected, and Fed speakers highlighted a lack of progress on cooling inflation towards the 2% target, meaning there is no urgency to cut rates soon.
The market is pricing the first interest rate cut in the US in September, which had been pushed back from July.
Meanwhile, Iran-Israel tensions appear to be easing in the Middle East. Iran has played down the risk of escalation of hostilities after Israel’s small strike on Iran late last week.
Oil prices briefly reached a five-month high at $87.75 before falling sharply lower as Iran indicated that it was not interested in retaliating against Israel’s attack. Instead, demand worries pulled oil prices lower and are dragging them southwards at the start of the week. The prospect of interest rates staying higher for longer in the US is bad news for the outlook of oil demand.
Looking ahead, attention this week will remain on the U.S. economic calendar for further clues over when the Fed could move on interest rates. US Q1 GDP data and US core PCE, the fed’s preferred gauge for inflation, will be watched closely this week.
Any sense of a stronger-than-forecast U.S. economy with sticky inflation could see investors push back on Fed rate cut bets further, potentially pulling stocks lower and lifting the US dollar.
The content provided here is for informational purposes only. It is not intended as personal investment advice and does not constitute a solicitation or invitation to engage in any financial transactions, investments, or related activities. Past performance is not a reliable indicator of future results.
The financial products offered by the Company are complex and come with a high risk of losing money rapidly due to leverage. These products may not be suitable for all investors. Before engaging, you should consider whether you understand how these leveraged products work and whether you can afford the high risk of losing your money.
The Company does not accept clients from the Restricted Jurisdictions as indicated in our website/ T&C. Some services or products may not be available in your jurisdiction.
The applicable legal entity and its respective products and services depend on the client’s country of residence and the entity with which the client has established a contractual relationship during registration.


