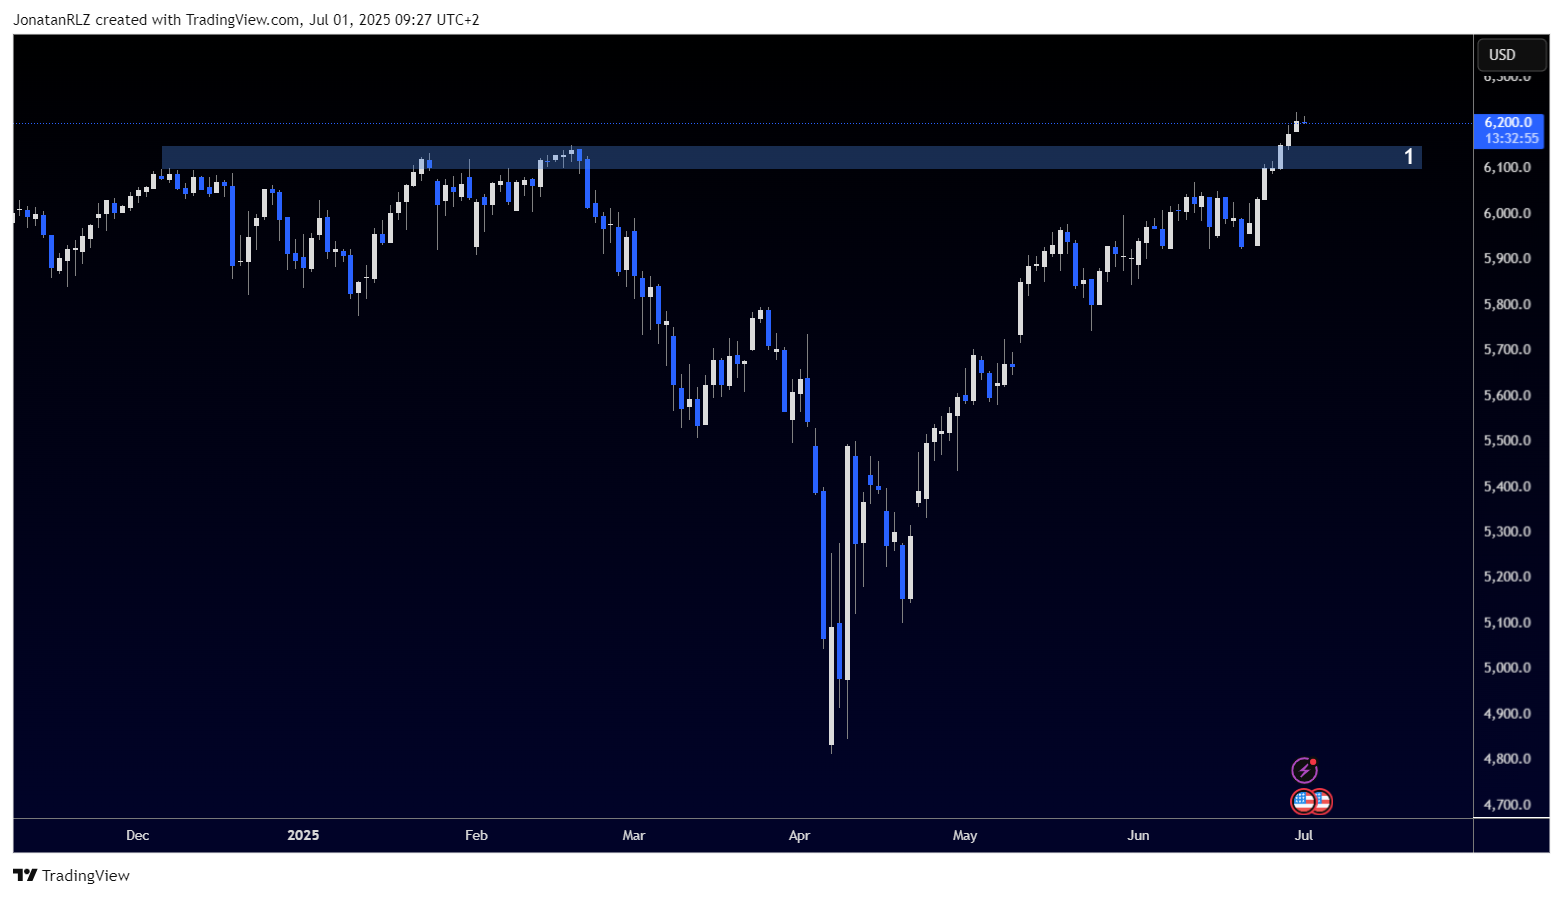
The S&P 500 is currently printing a bearish candle following six consecutive bullish daily closes. If today’s candle were to finish green, it would mark the first seven-day streak since the end of April, a sign of continued strength. However, the current price action suggests possible exhaustion and the potential for a short-term pullback.
On the daily chart, the most significant support area sits at 6,150, marked as level 1. This level is critical in the event of a retracement, serving as the nearest high time frame horizontal structure below the current price.

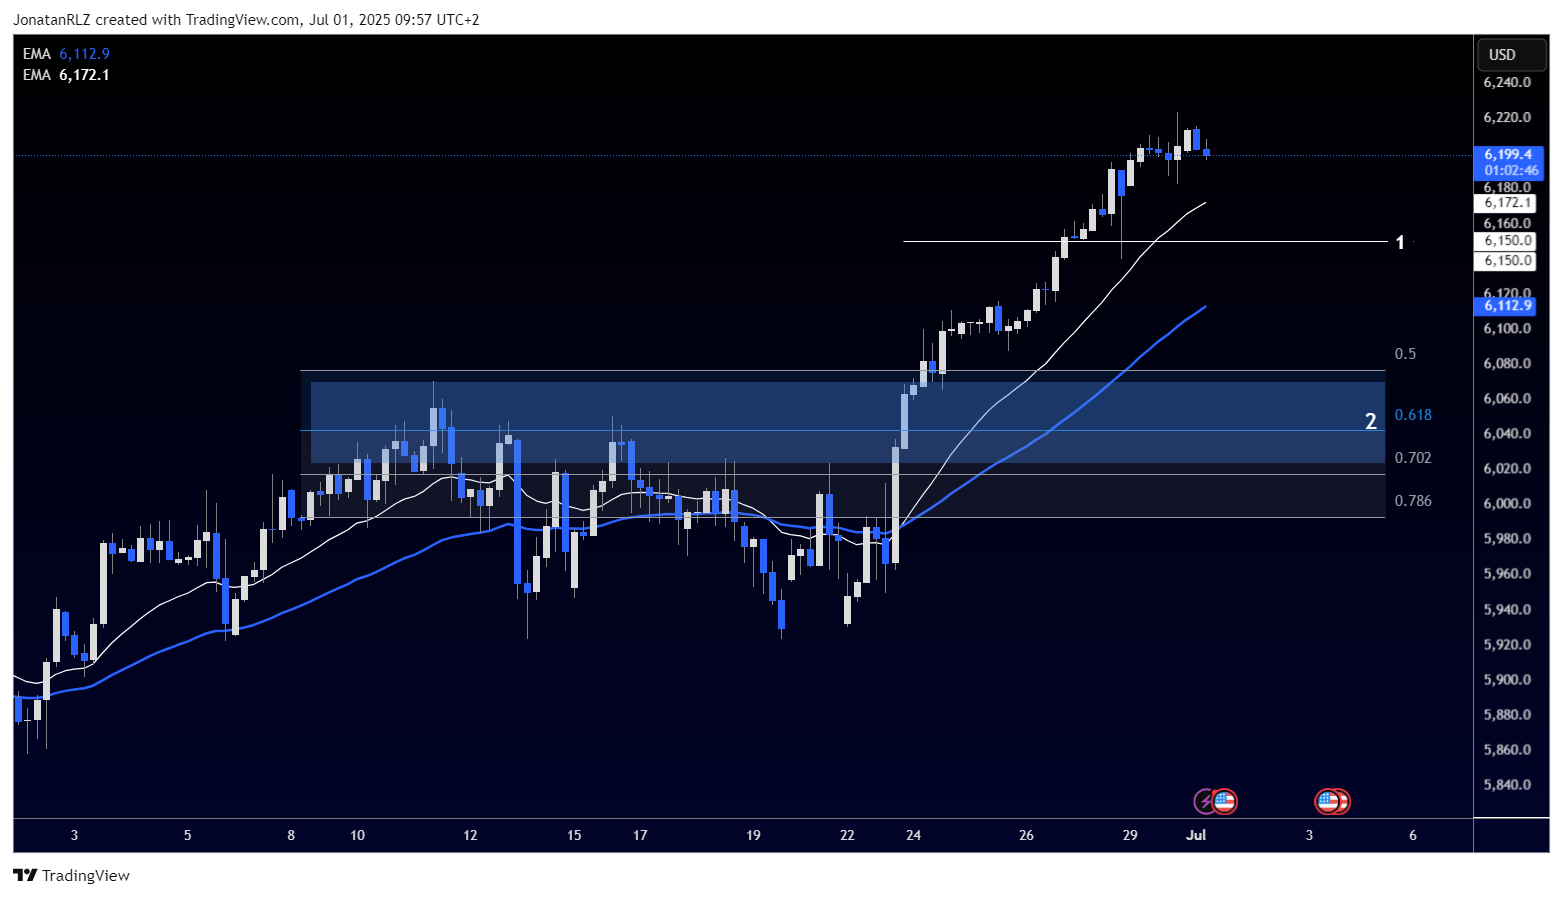
Zooming into the 4-hour chart, the 6,150 zone again stands out as the first support to monitor. Below that, we have level 2 near 6,050, which aligns with the 0.618 Fibonacci retracement measured from the recent breakout move. This area also represents a major breakout zone and adds strong technical confluence should price retrace more deeply.
Another important aspect to watch is the behaviour around the 4-hour exponential moving averages. The white line represents the 20 EMA and the blue line the 50 EMA, both of which often act as dynamic support zones during sustained momentum moves. These EMAs currently sit just above the 6,150 level, adding further weight to this region as a potential bounce zone.
If momentum fades and price begins to retrace, traders will likely watch the 6,150–6,050 area for signs of renewed buying interest. Until then, the broader trend remains bullish, but short-term pullback risk is rising.

Trading involves risk.
The content provided here is for informational purposes only. It is not intended as personal investment advice and does not constitute a solicitation or invitation to engage in any financial transactions, investments, or related activities. Past performance is not a reliable indicator of future results.
The financial products offered by the Company are complex and come with a high risk of losing money rapidly due to leverage. These products may not be suitable for all investors. Before engaging, you should consider whether you understand how these leveraged products work and whether you can afford the high risk of losing your money.
The Company does not accept clients from the Restricted Jurisdictions as indicated in our website/ T&C. Some services or products may not be available in your jurisdiction.
The applicable legal entity and its respective products and services depend on the client’s country of residence and the entity with which the client has established a contractual relationship during registration.


