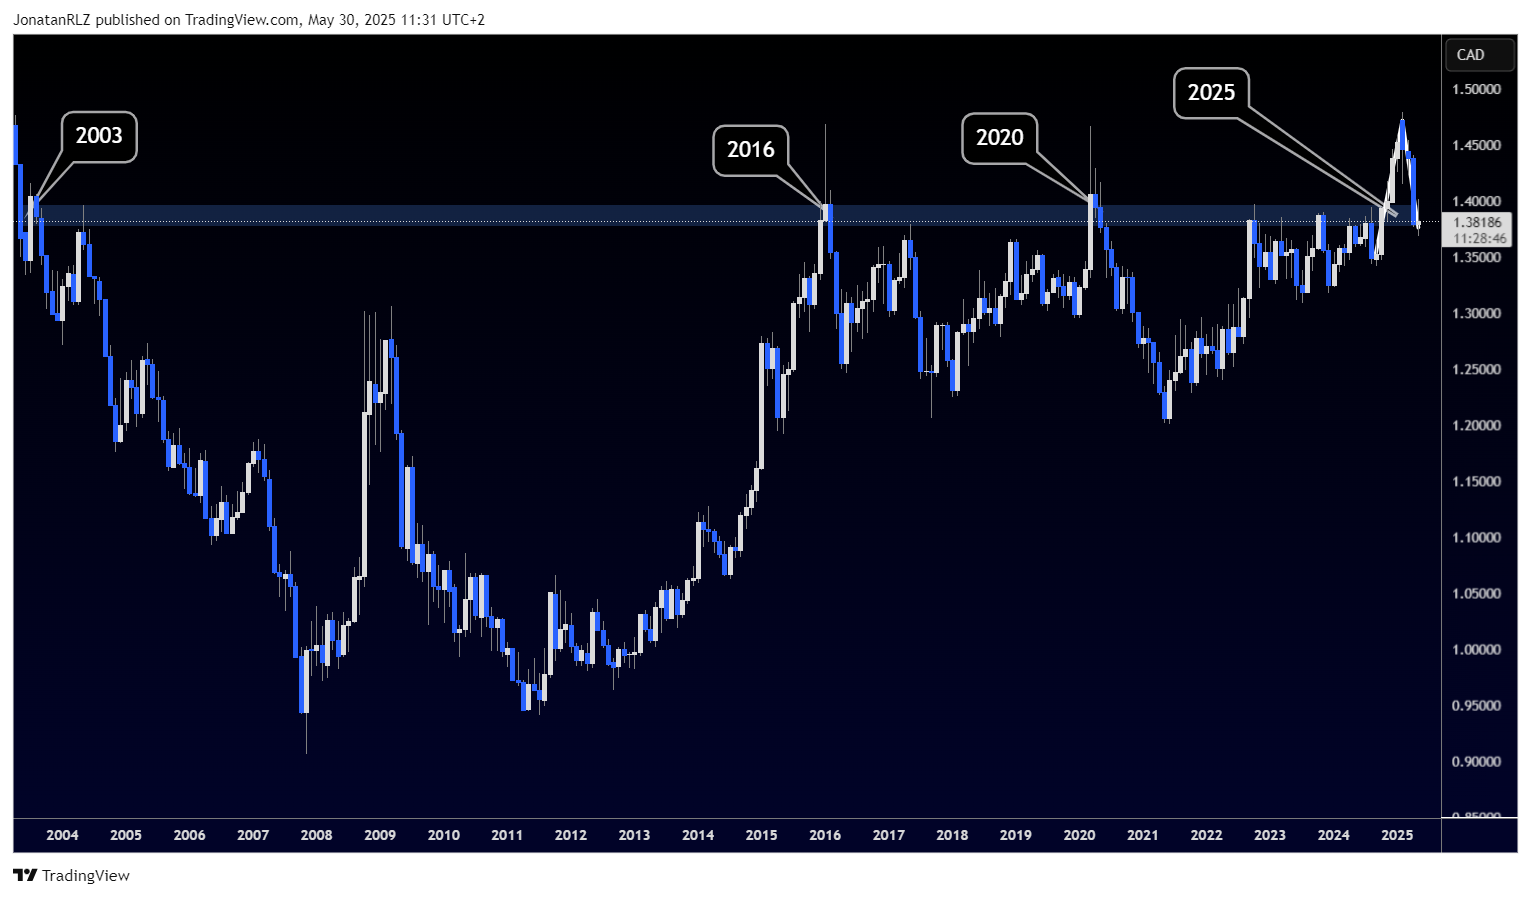
For today’s technical update on USD/CAD, we begin by looking at the monthly time frame. Price has recently broken above the historically significant 1.40 level. This level has acted as resistance for over 20 years, as seen on the chart. Attempts to break above it go back to 2003, with monthly fake outs occurring in 2016 and again in 2020. However, in late 2024 and into 2025, we now have what appears to be a confident breakout above 1.40, followed by a rounded monthly retest of the same level.
This prompts an important question. Historically, when USD/CAD trades above 1.40, it doesn’t stay there long. For mean reversion or contrarian traders, this might suggest that the pair is now expensive and due for a return to its long-term average, potentially over the coming months or even years.
That said, we also need to consider the broader macro context. The fundamental environment has shifted with President Trump’s renewed global tariff policies. This could represent the early stages of a paradigm shift in USD/CAD market dynamics, something that has been discussed by several leading macro analysts, including Howard Marks, who has written extensively on long-term cycles.
From a purely technical perspective, the reaction to this recent breakout is significant. If price can establish support at or around the 1.40 level and then build a bullish structure on the retest, we might be witnessing the early signs of a new long-term cycle for USD/CAD.

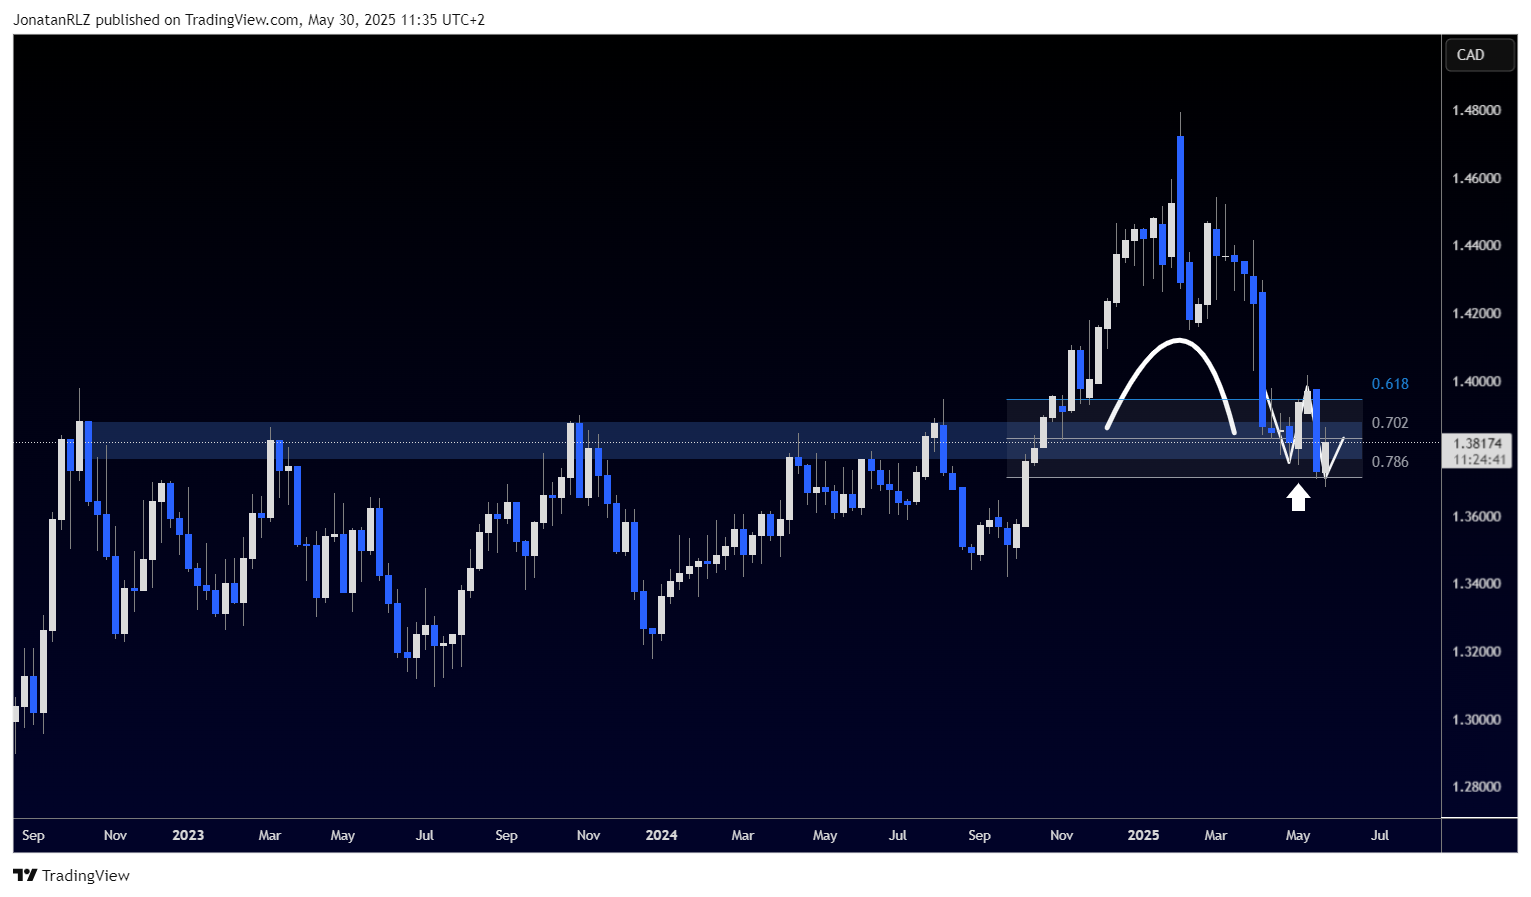
Zooming into the weekly time frame, we can see a very clear support zone, with its midpoint around 1.38270. Price has pulled back into this area in a rounded fashion, creating a retest of the breakout. This support zone also aligns perfectly with the Fibonacci reload zone, with its midpoint sitting right at the centre of support, providing strong confluence.
However, we should also remain cautious. The bullish weekly candle from 5 May, marked by a white up arrow, initially gave a strong reaction. But this was followed by a move lower that created a lower low. This signals that price is still in a bearish structure on the weekly, and for a proper confirmation of strength, we would ideally want to see price reclaim the 0.618 level once again.

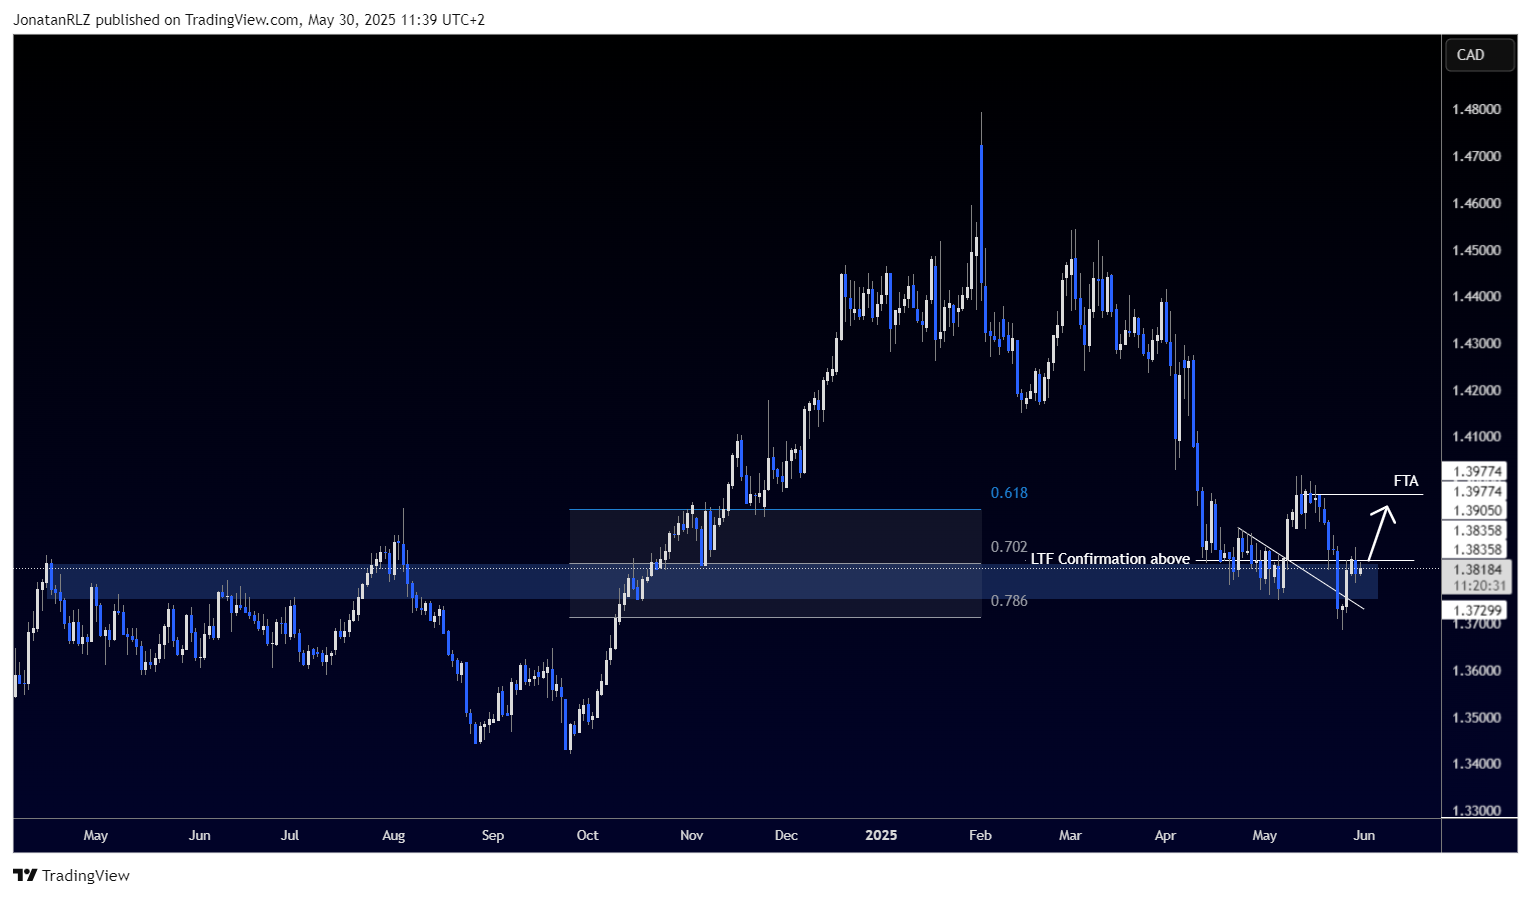
Looking at the daily chart, the support zone becomes even clearer. A key level is marked as “low time frame confirmation above,” aligning with the 0.702 Fibonacci level and the midpoint of the reload zone. We’ve also highlighted the recent swing high at 1.39774 as a first trouble area. If we see a low time frame breakout and a reclaim of the 0.702 level, it could trigger a potential move up towards that first trouble area, where we also find confluence with the 0.618 level.
Ultimately, it is the reclaim of that 0.618 level that would signal true high time frame strength and suggest that USD/CAD might be entering a new cyclical phase. Until then, caution is warranted. The history of this level and the macroeconomic backdrop both warrant close attention in the coming weeks.

Trading involves risk.
The content provided here is for informational purposes only. It is not intended as personal investment advice and does not constitute a solicitation or invitation to engage in any financial transactions, investments, or related activities. Past performance is not a reliable indicator of future results.
The financial products offered by the Company are complex and come with a high risk of losing money rapidly due to leverage. These products may not be suitable for all investors. Before engaging, you should consider whether you understand how these leveraged products work and whether you can afford the high risk of losing your money.
The Company does not accept clients from the Restricted Jurisdictions as indicated in our website/ T&C. Some services or products may not be available in your jurisdiction.
The applicable legal entity and its respective products and services depend on the client’s country of residence and the entity with which the client has established a contractual relationship during registration.


