In today’s technical update, we look at USD/JPY from a high time frame perspective, analysing its cyclical structure and long-term behaviour.
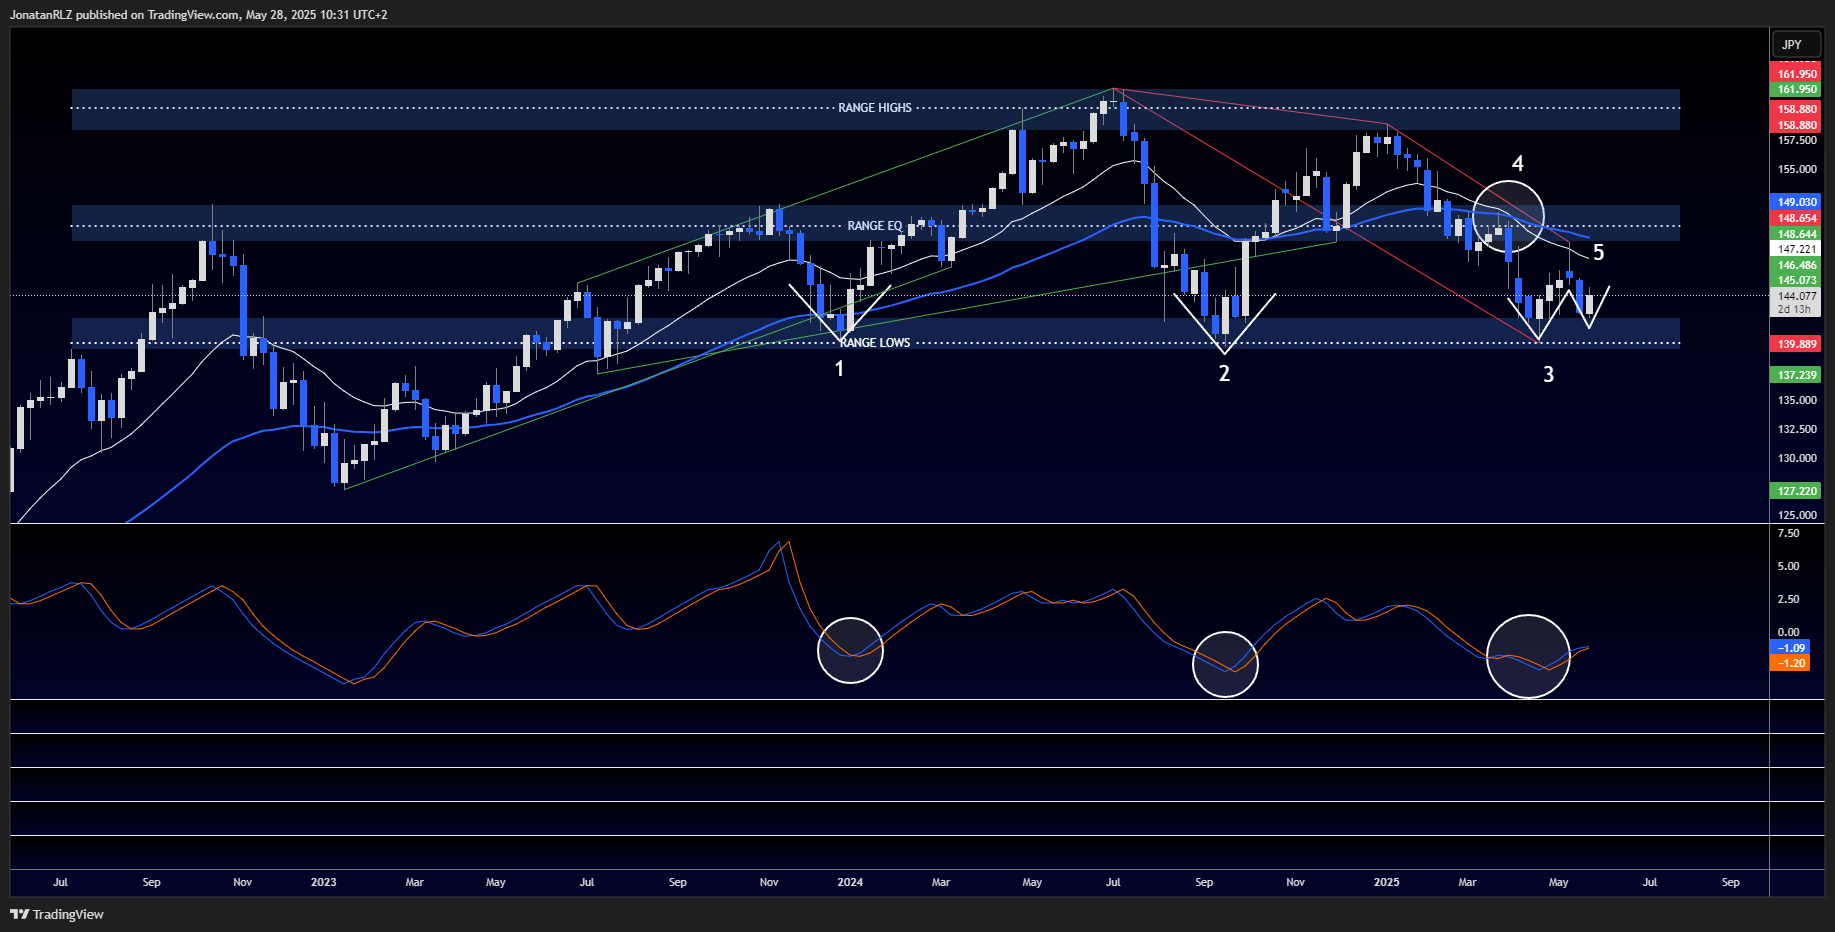
What we are seeing on the weekly chart is that USD/JPY has been in a well-defined long-term uptrend that began in January 2023 and peaked in July 2024. This uptrend is visualised by the green ascending trend line on the chart. Since that peak, however, price has started showing signs of structural change, with a series of lower highs and lower lows beginning to form. The red trend lines mark this potential transition, suggesting that we may be entering a high time frame consolidation, or range.
From a cyclical theory point of view, clear short-term cycles are beginning to emerge within this broader range. To further support this view, we’ve added the Fisher Transform indicator to the bottom of the chart. Each of the major lows in price aligns closely with a major low on the Fisher indicator, particularly when USD/JPY tests the lower boundary of the range.
The first major low, marked as point one, shows a textbook v-shaped recovery and was confirmed by a strong bullish engulfing candle. The second major low, point two, also produced a sharp reversal with a strong weekly close. However, the most recent low, marked as point three, shows a shift in character. The initial bounce off support failed to create the same kind of bullish response. Instead, it produced a more muted reaction, followed by what now appears to be a potential double bottom.
While a double bottom at support can often be viewed as bullish, the context here is important. Unlike the earlier two reversals, this time we see price breaking down from the range EQ and struggling to reclaim that territory. The 20 and 50 weekly EMAs, shown as the white and blue lines on the chart, have now crossed to the downside. This EMA cross occurred shortly after the breakdown from the range EQ and has remained in place ever since, indicating a weakening trend. Price was also rejected at the EMAs following the most recent bounce from support. This pattern is marked as point four and could be interpreted as a bearish retest.
What we are seeing here is not just a failure to regain momentum, but also a potential confirmation of cyclical fatigue. The question now is whether this latest move is just another failed rally, or the early signs of a much larger cycle shift. Given the broader macro backdrop, with trade dynamics shifting and new economic pressures emerging, this could be a pivotal moment for USD/JPY.

Trading involves risk.
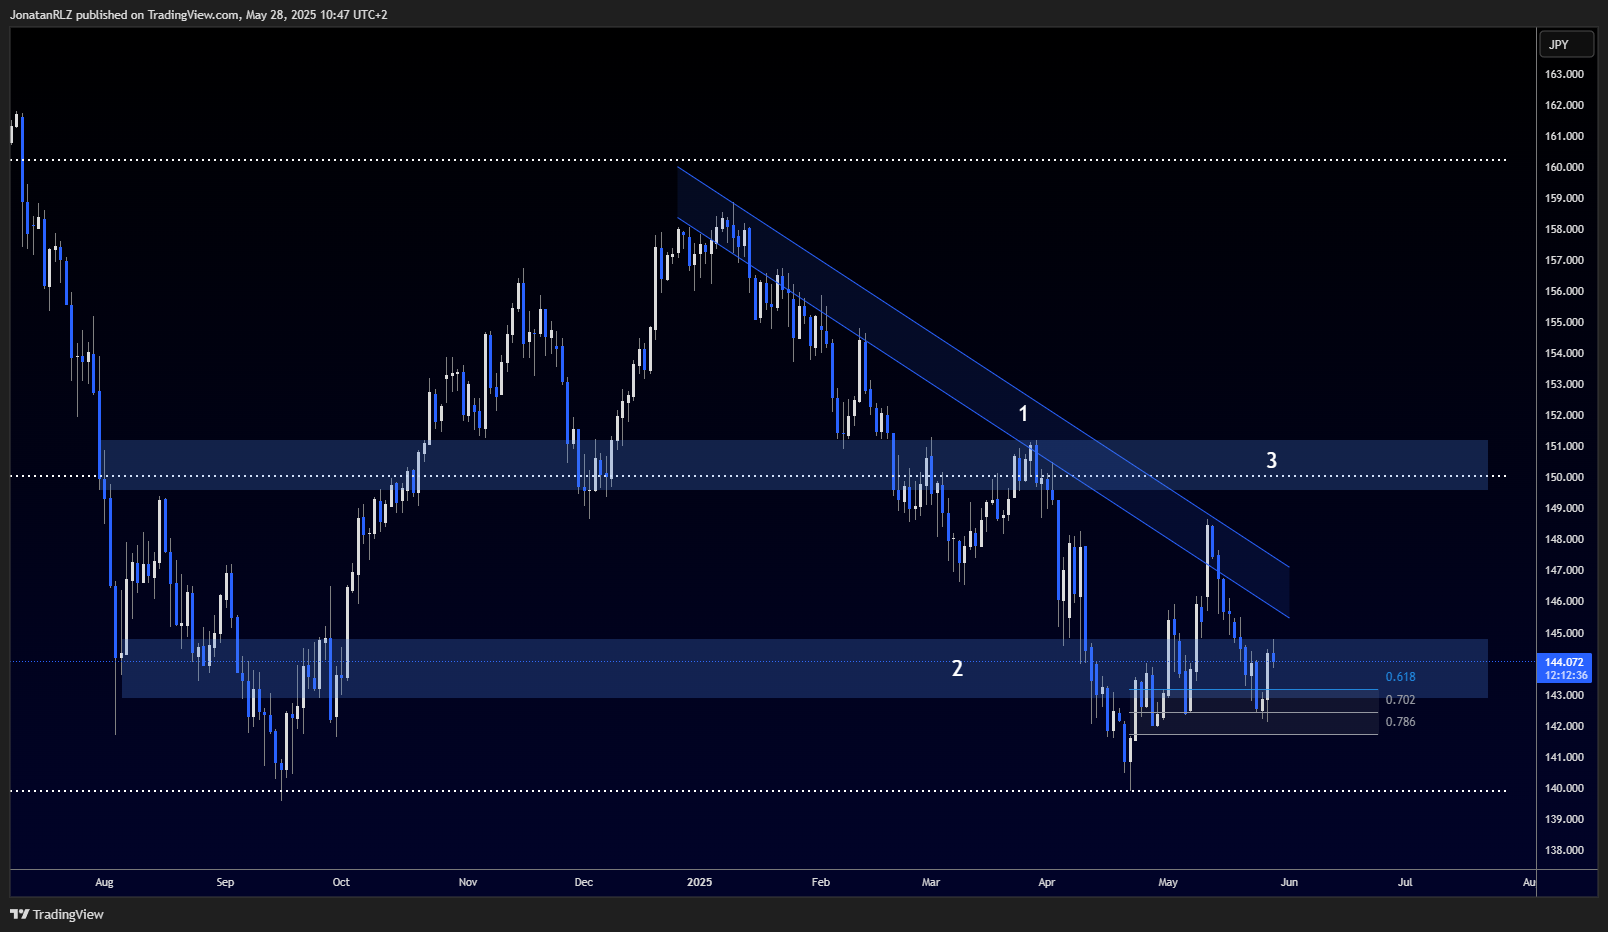
Zooming into the daily chart, we can identify three key technical features. First, a descending trend line marked as number one, second, the current support and resistance zone around 144, marked as number two, and third, the major resistance area near 150.5, marked as number three, which also aligns with the high time frame range EQ shown on the weekly chart.
Price is currently bouncing off the local reload zone, which is the area between the 0.618 and 0.786 Fibonacci retracement levels. This kind of reaction within the reload zone is something we typically want to see if a new trend is forming. The bullish daily candle from yesterday adds confidence to this view, showing signs of local strength despite the broader high time frame uncertainty.
If USD/JPY can reclaim the descending trend line, that would be the first sign of a shift in momentum. However, a more decisive signal would come from breaking above the 150.5 level and reclaiming that high time frame range EQ as support. Of course, by the time that happens, much of the move may already have occurred.

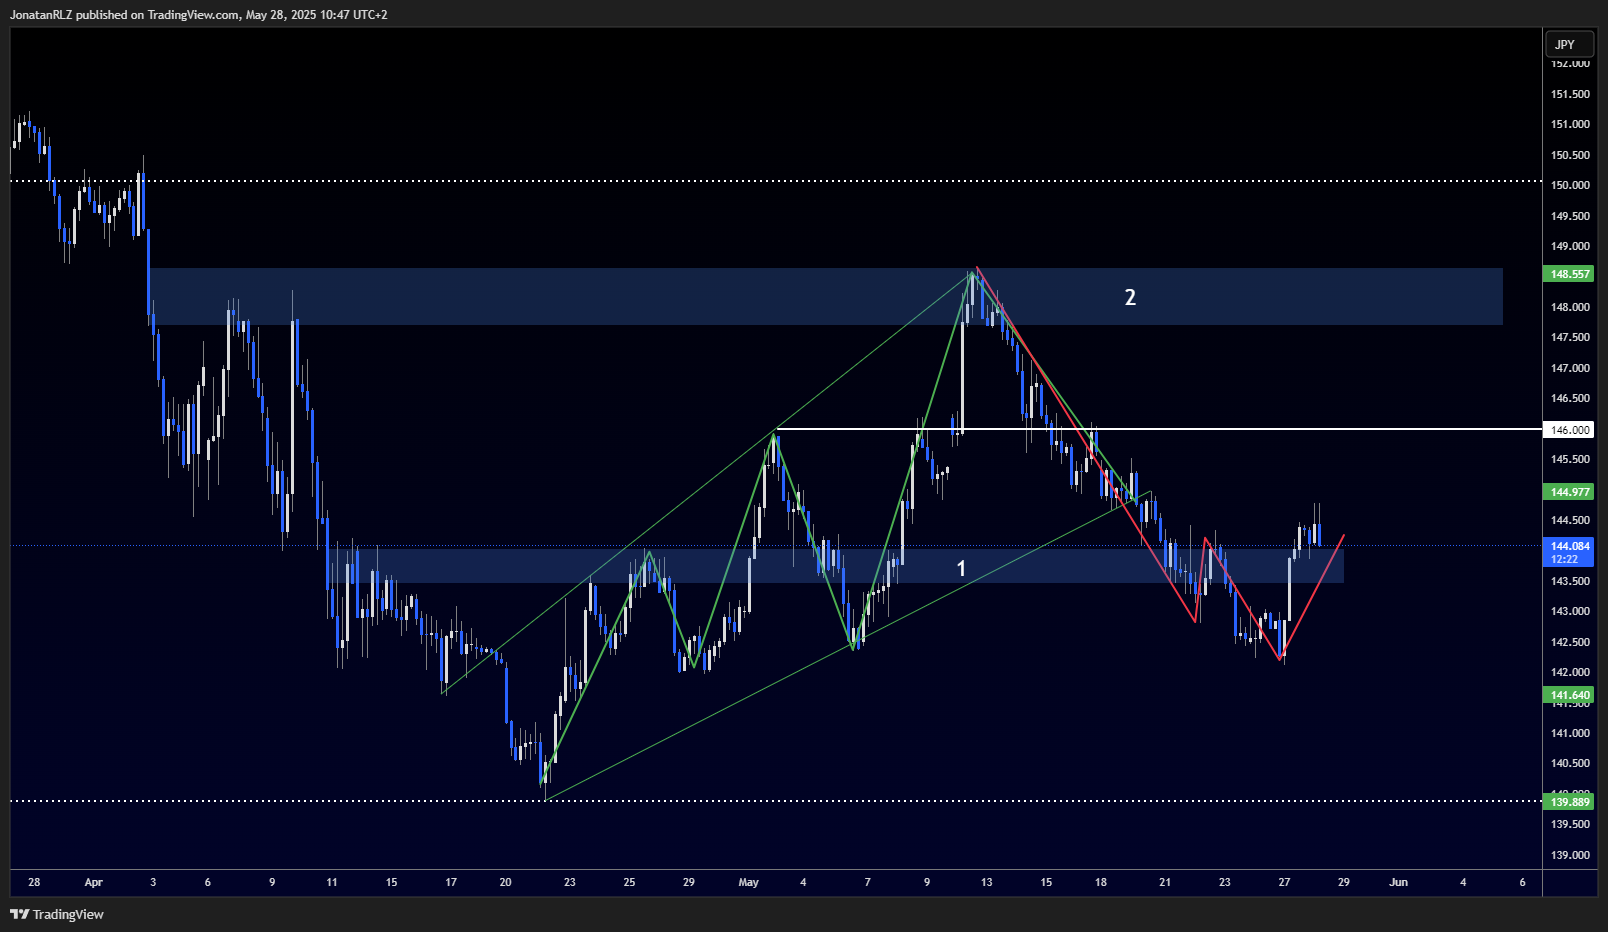
On the four-hour chart, we can observe that the previous uptrend was broken once price fell below the ascending trend line and the support level around 144. Interestingly, price has now reclaimed that level and is attempting to stabilise above it. If it can hold here and build a base, that would support the idea of a bullish continuation.
Right now, the important levels to monitor are 144 as key local support, the 146 area as a local resistance zone, and 148 above as a more significant resistance. USD/JPY remains a pair to watch closely, as its technical structure across time frames presents a compelling setup for both directional plays and risk-managed opportunities.

Trading involves risk.
The content provided here is for informational purposes only. It is not intended as personal investment advice and does not constitute a solicitation or invitation to engage in any financial transactions, investments, or related activities. Past performance is not a reliable indicator of future results.
The financial products offered by the Company are complex and come with a high risk of losing money rapidly due to leverage. These products may not be suitable for all investors. Before engaging, you should consider whether you understand how these leveraged products work and whether you can afford the high risk of losing your money.
The Company does not accept clients from the Restricted Jurisdictions as indicated in our website/ T&C. Some services or products may not be available in your jurisdiction.
The applicable legal entity and its respective products and services depend on the client’s country of residence and the entity with which the client has established a contractual relationship during registration.


