The On-Balance Volume indicator, or OBV for short, uses cumulative volume to measure buying or selling pressure and was developed by respected market analyst Joe Granville in 1963 as among the first indicators to measure volume flow. Granville first introduced the indicator in his book New Key to Stock Market Profits, which was reprinted in 2010.
The On-Balance Volume (OBV) indicator was developed by Granville, who believed that volume could signal an upcoming trend change or significant market movement. It is often called the “smart money indicator” because it reveals the actions of large players in the financial markets before the general public becomes aware of them. Granville’s use of volume as a leading indicator has helped traders to anticipate market movements and make informed decisions.
Read this guide for a full OBV definition to explain what is OBV, the OBV formula for calculation, how to read the On-Balance Volume indicator, and OBV trading strategies.
On-Balance Volume Definition
By definition, the On-Balance Volume ondicator is a momentum indicator that relies on volume flow to measure momentum. Analysts can use the indicator to predict large fluctuations in an asset’s price, by spotting anomalies in the OBV indicator that doesn’t match the price action.
In the 1963 book where the indicator was first introduced, the book’s author and indicator creator, Joe Granville explained the signals the OBV indicator made as a “spring” that would propel the price in one direction or another sharply.
Why The On-Balance Volume Indicator Matters
The indicator’s creator was convinced by the theory that volume precedes price, and created the OBV indicator to signal when volume makes a large jump without moving the price of an asset. This signals that institutional investors and other “smart money” are taking positions ahead of a major crowd sentiment change.
When combined with trendlines, OBV can often predict movements before they occur. The tool can also be used alongside other trading technical analysis indicators such as the 200-day moving average for confirmation of ultra-safe position entries. Combined with the right strategies, a trader can extract even more profit from the market while reducing risk to an absolute minimum.
How the On-Balance Volume Indicator Works
The On-Balance Volume indicator is a cumulative total of volume, positive and negative, displaying the inflow or outflow of money and capital into a stock, forex, or crypto asset. Because volume picks up before the price on stock charts begins to move, it’s considered a leading indicator.
However, because it is a leading indicator, one of the indicator’s greatest limitations is due to the false positives it produces. Traders should always include trend lines or moving averages in combination with the OBV indicator when performing technical analysis for the greatest possible profit potential and risk management. By waiting for these other signals to confirm the OBV indicator signals, it can produce a winning combination.
How the On-Balance Volume Indicator is Calculated
Calculating On-Balance Volume Indicator is done simply by using by adding today’s volume to a cumulative total if the asset’s closing price shows a positive gain, or by subtracting the day’s volume if the asset price closes with a loss.
If the day’s closing price is greater than yesterday’s closing price, then Current OBV = Yesterday’s OBV + Today’s Volume

If the day’s closing price is lesser than yesterday’s closing price, then Current OBV = Yesterday’s OBV - Today’s Volume

If the day’s closing price is equal to yesterday’s closing price, then Current OBV = Yesterday’s OBV
How to Read the On-Balance Volume Indicator
Because On-Balance Volume is a simple line chart that moves up and down positive or negative volume based on an asset’s closing price and doesn’t require any tinkering with settings, it is very easy to get a good read on the indicator.
Price should follow OBV, and any sudden reversals in OBV could suggest that a price trend reversal is near. But because the OBV is considered a leading indicator that gives early signals, it is sometimes wise to wait for confirmation with a trendline break, or another indicator to confirm OBV’s signals.
How to Use the On-Balance Volume Indicator
There are various strategies on how to use the OBV, making it a very versatile tool for traders to create a winning system with.
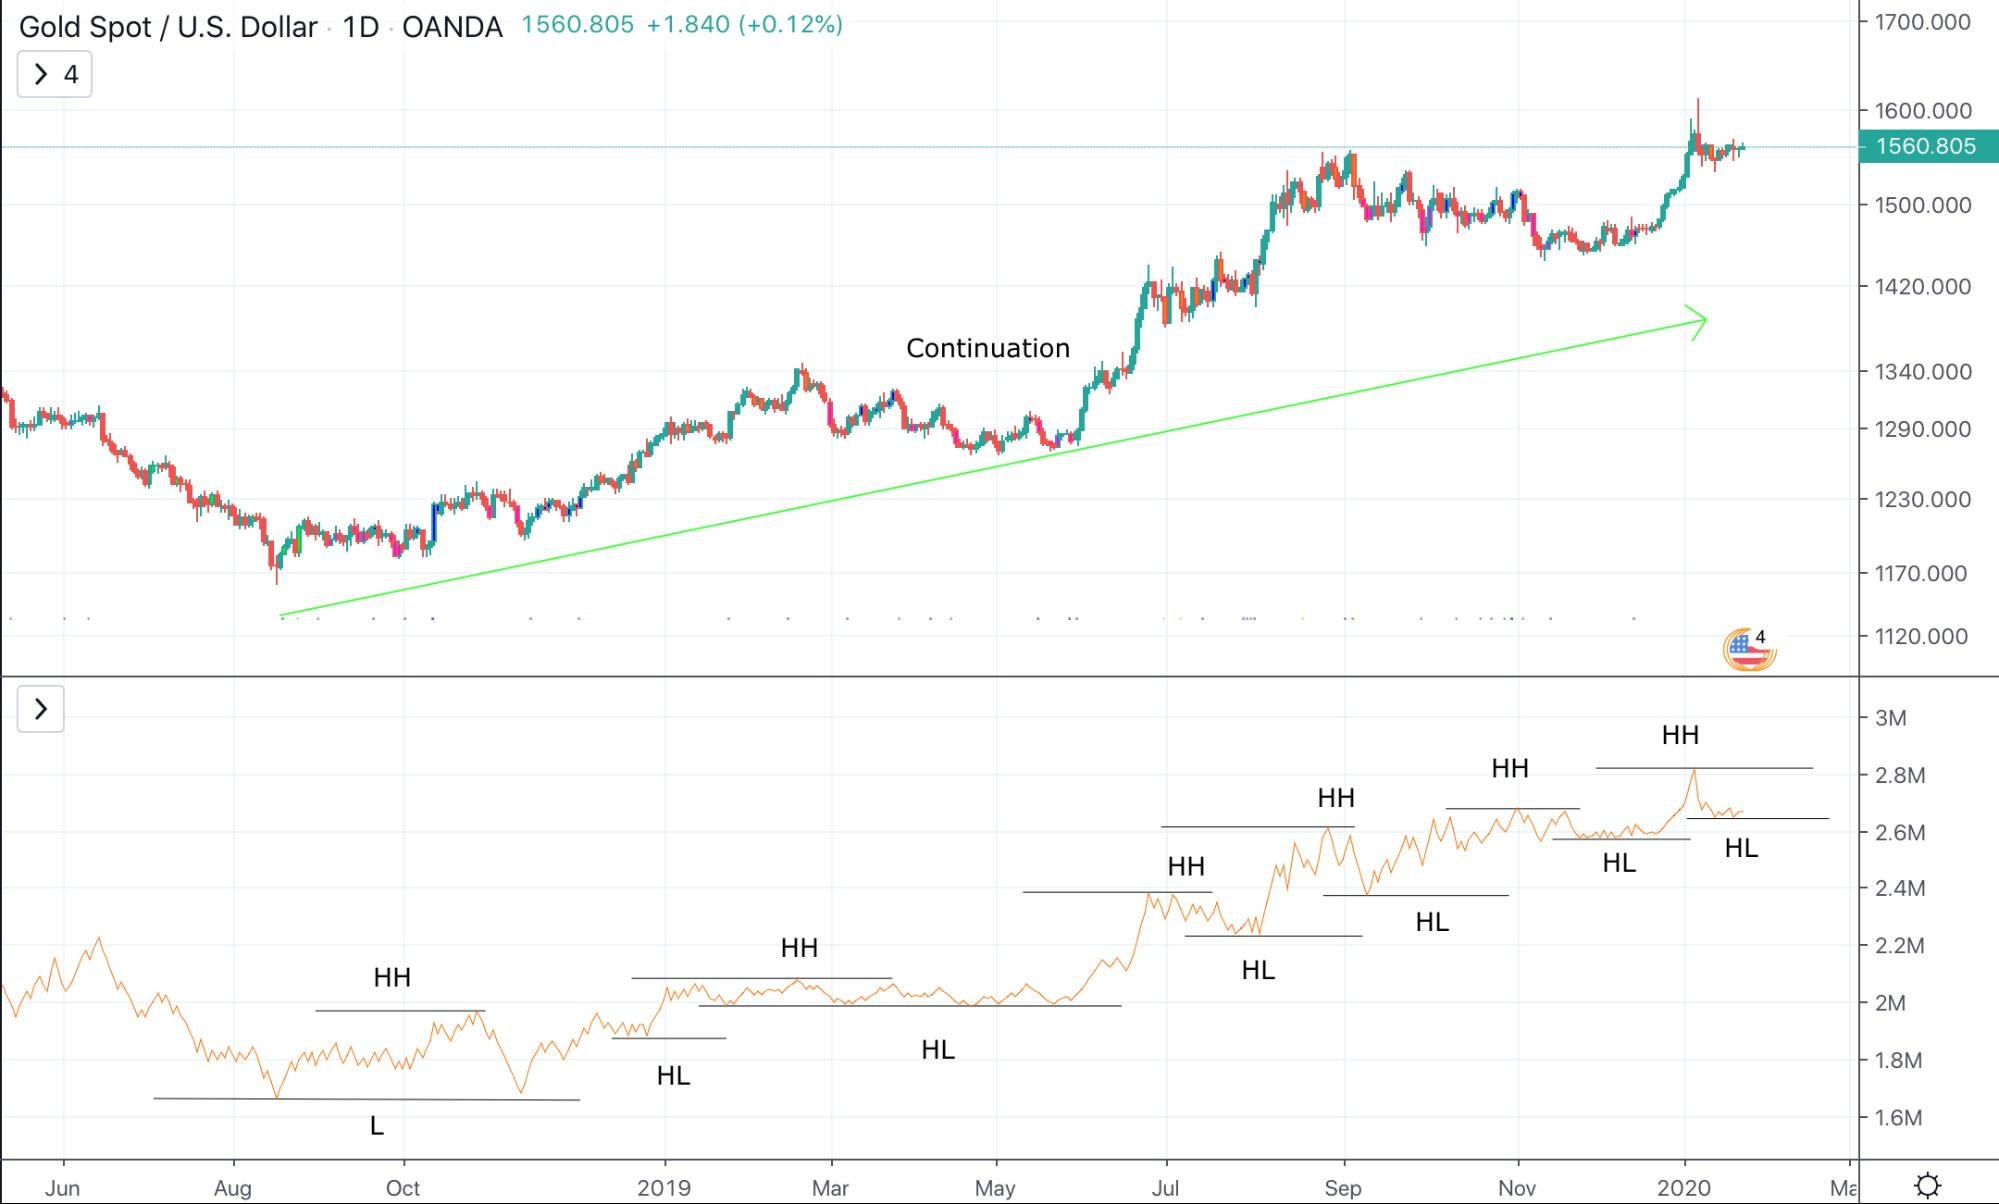
When both price and OBV are making higher highs and higher lows, the asset is in an uptrend that is likely to continue for the foreseeable future. The opposite is true for downtrends.
When assets are trading with a tight range, OBV rising could signal accumulation while OBV falling could signal distribution taking place before a move lower.
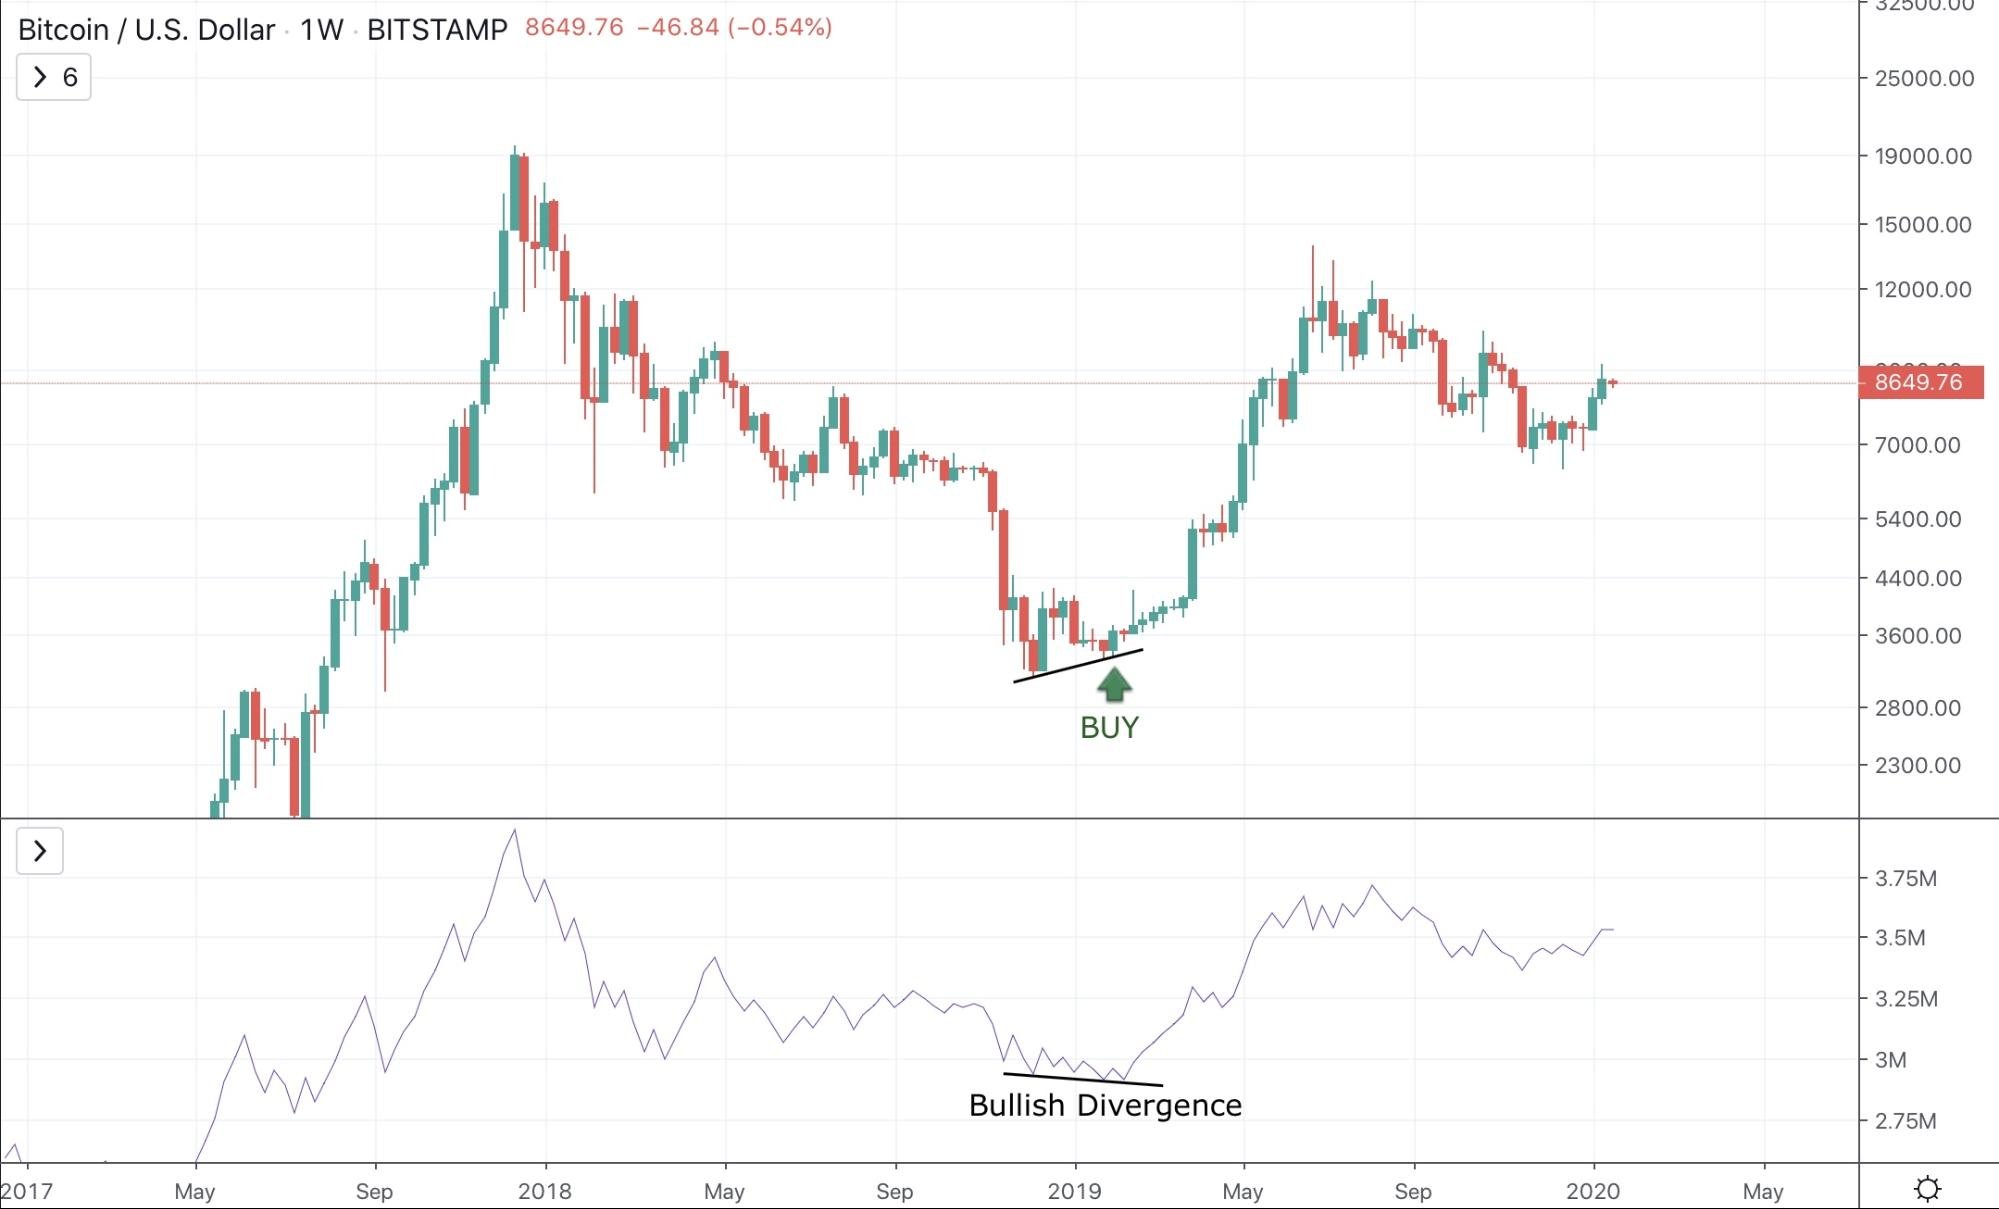
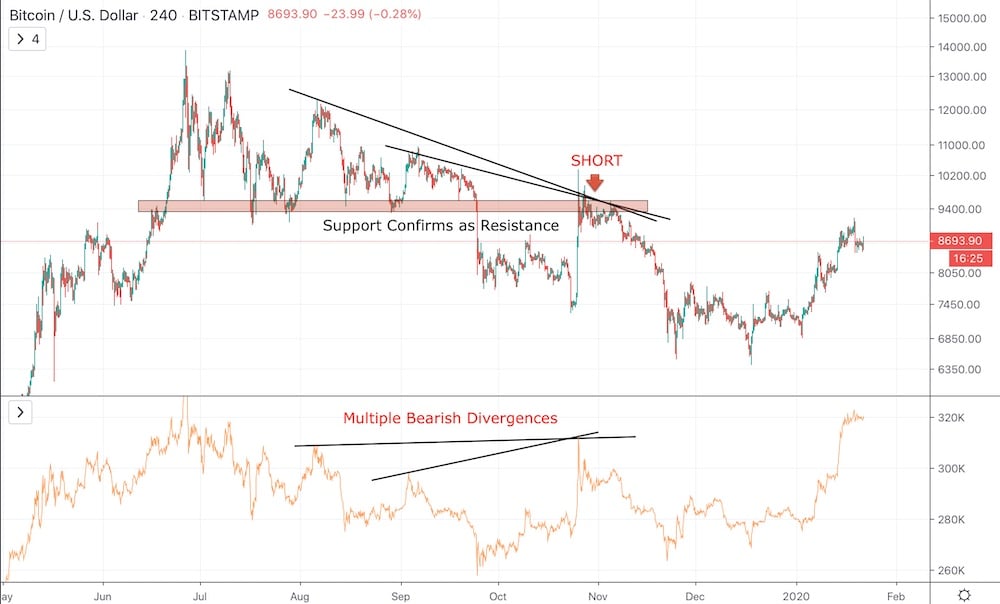
In addition, if the price of an asset continues to make new highs, but OBV falls, it could signal a bearish divergence. If an asset makes new lows, while OBV doesn’t, it’s a bullish divergence and could signal a reversal
The Best On-Balance Volume Indicator Trading Strategies
Unlike many other indicators that included multiple lines crossing, histograms, or range-bound gauges, the OBV indicator is a straightforward tool with nothing more than a single line chart based on volume during a trading period. Thus, with a little practice, the signals it provides can be easy to spot and take action on.
More advanced strategies include combining the indicator with trend lines or moving averages either to get an early position or take a safer, late position with a confirmation signal. However, even the basics are proven to provide consistent profits.
1. Spotting Major Trend Reversals With OBV Bullish Divergences
In the below weekly price chart, a large, multi-month bullish divergence can be seen playing out, with the OBV providing an early signal that a reversal is in the making. A buy order would be placed at the second touch of the trendline. The following trade resulted in an over 300% gain.
2. Gauge Trend Strength and Continuation With Rising OBV
On-Balance Volume can also be used to determine the strength of a trend, and if that trend is likely to continue or not. Traders can watch for a series of higher lows and higher highs, signaling an uptrend is going to continue, or a series of lower lows and higher lows would signal a downtrend has more to go. Waiting for a break in the sequence of highs or lows will signal the trend is about to end. In the sample provided, a series of higher highs and higher lows after a low is put in suggest the uptrend is strong, and until a lower high or lower low is put in, the trend will remain in tact.
3. Confirming Bearish Retests of Resistance With Multiple Bearish Divergences
When the OBV provides more than one bearish divergence, the signal is exceptionally strong. In this example, OBV can be seen signaling not one but two bearish divergences. Even though the rally was extremely powerful and set records for the asset’s largest single-day gain on record, it couldn’t break through resistance and acted as a bearish retest and confirmation of support turned resistance. A trader would open a short position when price touches the bearish resistance line.
4. Trading Early Trend Reversals With OBV Trendline Breakouts
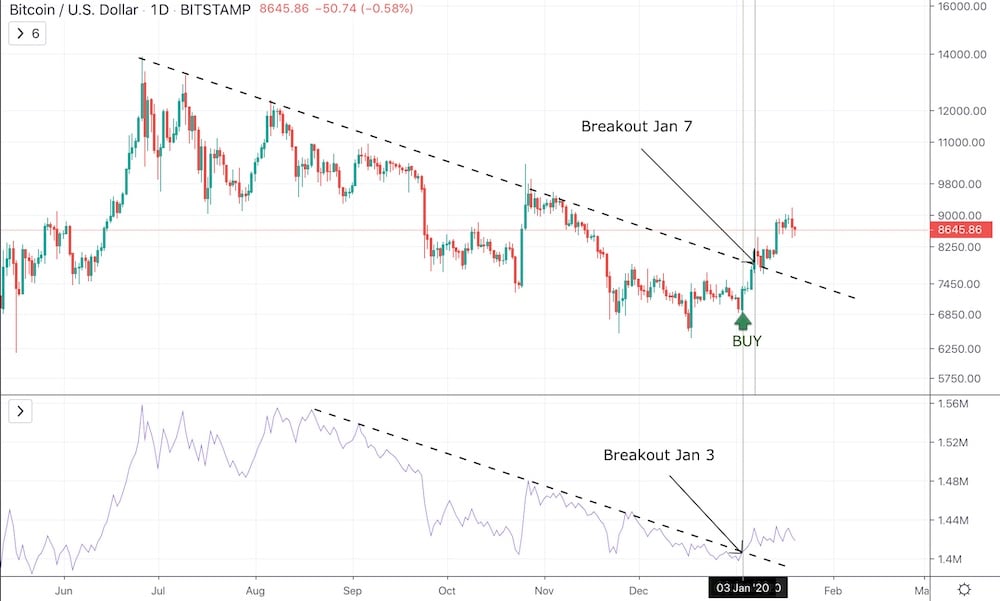
The OBV indicator is called the “smart money” indicator because it can tip a trader off as to larger players taking early positions in markets, ahead of major trend changes or breakouts. These moves can be spotted on the OBV indicator, sometimes days before they occur. When price finally breaches a trendline, a trader will take it as confirmation of the OBV signal, and enter a trade based on the direction of the breakout. In the supplied example, the breakout can be seen on the OBV chart days before the asset’s price responded to they buy pressure. In the supplied example, a multi-month trendline can be seen breaking on the OBV indicator chart days prior to price candles reacting and pushing the price of the asset through the accompanying price chart trendline. The result was a strong move higher, resulting in over 25% returns.
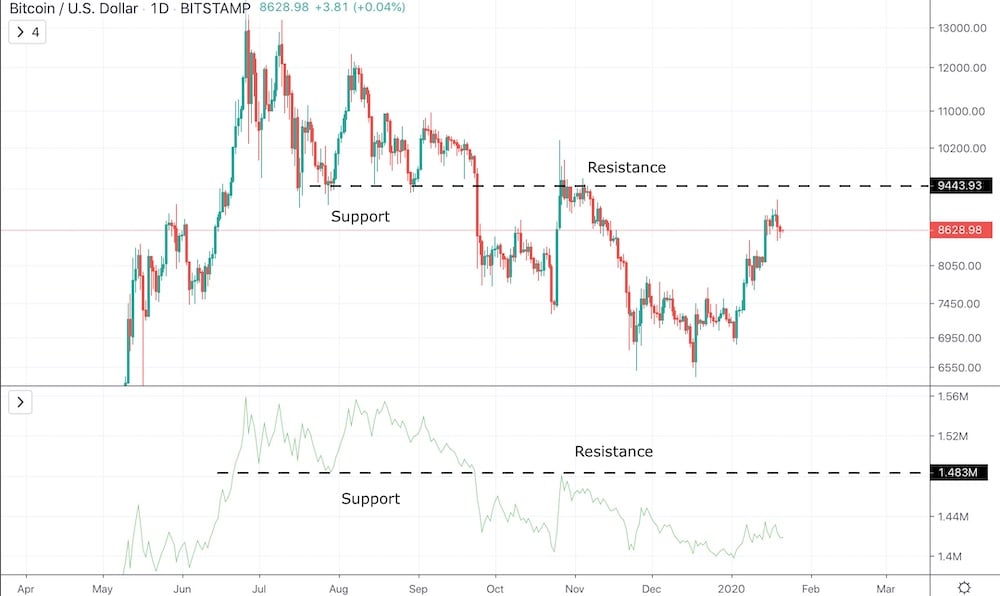
5. Plotting Support and Resistance Lines With OBV
Many tools can be used to discover and plot lines of support and resistance, and the OBV indicator is no different. The indicator responds to levels of support and resistance sooner than price does, helping traders better understand where to place entry and exits.
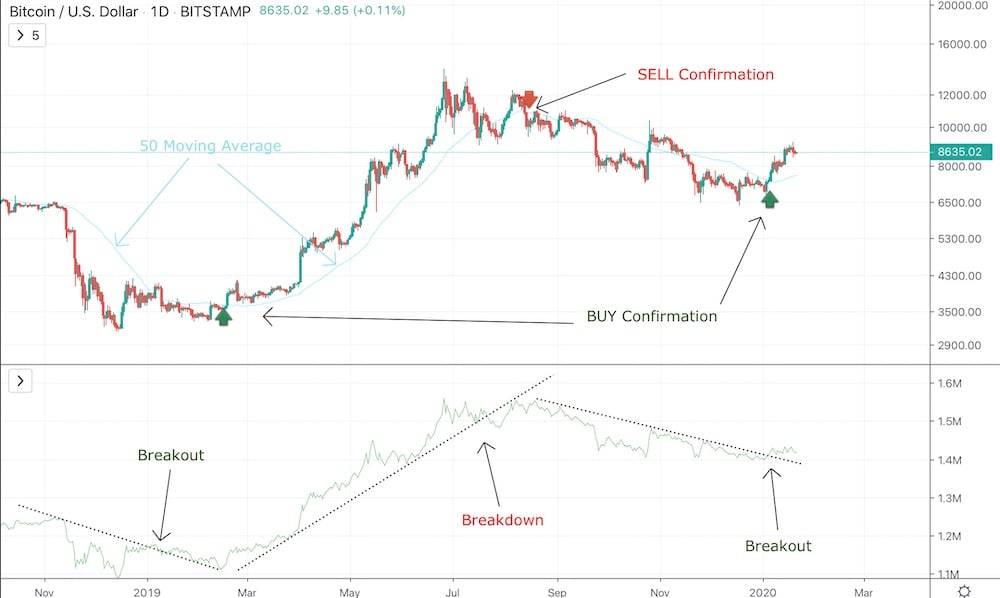
6. Safe Trade Entries By Combining With Moving Averages For Confirmation
Because the OBV indicator is considered a leading indicator, it can lead to false signals. For traders that want to get the early signals that the OBV indicator provides, but prefer to play it safe and wait for confirmation, traders can combine the tool with various moving averages. In the supplied example, a trader would spot a signal on OBV but would wait for a break of the 50-day moving average before actually taking a position.
Tips for Traders and Common Mistakes
While some indicators such as the MACD are considered lagging indicators, the On-Balance Volume indicator is considered a leading indicator. Although it can supply traders with early signals to take action on, it occasionally will give false readings that can lead to losses.
Combining the OBV indicator with other forms of technical analysis, such as trend lines or moving averages, or even other indicators, can help to confirm the early signals the OBV indicator provides.
Conclusion
Now that you fully understand what is On-Balance Volume and get the full OBV meaning, it’s time to put your new-found skills into action.
The On-Balance Volume indicator is just one of many of the helpful studies and indicators that are included within PrimeXBT’s built-in charting software.
In addition to offering traders charting tools and the industry’s top indicators, PrimeXBT also features a plethora of additional trading tools, a wide variety of assets including forex, crypto, stock indices, commodities and more, and tons of helpful tutorials to educate traders on how to become profitable.
By putting these trading strategies into regular practice and using up to 1000x leverage, PrimeXBT can help a trader to grow their profits and minimize risk.
Try a free demo account today, or register for a free trading account. Also, be sure to check out the many additional tutorials and tips available on the PrimeXBT website.
The content provided here is for informational purposes only. It is not intended as personal investment advice and does not constitute a solicitation or invitation to engage in any financial transactions, investments, or related activities. Past performance is not a reliable indicator of future results.
The financial products offered by the Company are complex and come with a high risk of losing money rapidly due to leverage. These products may not be suitable for all investors. Before engaging, you should consider whether you understand how these leveraged products work and whether you can afford the high risk of losing your money.
The Company does not accept clients from the Restricted Jurisdictions as indicated in our website/ T&C. Some services or products may not be available in your jurisdiction.
The applicable legal entity and its respective products and services depend on the client’s country of residence and the entity with which the client has established a contractual relationship during registration.


