The Aroon indicator is a powerful tool for traders seeking to identify trends in the market. This technical analysis indicator, developed by Tushar Chande in 1995, helps visualise the presence and strength of trends by referencing a price’s highs and lows.
The name “Aroon” itself draws inspiration from the Sanskrit term for “Dawn’s Early Light,” reflecting the indicator’s ability to potentially signal the beginning of a new trend.
Key takeaways
- Understand how the Aroon indicator identifies trends in asset prices.
- Learn to interpret the signals generated by the Aroon up and Aroon down lines.
- Discover how to use the Aroon indicator in conjunction with other analysis tools for a more comprehensive trading strategy.
What is the Aroon indicator?
The Aroon indicator comprises two indicator lines: Aroon up and Aroon down. These two indicators work in tandem to depict trend direction and strength. Each line is calculated based on a chosen number of periods, typically set at 14 days but adjustable according to the trader’s preference.
The Aroon up value reflects the number of periods since the price recorded a new high, while the down line indicates the number of periods since the price saw a new low.
How does the Aroon indicator work?
The Aroon indicator works by measuring the number of days since a price’s most recent high or low within a defined time period. By analysing how recent these highs and lows occurred, traders can identify price action and emerging trends to assess their strength.
How to calculate Aroon indicators
To calculate the Aroon up and down lines, you can follow a step-by-step process using each Aroon indicator formula below:
Aroon up formulaAroon up = ((Number of periods – Periods since the highest high) / Number of periods) x 100
Aroon down formulaAroon down = ((Number of periods – Periods since the lowest low) / Number of periods) x 100
Example calculation
Suppose we are using a 25-day period. For the Aroon up line, if the last high occurred 10 days ago, the calculation would be:
Aroon up = ((25 – 10) / 25) x 100 = 60%
For the Aroon down line, if the last low occurred 5 days ago, the calculation would be:
Aroon down = ((25 – 5) / 25) x 100 = 80%
Interpreting the Aroon indicators
Interpreting the Aroon indicators involves understanding the behaviour and interaction of the Aroon up and down lines. Both lines range from 0 to 100, representing the percentage of time that has passed since the last high or low within a specified number of periods.
Aroon up line interpretation
Higher values, closer to 100%, suggest a strong trend uptrend because they indicate that a new high was recently achieved. On the other hand, lower values, closer to 0%, imply that the price hasn’t reached a new high for a long time, hinting at a potential weakness in the uptrend.
Aroon down line interpretation
Lower values, closer to 0%, signify that a new low hasn’t been registered for a while, indicating weakness in a downtrend. Conversely, higher values, approaching 100%, suggest a strong downtrend since they reveal that a recent low was recorded.
Significance of different levels
- 0% implies that the price hasn’t achieved a new high (Aroon up) or low (Aroon down) for an extended period.
- 50% suggests a moderate trend, where the price is achieving highs or lows with medium frequency.
- 100% indicates that a new high (Aroon up) or low (Aroon down) has recently occurred, signalling a strong trend.
Interpreting these levels alongside crossovers provides traders with insights into trend direction, strength, and potential trend reversals. However, it is essential to note that the Aroon indicator is a lagging indicator and should be used with other technical analysis tools to confirm signals.
How to trade with the Aroon indicator
The Aroon indicator is a versatile tool that traders can use to identify new trends and ranging markets, and anticipate potential breakouts or moves in the opposite direction. By understanding the patterns and trade signals given by the up and down indicators, traders can make more informed trading decisions.
Identifying new trends
When the Aroon up line crosses above the Aroon down line, it forms a bullish crossover, signalling a possible shift from a downtrend to an uptrend. This bullish trend is stronger if the Aroon up line continues to stay above the down line.
Alternatively, a bearish crossover occurs when the Aroon down line rises above the Aroon up line, signalling a potential move from an uptrend to a downtrend. The trend is considered stronger if the Aroon Down line remains above the up line.
The Aroon oscillator is a derivative tool that measures the number or the difference between the up and down values, oscillating between +100 and -100. The oscillator offers additional insight into market conditions:
- Closer to +100 indicates a strong uptrend.
- Closer to -100 suggests a strong downtrend.
- Near zero line signals a weak trend or consolidation, where the market lacks clear directional bias.
Recognising consolidations and breakouts
Price consolidation: the chart shows both up and down lines remain low.
Breakout potential: a sudden surge in either direction signifies a possible breakout.
Combining Aroon with other indicators
To enhance the accuracy of trading signals and reduce the likelihood of false signals, it’s beneficial to combine the Aroon indicator with other technical indicators. Here are a few complementary tools that can strengthen trading strategies when used alongside the Aroon indicator.
Moving averages are widely used technical indicators that smooth out price action and help traders identify the direction of a trend.
For instance, if the Aroon up indicator crosses above the Aroon down indicator while the price remains above a rising 50-day moving average, this combination could indicate a strong trend uptrend.
MACD (Moving Average Convergence Divergence)
The MACD is a momentum indicator that measures the difference between two moving averages. It can help confirm bullish and bearish trends signalled by the Aroon indicator:
- Bullish signal: if the MACD line crosses above the signal line, it aligns with a bullish crossover between the Aroon up and Aroon down lines.
- Bearish signal: conversely, when the MACD line crosses below the signal line, it complements a bearish crossover in the Aroon lines.
Relative Strength Index (RSI)
The RSI is a momentum oscillator that ranges from 0 to 100, revealing overbought or oversold conditions:
- Overbought (above 70): signals potential bearish reversal and aligns with a rising Aroon Down line.
- Oversold (below 30): indicates potential bullish reversal, confirming a rising Aroon Up line.
Combining these technical indicators can provide a clearer understanding of the market’s trend direction, momentum, and potential trade signals. However, it’s crucial to practise proper risk management and understand the strengths and limitations of each tool to make informed trading decisions.
Practical examples of the Aroon indicator in use
Understanding the theory behind the Aroon indicator is essential, but its true value lies in practical application. Here, we’ll explore how to leverage the Aroon technical indicator in real-world trading scenarios.
Setting up the Aroon indicator
Most trading platforms such as PrimeXBT offer built-in technical indicators, including the Aroon indicator. The setup process is straightforward:
- Navigate to the indicator selection menu within your trading platform. This menu might be labelled “Indicators”.
- Search for “Aroon indicator”.
- Select the indicator and choosing the desired number of periods (often defaulted to 14).
- The Aroon indicator will then be displayed on your chart, typically below the price bars.
Interpreting Aroon lines and signals

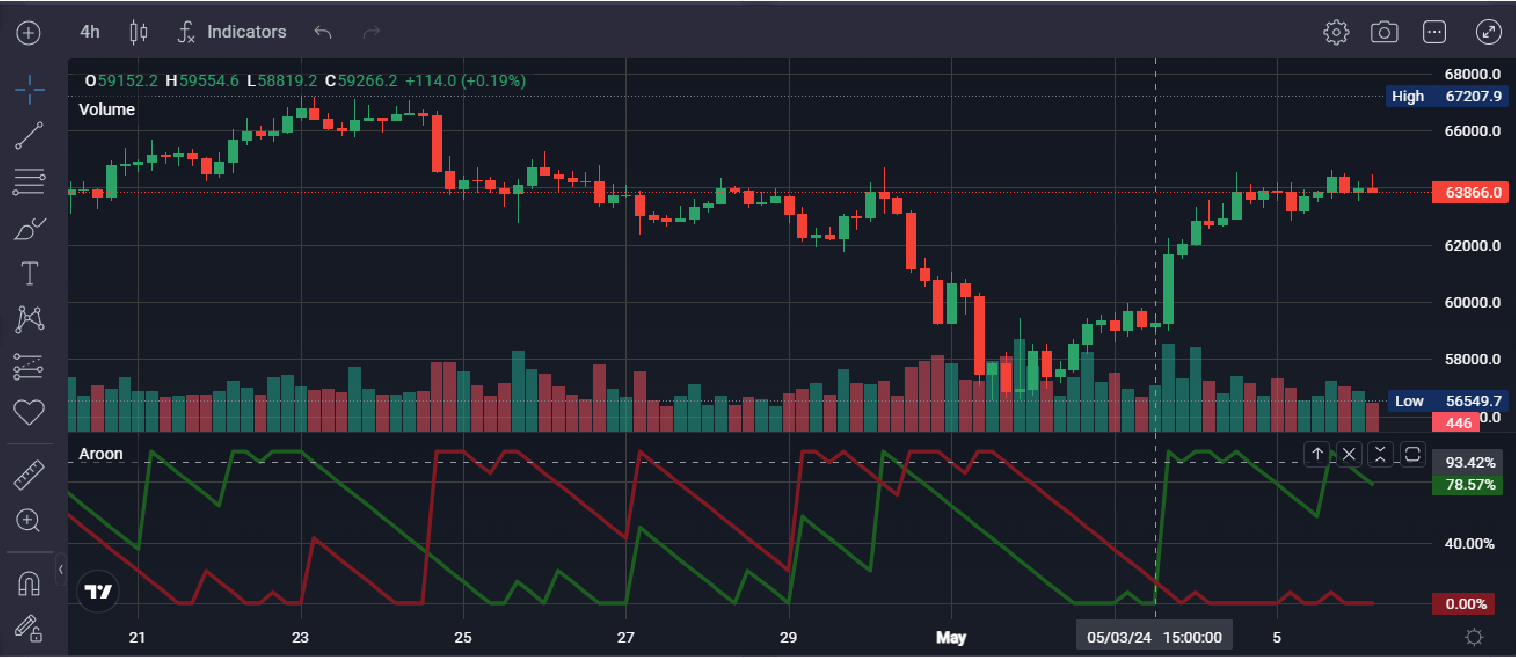
For this section, we’ll reference the image above of a BTC/USDT chart from PrimeXBT’s Crypto Futures platform, with the Aroon indicator displayed at the bottom.
As a reminder, the Aroon indicator uses two indicators: Aroon up (green) and Aroon down (red), with values ranging from 0 to 100.
Let’s analyse the chart section spanning from 21 April to 5 May 2024. During this period:
- The Aroon down indicator (red) remains consistently above the Aroon up indicator (green) for a significant portion of the timeframe. This suggests a potential bearish trend in the market.
- On 3 May, notice the crossover point marked by the dotted line. Here, the Aroon up line (green) intersects above the Aroon down line (red). These line crossovers can be interpreted as a potential confirmation of an uptrend or a sign of strengthening bullish momentum, although it’s important to remember that the Aroon indicator is lagging.
Using the Aroon indicator with trading strategies
In the example above, the sustained high values on the Aroon down indicator throughout most of the timeframe could have aligned with a short trade strategy for some traders, capitalising on the potential downtrend. The crossover on 3 May might have further signalled a trend reversal and a move to a long trade position, suggesting bullish momentum.
Limitations and considerations
The Aroon Indicator offers valuable insights for traders, but it’s essential to understand its strengths and weaknesses. Here’s a table summarising the key advantages and disadvantages of Aroon:
| Feature | Advantage | Disadvantage |
| Ease of use | Straightforward calculation and interpretation of indicator lines. | A lagging indicator which reacts to past price movements, potentially missing the initial stages of a trend. |
| Trend identification | Signals potential trend changes through crossovers and line positioning. | Emphasises the time elapsed since the last high/low, not the magnitude of price movement, and may miss trends with volatile price swings. |
| Timeframe flexibility | Adaptable to different trading styles by adjusting the number of periods. | Can generate false signals, especially in choppy or ranging markets. |
Customising the Aroon indicator

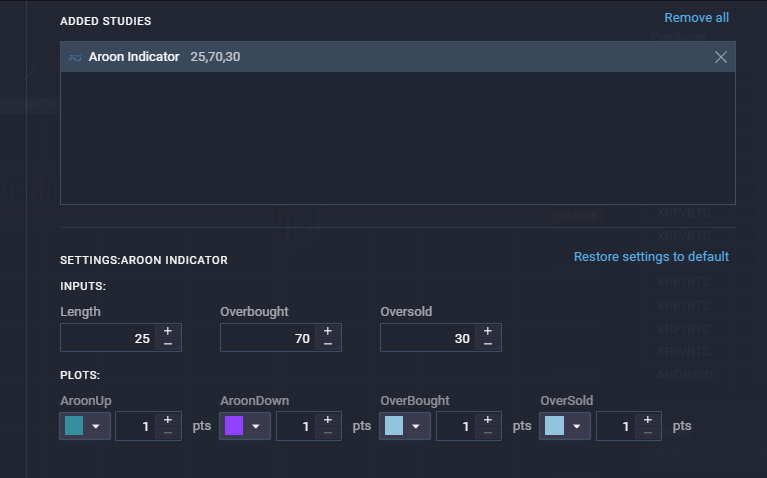
Traders can customise the Aroon indicator’s settings to better align with their trading style and the specific asset they are trading. Adjusting parameters such as period length, overbought, and oversold levels allows for improved accuracy and adaptability.
The length represents the number of periods used to calculate the Aroon indicator signals. Traders can modify it to suit their strategy and risk tolerance:
- Shorter lengths (e.g. 14 periods) increase sensitivity and may signal trends more quickly, suitable for short-term traders.
- Longer lengths (e.g. 50 periods) smooth out the data and are ideal for longer-term trend analysis.
Conclusion
The Aroon Indicator has carved a niche for itself within the technical analysis community. Its core strength lies in its ability to identify trends and signal potential trend reversals through the Aroon up and down lines. By analysing what the Aroon indicator shows, traders can gain valuable insights into the prevailing market sentiment and make informed decisions.
What does the Aroon indicator do?
The Aroon indicator is a technical analysis tool that helps identify trends and potential trend reversals. It uses two lines (Aroon up and Aroon down) to show how many periods ago the price reached a new high (Up) or low (Down).
How accurate is the Aroon indicator?
The Aroon indicator is not a perfect predictor of future prices. It's a lagging indicator, meaning it reacts to past price movements. However, it can provide valuable insights to identify underlying trend strength and potential trend changes when used with other technical analysis tools.
What is the difference between RSI and Aroon indicator?
The RSI (Relative Strength Index) measures the momentum of price movements, indicating if an asset is overbought or oversold. The Aroon indicator focuses on the number of days since the last high/low, highlighting potential trends and reversals.
What is the difference between MACD and Aroon?
MACD (Moving Average Convergence Divergence) is a trend-following indicator that uses moving averages to identify potential trend changes. The Aroon indicator uses a simpler approach with two lines to show how recent the highs and lows are.
What is the best period for the Aroon indicator?
There's no single "best" period. The chosen timeframe of popular trading strategies is often 14 days, but this depends on your trading style and the asset's volatility. Experimenting with different periods can help you find what works best for your strategy.
The content provided here is for informational purposes only. It is not intended as personal investment advice and does not constitute a solicitation or invitation to engage in any financial transactions, investments, or related activities. Past performance is not a reliable indicator of future results.
The financial products offered by the Company are complex and come with a high risk of losing money rapidly due to leverage. These products may not be suitable for all investors. Before engaging, you should consider whether you understand how these leveraged products work and whether you can afford the high risk of losing your money.
The Company does not accept clients from the Restricted Jurisdictions as indicated in our website/ T&C. Some services or products may not be available in your jurisdiction.
The applicable legal entity and its respective products and services depend on the client’s country of residence and the entity with which the client has established a contractual relationship during registration.


