Even if you’ve been trading for a short amount of time, you’ve most likely came across the terms – bullish, bearish and candlesticks.
If you are unfamiliar, candlestick patterns are used by investors and traders to interpret market conditions, including market sentiment, momentum, and volume. Candlesticks on their own show traders and investors the opening price, the closing price, and the time period’s highs and lows.
Technical analysis that uses these candlestick patterns to predict future price movements assumes that certain patterns and the outcome after these patterns repeat. If you recognize them and know the outcome after they occur, then you can position yourself to place a beneficial trade or protect your already open positions.
In this article, we will look at a specific type of candlestick patterns – called bullish candlestick patterns that, as the name implies, forecasts a positive, upward or bullish price movement.
What is a Bullish Candlestick Pattern?
Bullish candlestick patterns usually signal a price increase of the asset being charted. The reasoning behind these patterns is that first candlesticks can show market sentiment. A long candlestick, for example, shows strong buying pressure or selling pressure depending on the color of the candlestick. Long wicks often show that at one point during the timeframe you are looking at, buying pressure overpowered selling pressure or vice versa.
Using all of these data points, you can see various patterns emerge, which can help you speculate the next movement. Obviously, if selling pressure ‘wins’ the price will drop, but if buying pressure ‘wins’, as it does when you see bullish candlestick patterns, then the price will move up.
There are various types of bullish candlestick patterns which we will explore in-depth in the next section. We will see their characteristics, when they start to emerge, your potential entry point, and when to exit the trade.
The benefit of these patterns is that they are easy to recognize at a glance and allow you to act quickly.
Types of Bullish Candlestick Patterns
Although there is an entire library of candlestick patterns, we have compiled a useful list of the most popular and frequently used ones.
1. The Hammer or the Inverted Hammer
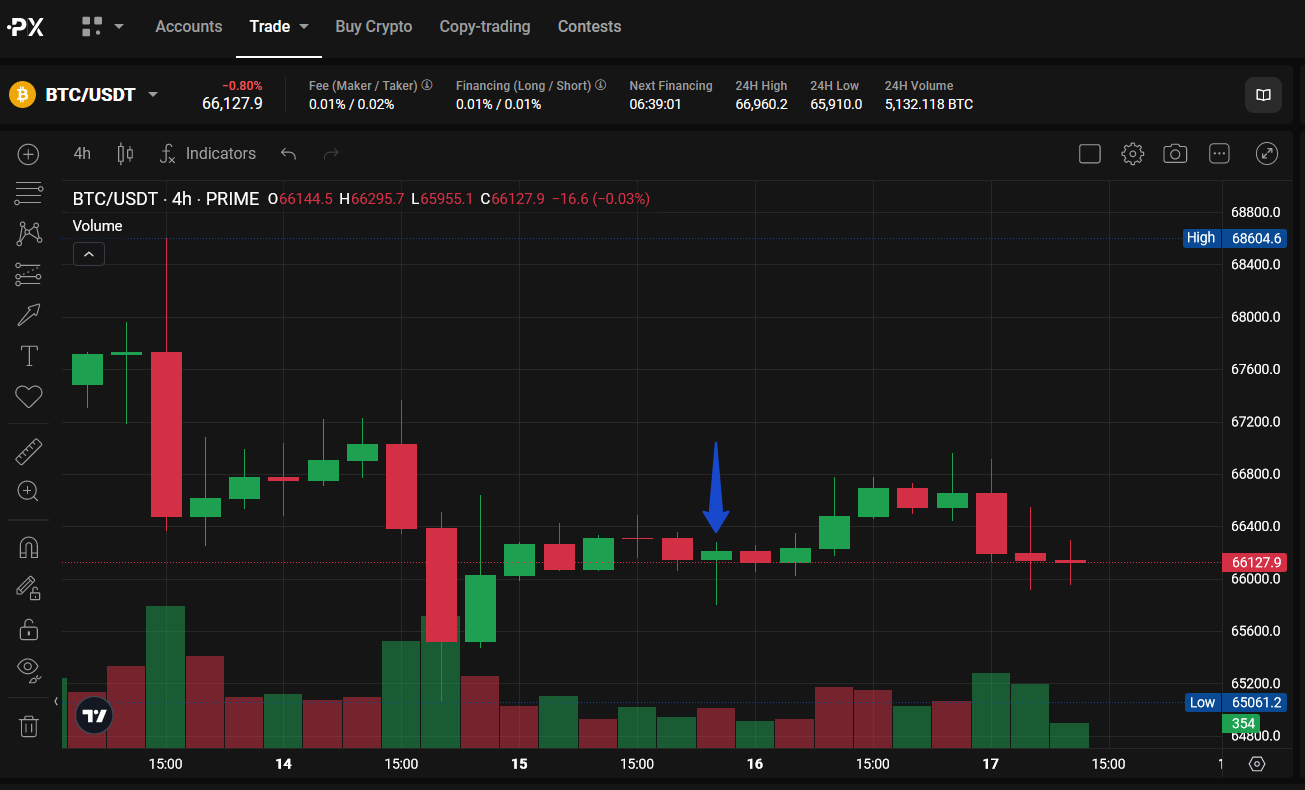
When looking for the hammer or inverted hammer, first, you need to make sure that the lower wick or shadow is at least twice as long as the candlestick’s body as shown in the image above.
As you can see, from the next candlestick, the asset’s opening price was lower, but it ultimately saw a significant rise from the next period’s low of $66054 to the pattern’s last candlestick low of $66496.
If you look at the last green candlestick (six candles from the true inverted hammer), before BTC/USDT starts moving downward, it looks like an inverted hammer candlestick pattern but is a false signal, since a “green” inverted hammer pattern is usually considered another one of the types of bullish candlestick patterns.
2. The Bullish Engulfing
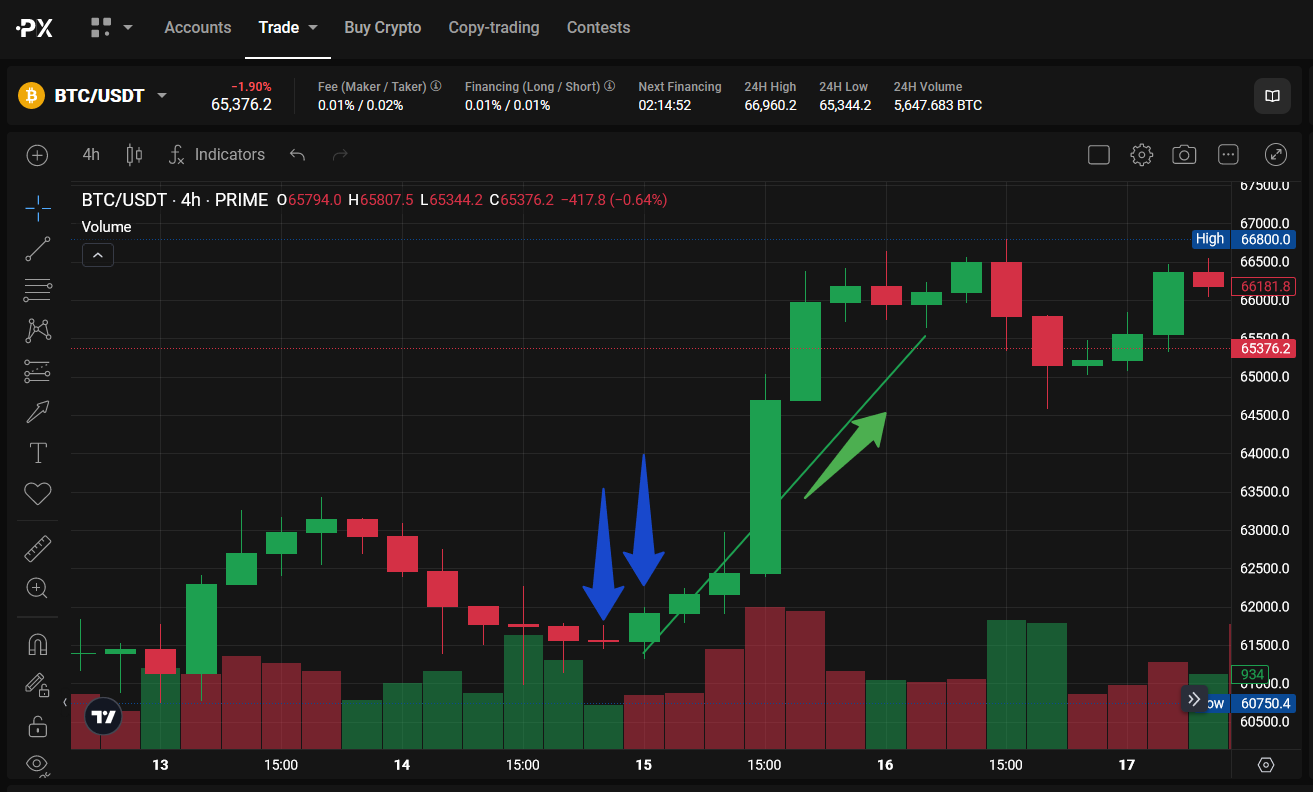
A bullish engulfing pattern consists of a previous candlestick being engulfed in the next bullish candlesticks wicks and body. These are the characteristics of how the pattern is formed. The bullish engulfing pattern usually happens as a downtrend is ending. The first candle is small, following a bigger candle whose body completely “engulfs” the previous one’s body, and thus the name bullish engulfing. Numerically, the second candle’s highs must be higher than the previous one. In completely perfect clinical conditions, the second candle’s closing (top of the candle’s body) should be higher than the previous candle’s high.
All of these conditions reinforce the speculation that bullish traders are now controlling the price, driving the value up, as seen in the chart pattern above.
The engulfing pattern is usually considered a bullish reversal pattern.
3. The Piercing Line
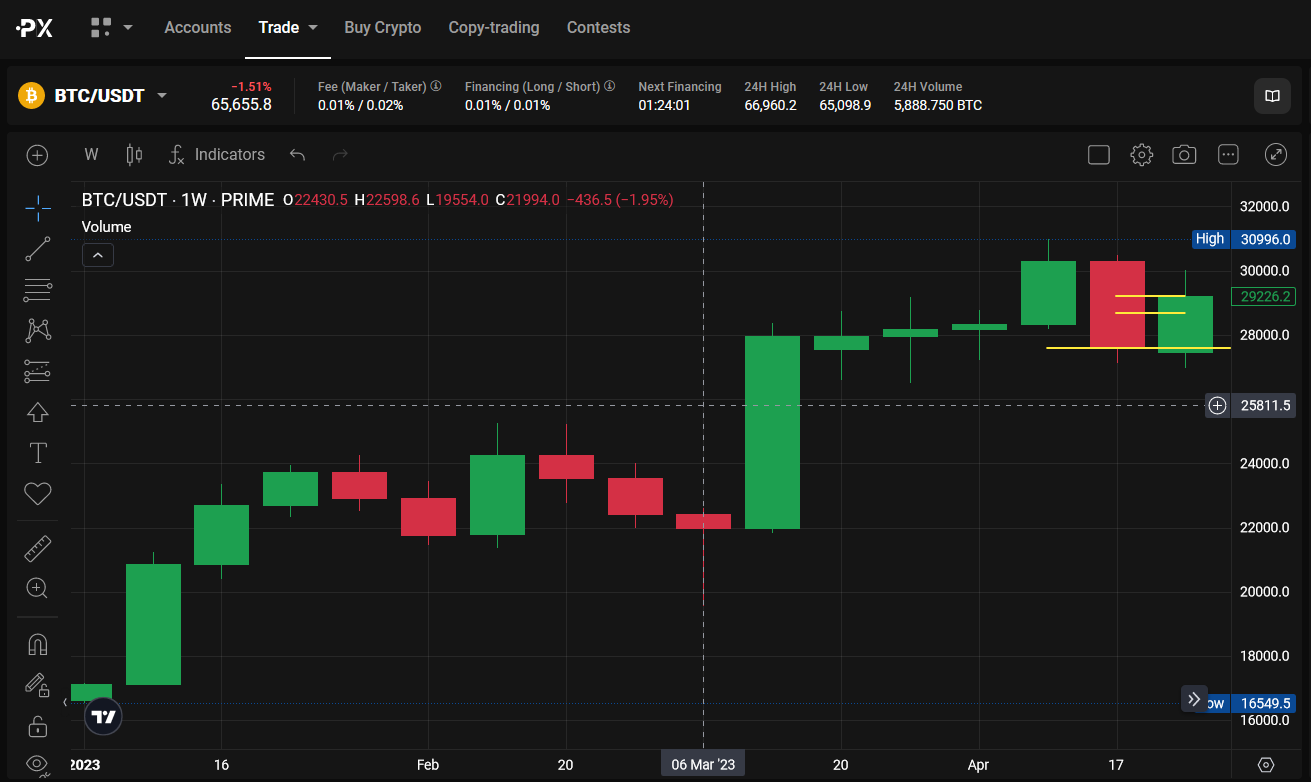
The piercing line pattern is formed when a bearish candle is followed by a bullish candle, that opens below the previous closing and closes at least 50% or higher than the bearish candle body. As you can see in the image above, this checks all the bullish reversal pattern boxes.
The bullish engulfing pattern and piercing line are both bullish reversal patterns, i.e., they precede a potential trend reversal from downtrend to uptrend. A bearish reversal pattern on the other hand, usually happens during an uptrend that signals a drop in the asset’s price.
4. The Morning Star
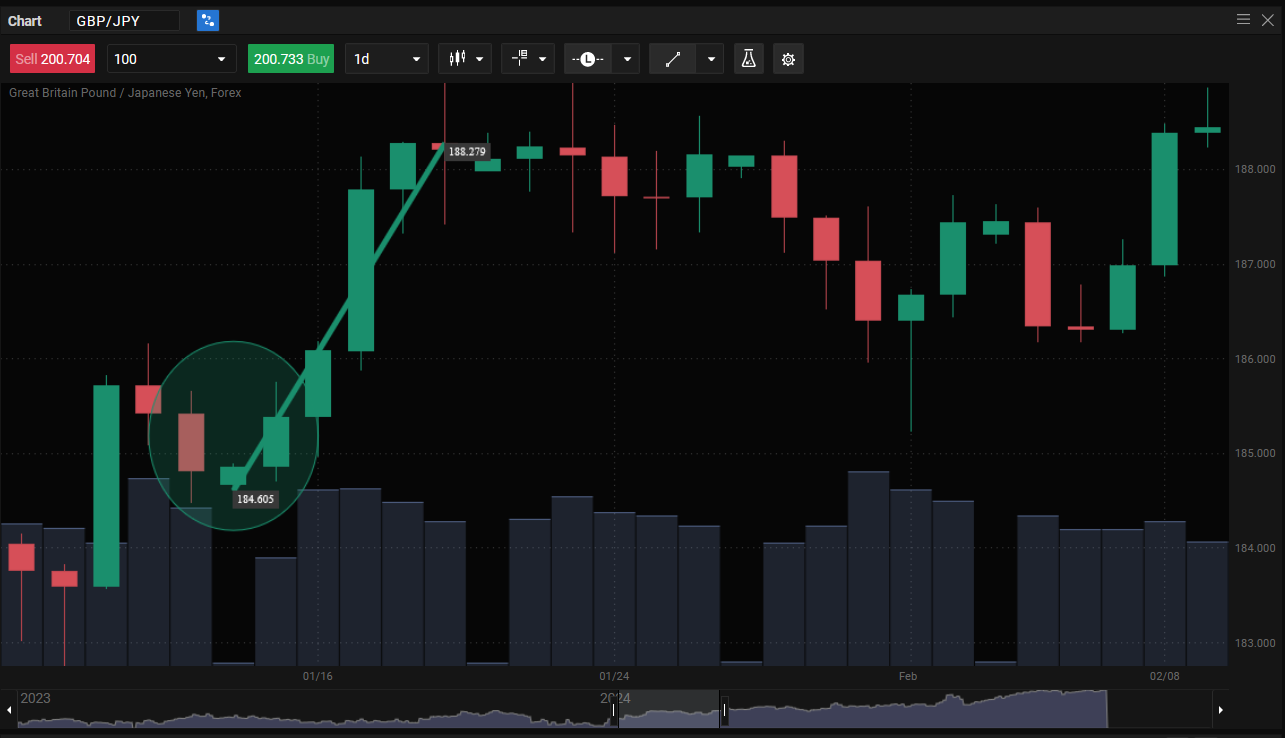
The morning star bullish candle pattern, is also a bullish reversal pattern like the two previous patterns, which means it happens during a downtrend and indicates a reversal of the downtrend.
So that is the first indicator that you may be looking at the morning star pattern, second indicator is a relatively long bearish candlestick, with a short bullish candle that indicates indecision and a balance of support and resistance levels. Upon the conclusion of the morning star pattern, you should see a reversal of the previous downward price movement.
There are a few other items that you may need to confirm the pattern. Ideally, the shorter candlestick in the pattern should gap down from the previous candle closing price, and the first bullish candle should gap up from the previous candle (the short one).
5. The 3 White Soldiers
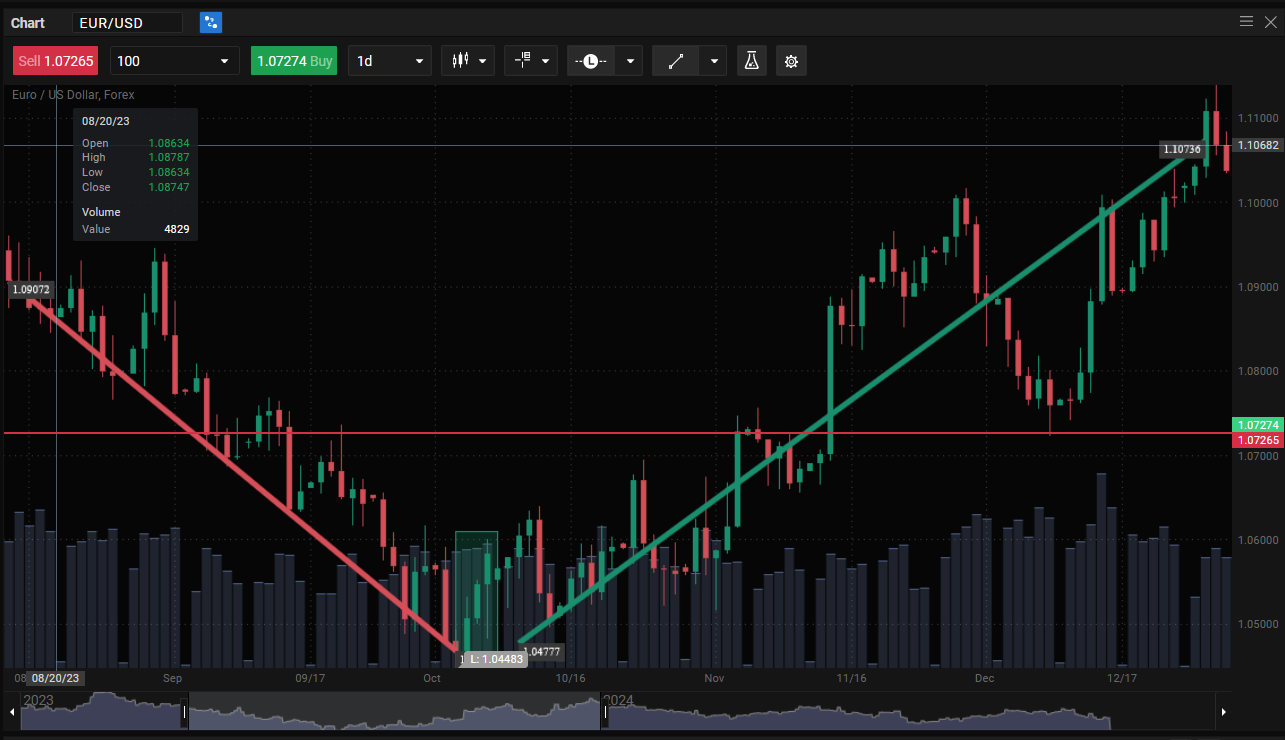
Like the candlestick patterns above, the three white soldiers pattern is also a bullish reversal or bullish pattern.
Keep in mind that all these bullish candlestick patterns are usually only valid after or during a strong trend. If you notice any pattern emerging when markets are indecisive, though, it is most likely going to be a false signal.
With the disclaimer out of the way and returning to the three white soldiers, as you can see in the image above, as the previous downtrend comes to an end, three consecutive bullish candles develop, and then the trend reverses into an uptrend as indicated by the trend lines.
In perfect conditions each candlestick’s closing should be higher than the previous candlestick’s closing.
Reading and Interpreting Bullish Patterns
Again, as stated above, make sure that all of the patterns on the previous list happen during strong trends. As the name implies, bullish candlestick patterns show a potential bullish trend, so they often precede a bearish trend.
This means that the signals these patterns yield are not as strong when markets are moving in a narrow range, i.e. moving sideways
If markets are “choppy” i.e. you see the price fluctuating between bullish and bearish, then signals given by both a bullish pattern or bullish candlestick may be false.
No matter what type of technical analysis you perform, whether you are using bullish candlestick patterns, or other indicators, it is always a good idea to use it in conjunction with other market analysis tools. Many traders use volume weighted average price indicators or volume indicators for more information.
Technical Analysis Using Bullish Patterns
Any tool you use to interpret market sentiment or forecast potential future market movements, should always be confirmed by using other indicators.
Depending on your strategy, timeframe, and financial goals you can reinforce or even confirm the signals you are getting from candlestick patterns with other indicators.
Here are some of the most popular indicators used with candlestick patterns:
- MAs (moving averages) this type of indicator can show you at which level you can enter and exit a trade. Exponential moving averages and simple moving averages are popular variations that follow the current price movement closer or smooth out the price’s fluctuations. This “smoothing” can help traders discern if the asset is in a strong uptrend or downtrend.
- RSI (Relative Strength Index) is considered a momentum indicator showing traders both the speed and magnitude of a price’s change. RSI is measured on a scale from one to one hundred with overbought conditions being considered above seventy and oversold under thirty. When the price is overbought it is assumed it will drop and when it is oversold it is assumed it will rise. This can help you confirm when candlestick patterns give you a price reversal signal.
- MACD (moving average convergence divergence) is an indicator that uses two MAs, one that follows current prices closer and one that is a certain standard deviation away from current prices, to show the momentum of a trend. Depending on which MA is above, which one crossed over, and the distance between the two, it can show traders if a trend is strong, potentially ready for a reversal or moving within a narrow range. If you’d like to learn more read our article about MACD.
Trading Strategies Based on Bullish Patterns
Although there are many ways to trade, we will focus on a few of the most popular and straightforward bullish candlestick patterns.
- Going Long: The downtrend is strong, and you see a candlestick pattern forming. Once you see the pattern complete and you confirm the trend or gather other data using indicators, you can enter a buy trade following the trend. You can exit the trade when your indicators show that the trend’s momentum is slowing down. Do not wait until the very last moment to exit the trade, as this may cause your gains to be wiped out by an abrupt price change.
- Hedging existing trades: hedging is a risk management method that involves limiting your market exposure by open a trade that will move in the opposite direction. If the market moves against the trade you already have open, your hedge will counterbalance the losses it will accrue.
- Risk Management: using take profit and stop loss orders to lock in your profits, by closing your profitable trade before a trend reverses, or setting your maximum risk tolerance with stop loss, can help you effectively limit your market exposure.
- Entry and Exit Points: Using your candlestick pattern in combination with technical analysis indicators can help you better decide your entry and exit points, your stop loss and take profit levels.
Pros and Cons of Using Bullish Candlestick Patterns
As with any candlestick pattern, bullish patterns can yield false signals, especially if the market conditions aren’t appropriate for their use. Although they can be a quick, relatively simple way to see or confirm a potential reversal, when used on their own, they might result in avoidable market exposure.
Most professional or institutional traders and investors usually use a combination of indicators, price patterns, and signals to help them interpret, analyse, and make their trades.
Even though you could base your entire strategy on a single indicator or a single type of pattern, it wouldn’t be very successful. The most successful strategy tries to gather as much information as possible without creating unnecessary “noise” (noise in statistics, which is the godfather of technical analysis, is described as data rendered meaningless due too much variation; in market terms, this would be volatility).
Candlstick pattern pros:
- They are relatively easy to read
- Candlestick charts can give you a lot of information – opening, closing, high and low prices.
- Is compatible with other indicators
- It can be used for both long-term and short-term strategy technical analysis.
Candlestick pattern cons:
- Candlestick patterns may be misinterpreted
- Does not show momentum, support and resistance levels, or volume
- Can be challenging to analyse and use during market volatility.
Conclusion
Bullish candlestick patterns can be an extremely valuable tool for technical traders. Of course, they can not work completely independently since they only show you opening, closing, highs and lows, leaving a gap when it comes to momentum, volume, overbought and oversold conditions.
Additionally, when used on their own, candlestick patterns can be prone to give false signals.
If you use these patterns correctly, though, augmenting them with the appropriate indicators to either confirm or contradict the signals they are showing you, they can be a very powerful and useful tool. Furthermore, you can limit your market exposure, increasing your chance of your strategy succeeding, by employing the necessary risk management measures, to both lock in your potential profits and avoid runaway losses.
The content provided here is for informational purposes only. It is not intended as personal investment advice and does not constitute a solicitation or invitation to engage in any financial transactions, investments, or related activities. Past performance is not a reliable indicator of future results.
The financial products offered by the Company are complex and come with a high risk of losing money rapidly due to leverage. These products may not be suitable for all investors. Before engaging, you should consider whether you understand how these leveraged products work and whether you can afford the high risk of losing your money.
The Company does not accept clients from the Restricted Jurisdictions as indicated in our website/ T&C. Some services or products may not be available in your jurisdiction.
The applicable legal entity and its respective products and services depend on the client’s country of residence and the entity with which the client has established a contractual relationship during registration.


