Bitcoin has once again broken above its all-time highs, and naturally, the big question now is: what happens next? Is this the time to sell? Is it time to buy more? While we can’t predict the future, what we can do is zoom out and look at the bigger picture. Because when it comes to Bitcoin, understanding the long-term cycles is essential. This article will focus on the broader structural view of Bitcoin, with emphasis on halving cycles, parabolic runs, and trend duration.
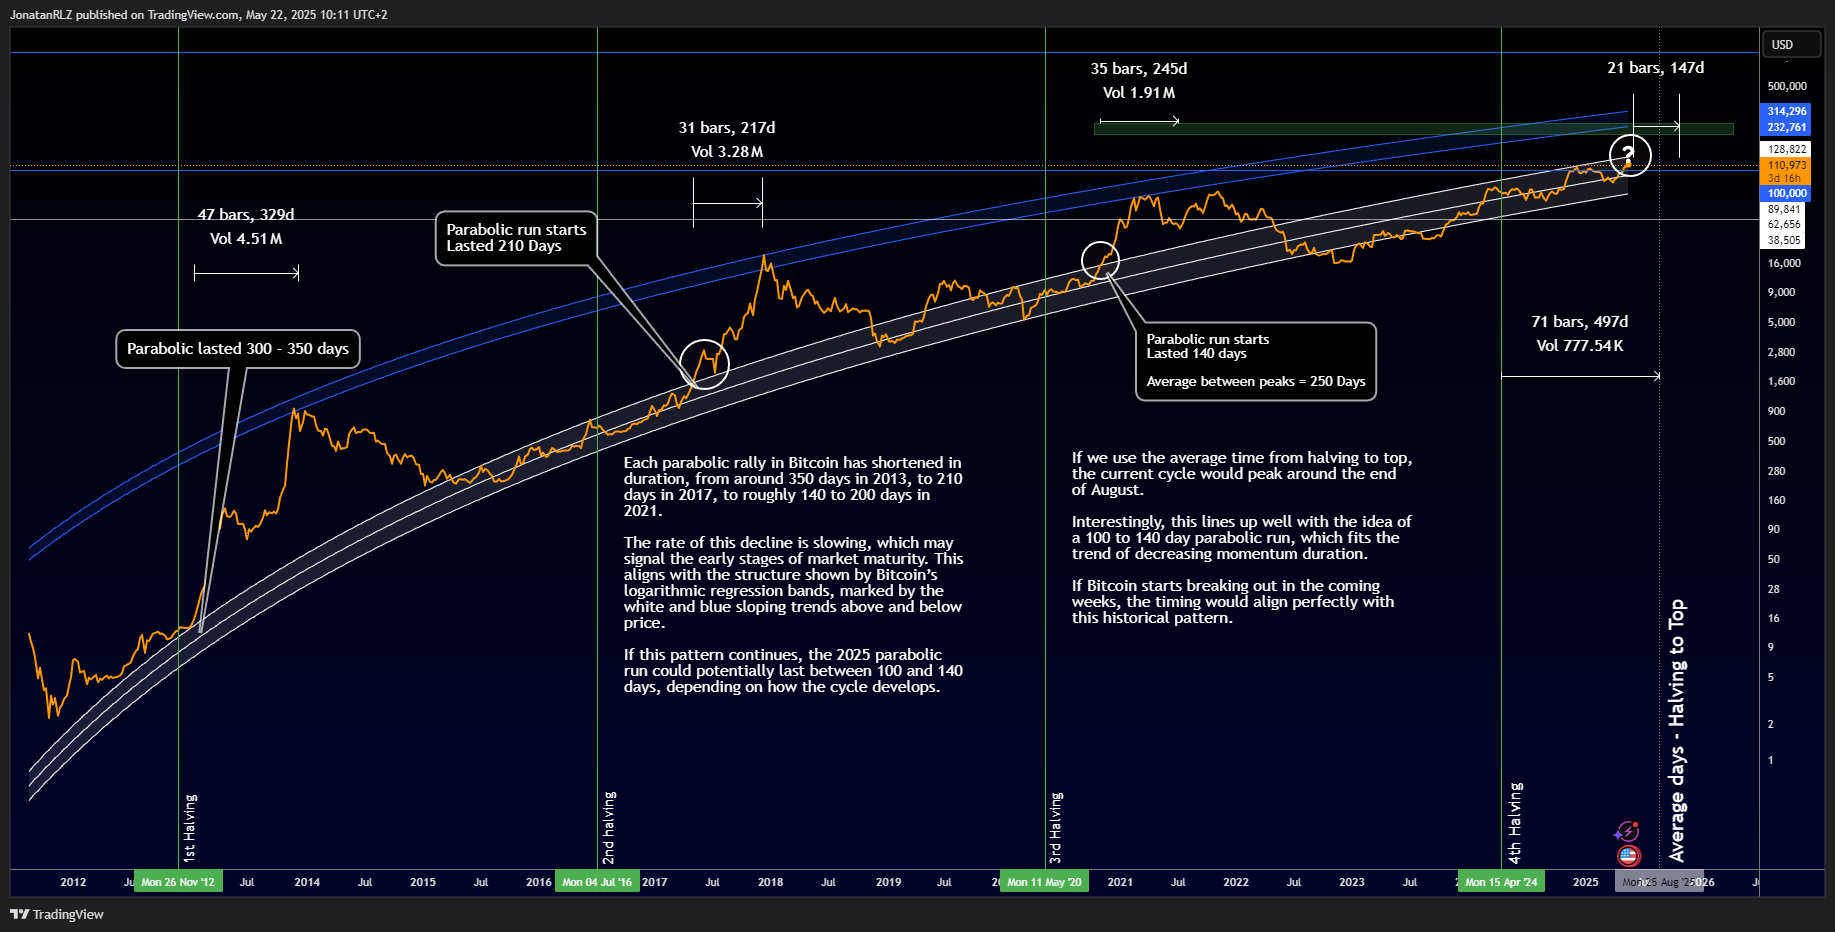
Historically, Bitcoin follows a four-year halving cycle, with each halving triggering a new macro bull trend. Looking at past data, the first halving in 2012 took 370 days to reach the cycle top. The second cycle, starting with the halving in 2016, peaked after approximately 532 days. The third, beginning in 2020, reached its top around 540 days later. Based on this, we calculate an average of around 518 days from halving to top. That average puts us somewhere around the 20th of August this year as a potential timeframe for a cycle peak if historical tendencies hold true.
This window aligns well with another key element of Bitcoin’s behaviour, which is the length of its parabolic runs. The first major run lasted between 350 to 370 days, the second one lasted around 210 days, and the third one lasted somewhere between 140 to 200 days. Each cycle has seen a shorter parabolic expansion than the last, and while the rate of decline is slowing, it does suggest a maturing cycle. In other words, Bitcoin’s parabolic phases are becoming shorter but more controlled. This trend also lines up with Bitcoin’s logarithmic regression indicator, represented by the large sloping white and blue trend lines visible on long-term charts.
If this pattern continues, the current cycle could produce a parabolic move lasting approximately 100 to 140 days. That projection fits well within the timeframe of the halving-to-top window and further strengthens the idea that a significant move could be underway in the coming months.
While past performance is not a guarantee of future results, Bitcoin’s historical tendencies offer a valuable lens through which we can assess current market behaviour. The recent breakout into all-time highs is supported by a strong macro structure and favourable sentiment. The coming weeks will be crucial, and if Bitcoin begins a sustained breakout, we could be witnessing the early stages of a powerful continuation trend.
The framework is there, the momentum is building, and the structure is holding. Whether this becomes the most significant cycle in Bitcoin’s history remains to be seen, but the technicals suggest we’re entering a defining period.

Trading involves risk.
The content provided here is for informational purposes only. It is not intended as personal investment advice and does not constitute a solicitation or invitation to engage in any financial transactions, investments, or related activities. Past performance is not a reliable indicator of future results.
The financial products offered by the Company are complex and come with a high risk of losing money rapidly due to leverage. These products may not be suitable for all investors. Before engaging, you should consider whether you understand how these leveraged products work and whether you can afford the high risk of losing your money.
The Company does not accept clients from the Restricted Jurisdictions as indicated in our website/ T&C. Some services or products may not be available in your jurisdiction.
The applicable legal entity and its respective products and services depend on the client’s country of residence and the entity with which the client has established a contractual relationship during registration.


