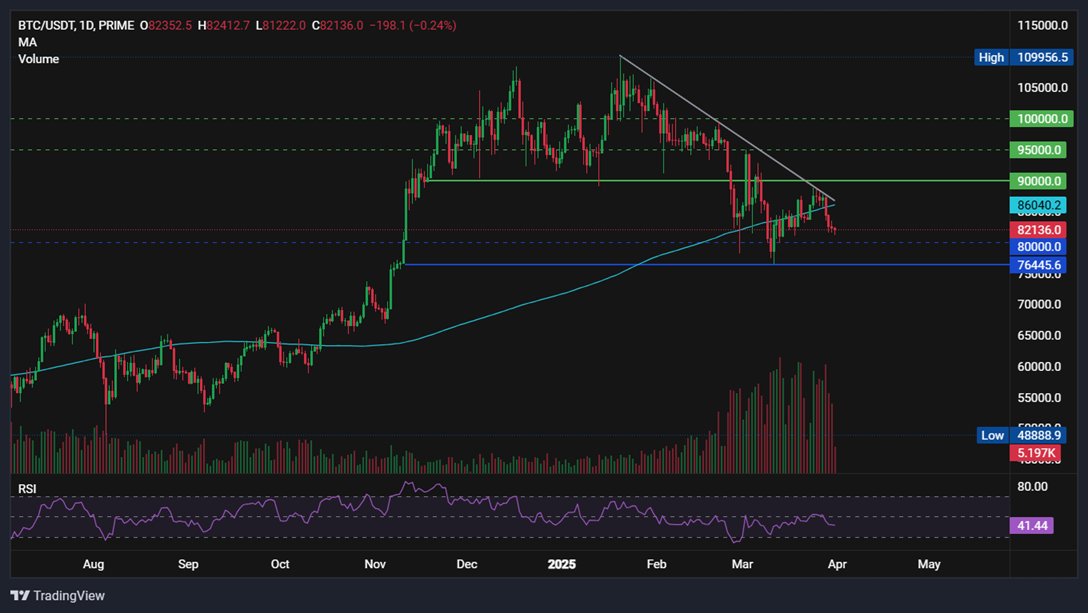
Last week was a week of two halves for Bitcoin. After starting the previous week on a positive note, BTC rose to a peak of 88.8k before the mood soured, and Bitcoin fell across the latter part of the week, hitting a low of 81.8k. The world’s largest cryptocurrency ended the week 3% lower, broke below the key 200 SMA support, and trades at 82k at the start of the new week.
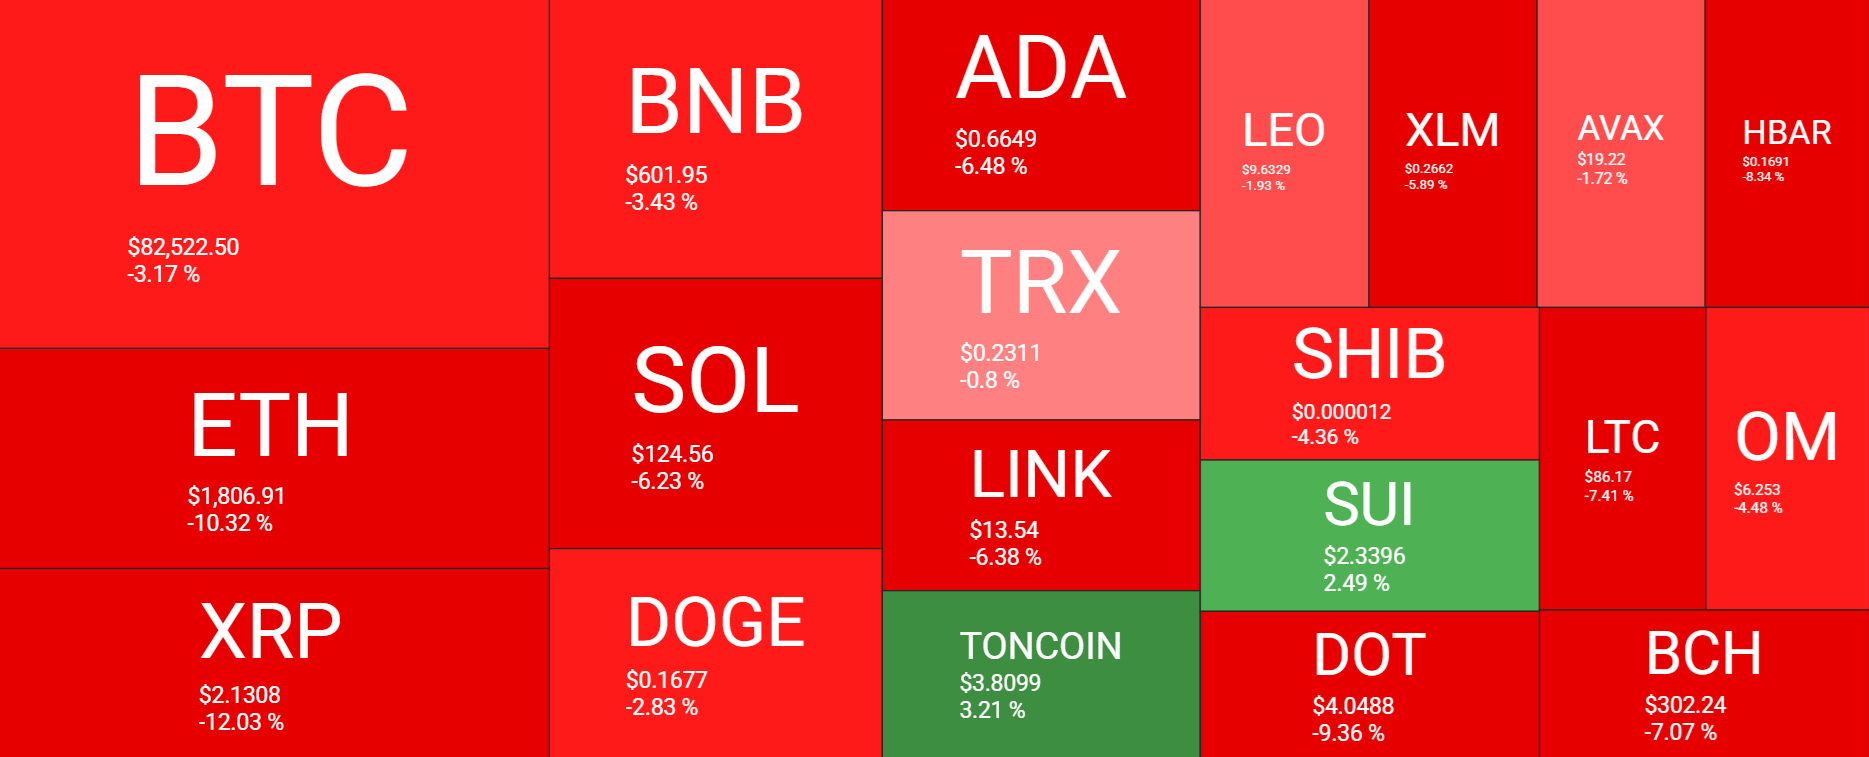
While Bitcoin fell 3% last week, altcoins were hit much harder. Ethereum continued to be pummelled by investors, dropping 10%. XRP fell 12%, while Solana and Cardano fell 6% each. There were a few spots of positivity, including TON and SUI.
Liquidations
Many cryptocurrencies are trading at their lowest levels in over a week. As tokens declined, crypto liquidations surged compared to the previous week, with long positions taking the biggest hit. According to Coinglass data, long liquidations reached $1.21 billion compared to $514.8 million in short liquidations, suggesting that bulls have lost momentum.

BTC ETFs see weekly inflows
Institutional demand held up across last week. Coinglass data showed that BTC ETFs saw net inflows of $88.79 million last week, the second straight week of net inflows. Breaking this down on a daily basis, BTC ETFs experienced 10 consecutive days of inflows, marking the longest winning streak this year. The funds added $1 billion in value across a 10-day streak. However, the inflow run was halted on Friday, with $93.1 million in outflows, primarily from Fidelity.

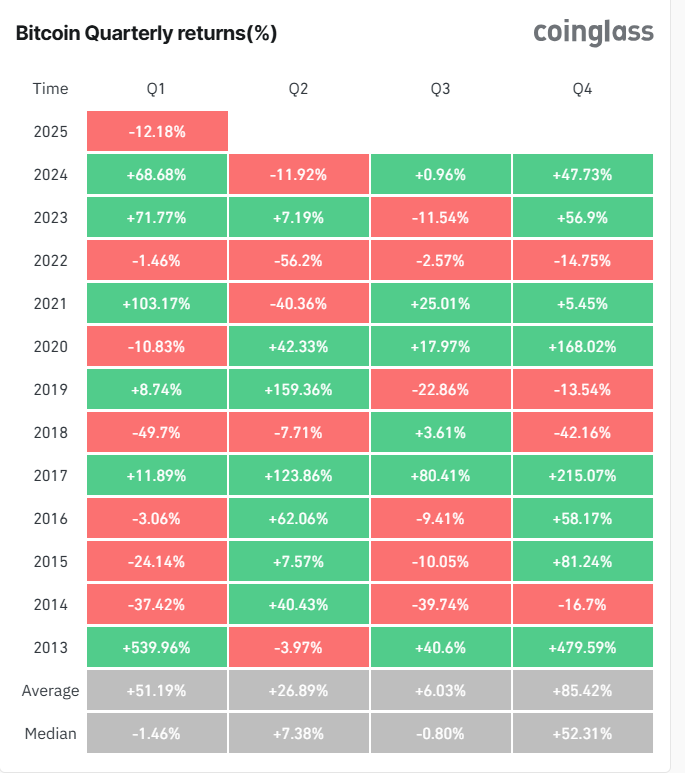
The end of the streak comes as Bitcoin is on track to complete its worst Q1 close since 2018. The price is down around 12% in the first quarter of 2025, worse than the 2010s’ 10.8% loss in Q1, but still above Q1 2018’s dramatic 49.7% plunge. According to data from Coinglass, on average, Q2 gains since 2013 have been 26%, while median gains have been 7.3% across the March to June period.
Macro back drop
The market mood was relatively upbeat at the start of last week, following reports that Trump may take a more lenient view of reciprocal trade tariffs, which are set to be applied this week. However, the improved mood was short-lived after Trump announced 25% trade tariffs on all car imports into the US.
The mood was hit further by hotter-than-expected core PCE data. Core PCE, the Fed’s preferred gauge for inflation, rose to 2.8% annually in February, up from 2.5% in the previous month. On a monthly basis, inflation rose 0.4%, ahead of the estimated 0.3%. At the same time, consumer spending rose just 0.1% after falling in January by the most in almost four years.
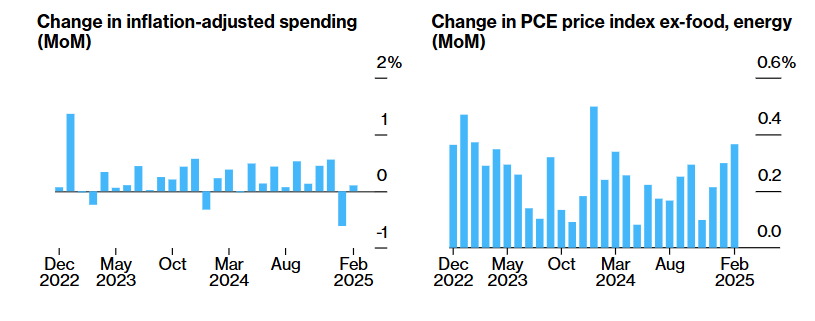
The report highlights sticky inflation at a time when President Trump is set to impose additional trade tariffs, which could further fuel price pressures. Trump’s aggressive trade policies have dampened sentiment among businesses and consumers, raising concerns that the economy is heading into stagflation – characterised by high inflation and low growth.
Bitcoin’s move lower came as the Nasdaq dropped 2% on Friday and as Gold rose to a fresh record high, above $3100. These moves reflected investors’ risk-off mood and macro uncertainty, especially ahead of Trump’s new tariffs to be announced on April 2nd.
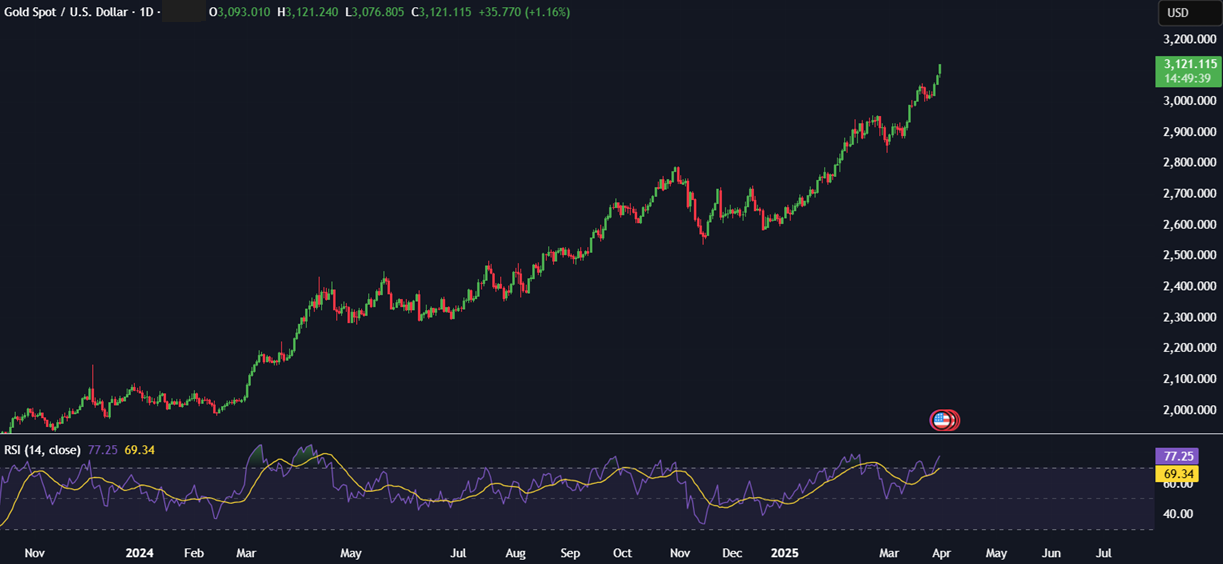
Trump’s reciprocal tariff announcement is expected to be made mid-week. It is anticipated to be a major market event that could fuel activity across both cryptocurrency and broader financial markets, similar to the market shift seen following the developments in Canadian and Mexican tariffs earlier in the quarter.
The April 2 announcement is expected to detail reciprocal trade tariffs targeting top US trading partners. The aim is to reduce the US’s estimated $1.2 trillion goods trade deficit and boost domestic manufacturing.
Should Trump soften his stance, markets could rally; however, if the president remains vague, volatility could increase, hitting both long and short positions. If he adopts a hardline, a sharp selloff in risk assets may be seen.
Whales accumulate
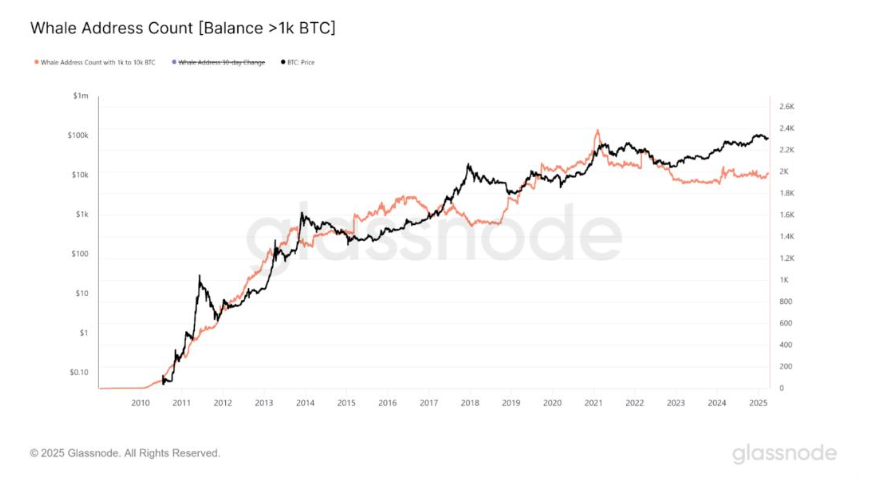
Despite rising uncertainty, large Bitcoin holders, holding between 1,000 BTC and 10,000 BTC, have continued to accumulate. Addresses in this category have remained steady since the beginning of 2025, from 1956 addresses on January 1 to 1990 on March 27. However, this is still below the previous cycle’s peak of 2730 addresses recorded in February 2024.
STH in distress
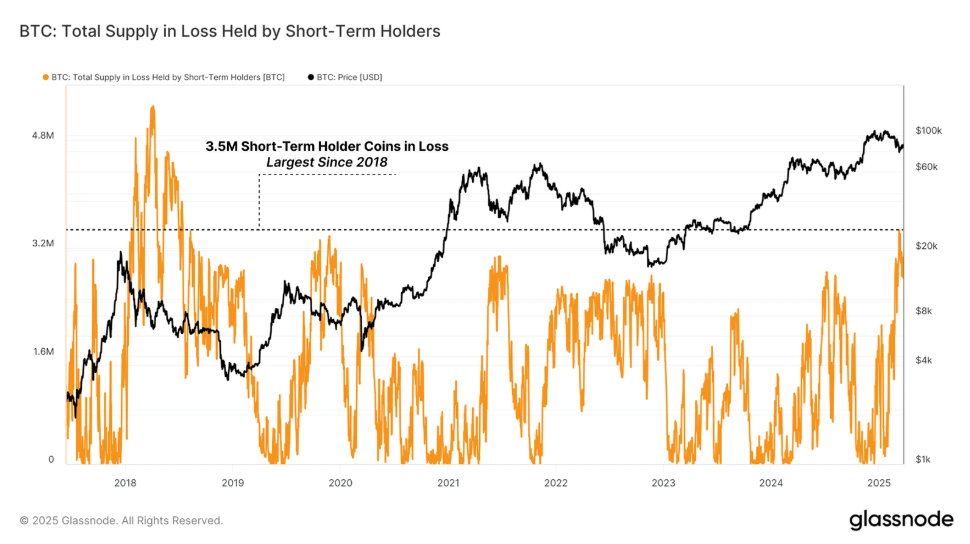
A Glassnode report suggests that Bitcoin is consolidating in a new range between 78,000 and 88,000, with on-chain profit and loss-taking events declining in magnitude, indicating a weaker demand profile. The reports suggest that short-term holders are experiencing significant financial stress. These Bitcoin investors who have held BTC for under six months likely bought at or above $90,000 or even $100,000. The supply held by STH reached a seven-year high, incurring a loss of 3.4 million BTC. This selling pressure could increase the likelihood of a market-wide capitalization event.
1 year % change nears negative
Bitcoin’s 1-year % change is nearing negative territory. This metric tracks the price difference over a rolling 12-month period for Bitcoin and serves as a key indicator for market sentiment. When negative, it indicates that the price of BTC is lower than it was a year ago. This has historically been linked with bearish market trends; three of the four latest examples of such a dip have led to sustained downturns and could signal potential new lows in the near future.
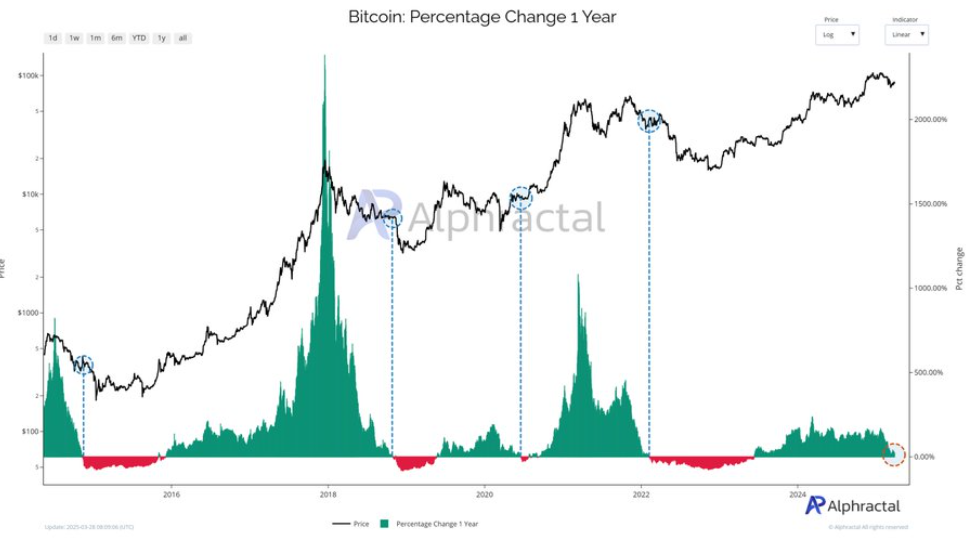
However, in 2020, the negative shift was part of a broader consolidation phase. In 2024, the Bitcoin one-year change was negative but didn’t lead to a product downturn; it signaled a period of consolidation before a significant bullish breakout. Should the current situation mirror this, with Bitcoin’s price remaining steady near the negative zone, we could see some short-term stagnation before resuming upward momentum. However, a drop into negative territory could result in a deeper downturn.
Weekly 50 SMA still holds
While there are plenty of reasons to be gloomy, it’s worth noting that the weekly 50 SMA dynamic support continues to hold. This has been a key support for bull runs in 2021 and is also the current 2023-2025 cycle. This suggests that while the price holds above the 50 SMA, the market structure remains bullish. However, if this level is broken, Bitcoin could be heading towards a bear market.
Another metric aligning with a more bullish narrative is the sell-side ratio. This ratio compares investor spending within a specific period to the realised market cap. Historically, when this level is below 0.1%, it signals the start of a significant price rally. Currently, the sell-side ratio is at 0.086%, suggesting that Bitcoin may recover.
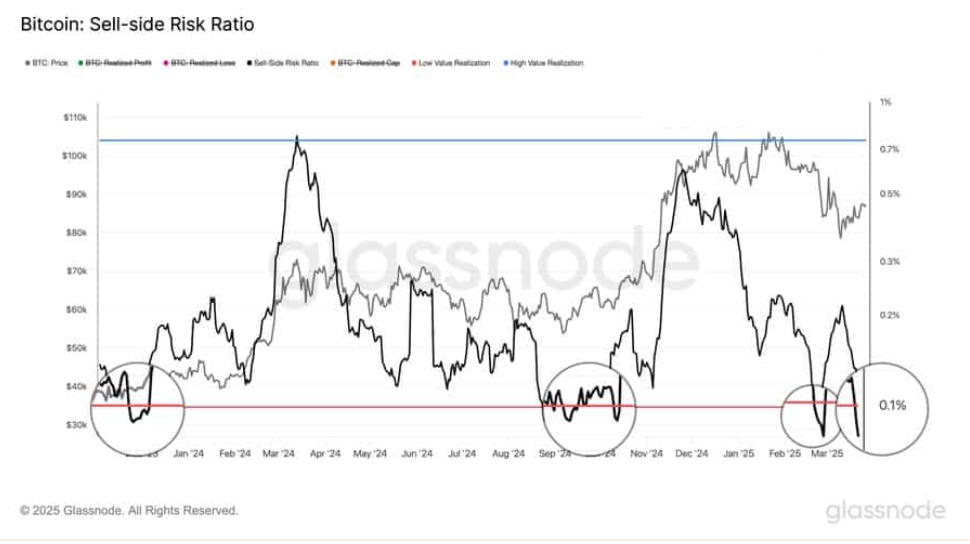
With Bitcoin giving mixed signals, attention will be firmly on April 2 for further and will likely set the tone for the coming months.
The content provided here is for informational purposes only. It is not intended as personal investment advice and does not constitute a solicitation or invitation to engage in any financial transactions, investments, or related activities. Past performance is not a reliable indicator of future results.
The financial products offered by the Company are complex and come with a high risk of losing money rapidly due to leverage. These products may not be suitable for all investors. Before engaging, you should consider whether you understand how these leveraged products work and whether you can afford the high risk of losing your money.
The Company does not accept clients from the Restricted Jurisdictions as indicated in our website/ T&C. Some services or products may not be available in your jurisdiction.
The applicable legal entity and its respective products and services depend on the client’s country of residence and the entity with which the client has established a contractual relationship during registration.


