Welcome to the daily technical update on Bitcoin.
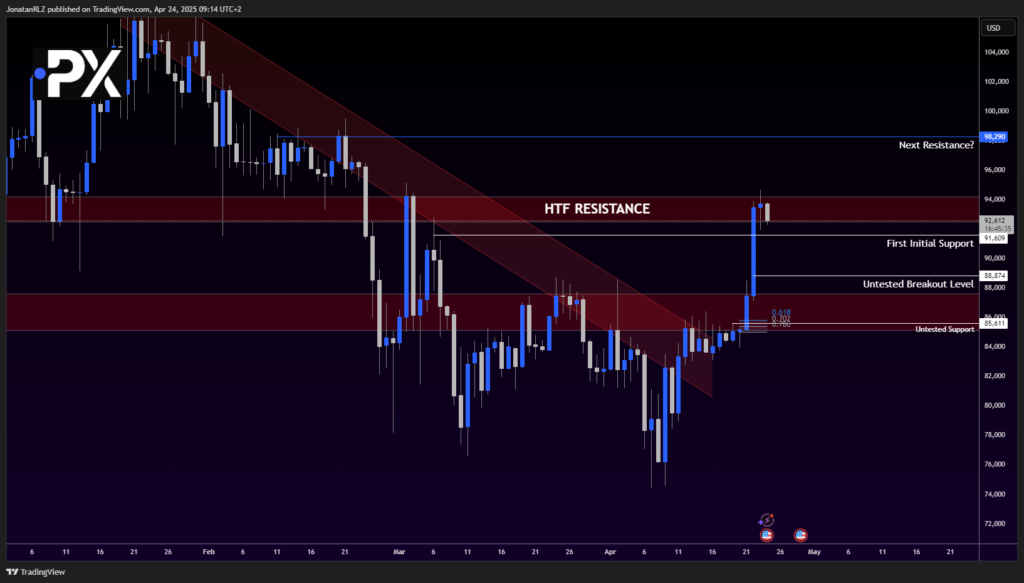
What a move we’ve seen this week—and in yesterday’s update, we noted that if Bitcoin continued pushing higher, the next key resistance zone to watch would be around $98,290.
However, as we can see on the daily chart, that breakout did not materialize. Instead, we’re seeing signs of a low timeframe fakeout, with yesterday’s candle forming a classic doji—marked by wicks on both sides and a small body, reflecting indecision between buyers and sellers.
The current daily candle, at the time of writing, is now pushing lower, which suggests that the high timeframe resistance is holding and that sellers are starting to gain the upper hand—at least temporarily.
To the downside, we’re monitoring two key levels:
- Initial Support: ~$91,609
- Untested Breakout Level: ~$88,874
Let’s now drop into the lower timeframes to assess what price is telling us from an intraday perspective.

1H Chart – Head and Shoulders Pattern Signals Local Trend Shift
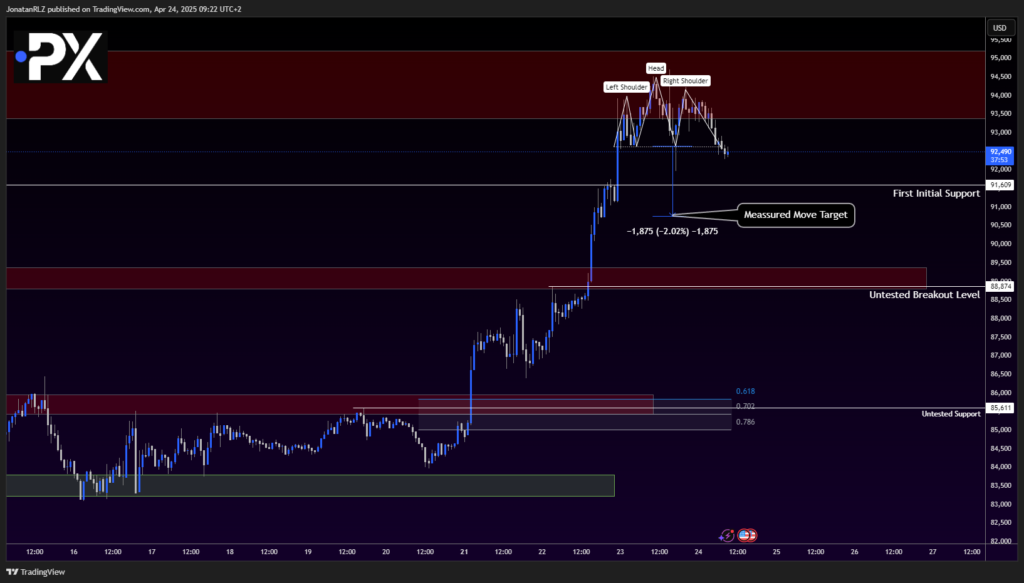
Looking at the 1-hour chart, we can now observe a classic top formation beginning to develop—a head and shoulders pattern, which could indicate a potential short-term trend shift.
It’s important to note that reversal patterns like this are rarely perfect. In this case, we’ve seen wicks slightly take out both the head and the neckline, but that doesn’t invalidate the broader structure. What matters most is the transition in swing points, moving from higher highs to lower highs, and eventually into a break of structure with lower lows—illustrating a trend reversal.
As shown on the chart, price is currently trading just below the neckline, and a confirmed move lower could bring us down toward the $91,609 level, which is both a previous support zone and an untested breakout level from earlier in the week.
Using the measured move principle, the potential target from the top of the head to the neckline gives us a projected move down to around $90,780—roughly a 2% drop from the high. However, measured moves aren’t always fulfilled perfectly, especially if strong support levels lie just above the target, which is the case here with the $91,609 zone.
If that first support fails to hold, the next level to monitor is the $88,800–$89,000 zone, the original breakout level that has yet to be retested.
On the flip side, a reclaim of the neckline, followed by a break back above the right shoulder, would invalidate the top formation entirely. That could signal a bullish recovery and set the stage for a renewed move toward $98,290, as noted in the daily chart.

The content provided here is for informational purposes only. It is not intended as personal investment advice and does not constitute a solicitation or invitation to engage in any financial transactions, investments, or related activities. Past performance is not a reliable indicator of future results.
The financial products offered by the Company are complex and come with a high risk of losing money rapidly due to leverage. These products may not be suitable for all investors. Before engaging, you should consider whether you understand how these leveraged products work and whether you can afford the high risk of losing your money.
The Company does not accept clients from the Restricted Jurisdictions as indicated in our website/ T&C. Some services or products may not be available in your jurisdiction.
The applicable legal entity and its respective products and services depend on the client’s country of residence and the entity with which the client has established a contractual relationship during registration.


