Following U.S. President Donald Trump’s 90-day pause on tariffs for countries that do not retaliate, we saw massive volatility across markets throughout the day yesterday. This sudden shift in tone has sparked some very interesting technical developments—and today, we’re diving straight into the charts to continue where we left off in yesterday’s update.
S&P 500 (SPX)
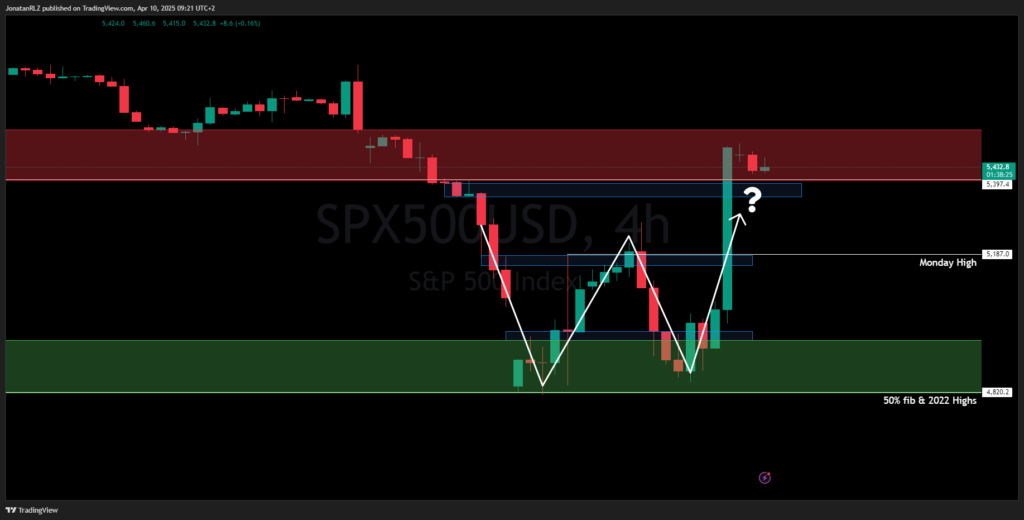
As we can see on the chart, the W-pattern we marked out in yesterday’s update has been playing out in real time. The S&P 500 not only reclaimed the Monday high, but surged straight into the high timeframe resistance zone around 5,500—marked in red on the chart.
What’s remarkable is the sheer scale of yesterday’s move. The S&P 500 printed a range of over 13% intraday, highlighting just how volatile markets have become following the announcement of Trump’s 90-day tariff pause.
While this strong move is noteworthy, it’s important to remember that price has not yet managed to reclaim that key HTF resistance level. As mentioned in previous updates, a confirmed break above this zone could shift the market back into bullish momentum and potentially validate the W-structure as a long-term bottom.
For now, this remains a critical level to monitor—it’s the gateway for continuation higher, or rejection and renewed volatility.
Intraday Levels – S&P 500
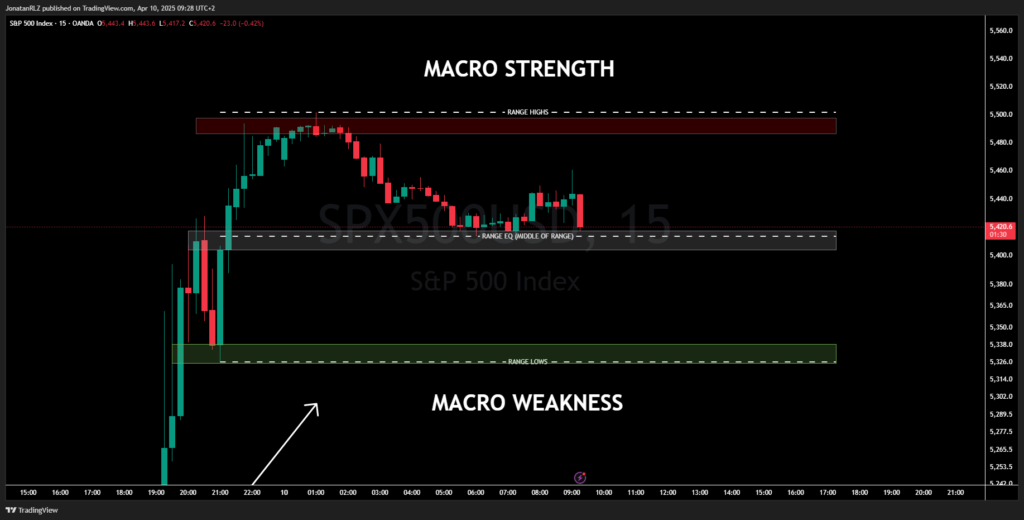
Zooming into the lower timeframes, we’re now seeing a clear range forming, with well-defined structure:
- Range lows are aligning with the previous high timeframe resistance, which price has now flipped into tentative support.
- Range EQ (equilibrium) marks the center of the range—essentially the mean level around which price is oscillating.
- And at the top, we have the range highs, sitting just under 5,500.
This setup gives us well-defined levels to track today. A break below the range lows could push us back below HTF resistance, invalidating the breakout and suggesting a return to macro weakness. On the other hand, a break and hold above 5,500 could be a sign of strength, reinforcing the idea that we may have seen a confirmed macro bottom.
These are the levels to watch closely throughout the session—as they could dictate the next major directional move.
Bitcoin (BTC/USD)
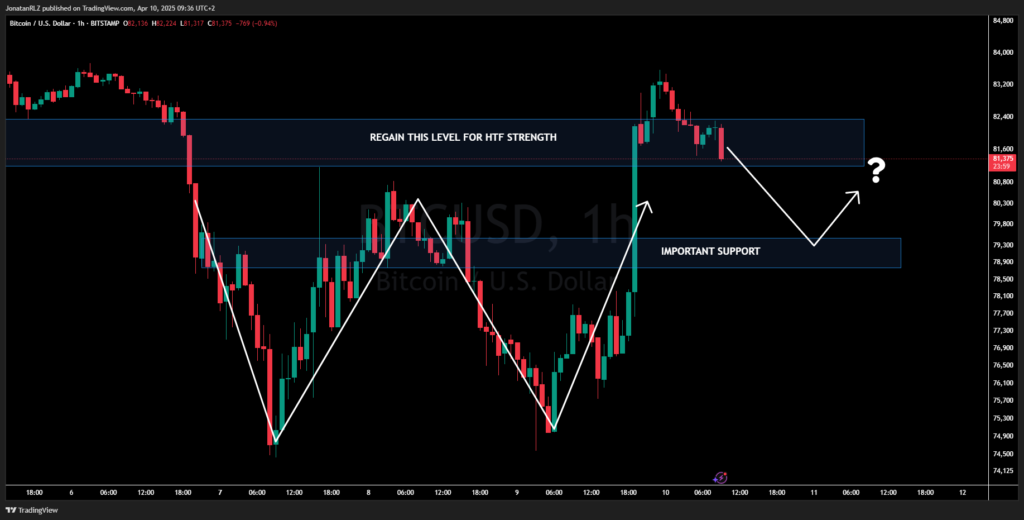
Now let’s take a look at everyone’s favorite digital gold—Bitcoin. Just like the S&P 500, Bitcoin also experienced a strong push to the upside yesterday, surging directly into the high timeframe resistance zone around $81,500–$82,500.
We’re now looking at a very similar scenario to what we saw on the S&P. If Bitcoin can hold this current region, we may see high timeframe bullish strength returning to the king of digital assets.
However, we also have a key support zone below, sitting at $79,000. If we break down from current levels, a retest of $79K becomes more probable. That would put us back at the neckline of the W-pattern we outlined in yesterday’s report.
The real test is this:
Will $79K act as a successful break-and-retest zone, confirming the W-structure and setting up for further upside?
Or will it fail—opening the door for a revisit of the double bottom lows around $74,500?
For today, the key levels to monitor are $79,000 and $82,000. How price behaves around these zones will likely dictate Bitcoin’s next big move.
Gold (XAU/USD)
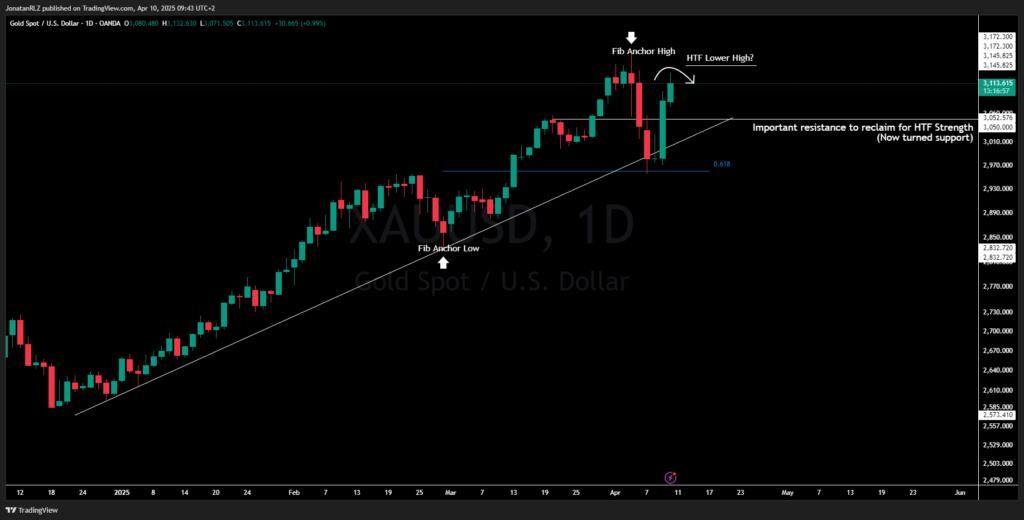
Let’s revisit yesterday’s gold analysis, where we were trading just below the $3,050 resistance—a key level we marked as critical to reclaim for a return to high timeframe strength.
Throughout the day, gold decisively reclaimed this level, and we’re now once again trading in what could potentially be a resumption of the high timeframe uptrend. This is a strong technical development—but we’re not out of the woods yet.
Right now, gold sits at a major decision point. If the current move stalls and forms a lower high while failing to break above $3,500, we could see one of two outcomes:
- A range forms below resistance, signaling market indecision.
- The move fails entirely, confirming a lower high and establishing a new HTF downtrend.
This leaves gold at a critical moment:
Will we break into new all-time highs and continue the trend from recent years?
Or are we seeing the early stages of a potential distribution range forming?
Of course, no one knows for sure—but what we do know is that high timeframe moves mostly start on the lower timeframes. So, let’s zoom in and take a look at the intraday structure.
Intraday Levels – Gold
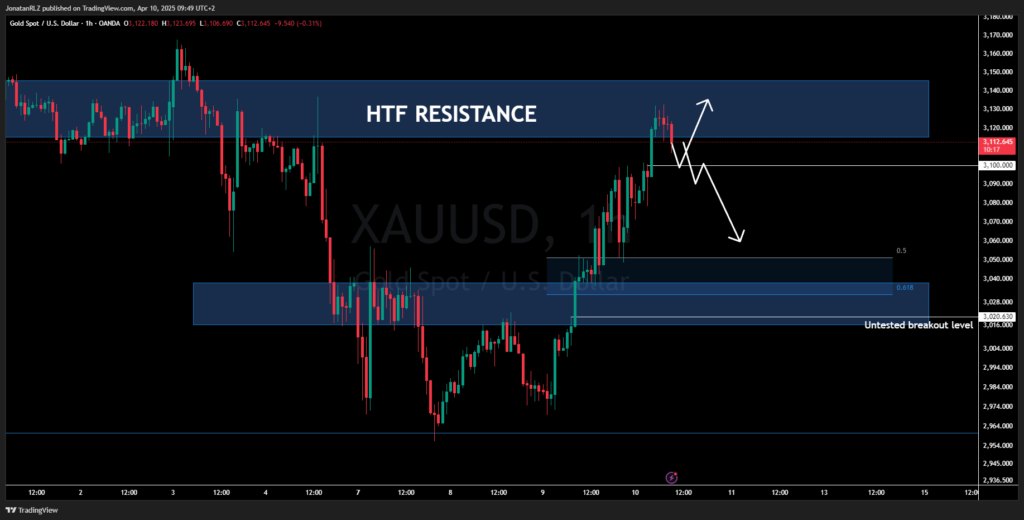
Zooming in for a closer look at gold’s intraday structure, we’re currently watching two critical zones.
To the upside, we have the high timeframe resistance area between $3,120 and $3,150. Price ran up sharply into this zone before getting rejected, now showing signs of short-term weakness on the lower timeframes. The local bullish trend is still intact for now, but a break below $3,100 could mark the start of a local reversal.
Below that, we have several key support levels to keep on the radar:
- The untested breakout level around $3,020
- The 0.618 Fibonacci retracement at $3,031
- And just above that, the 50% Fib level at $3,050, which also acted as the key HTF breakout zone
These are the most important intraday levels to track today. Whether we hold above $3,100 or lose it will likely dictate whether gold continues trending upward or starts forming a deeper pullback.
EUR/USD
It’s time to officially introduce EUR/USD to our daily market reports—something that’s been highly requested by the community. Today, we’re focusing on the higher timeframes, and tomorrow we’ll zoom in on the intraday levels as part of our end-of-week market review.
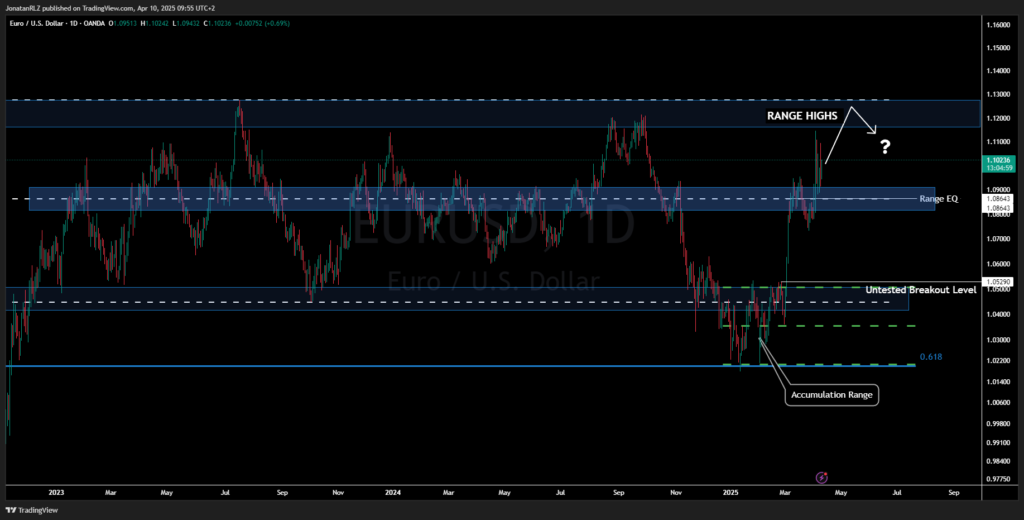
After a sharp move lower earlier this year, EUR/USD found support at the high timeframe 0.618 retracement, forming a clean accumulation range around 1.04. Following a surge in volatility in early March, price exploded higher, pushing back into the long-standing range that has been in play since late 2022.
Initially, we saw a sharp rejection at the range EQ (equilibrium) around 1.09, but EUR/USD quickly and confidently reclaimed that level. Price is now climbing steadily toward the range highs, suggesting a return to bullish control—at least for now.
But here’s where things get interesting:
EUR/USD hasn’t traded above this range since early 2022, so the 1.12 level is now a major high timeframe resistance zone. There’s a real risk that price could stall here and begin forming a distribution range, much like we’ve seen in the past. That makes 1.12 and 1.09 the two most important levels to monitor.
With volatility spiking and market conditions shifting quickly, many traders are struggling to find consistent footing in the intraday swings. In these moments, it’s often wise to zoom out and refocus on the broader structure—before drilling back into lower timeframe setups.
Thanks for reading today’s market update.
Be sure to check back tomorrow for our end-of-week review, where we’ll go deeper into the intraday picture and begin preparing for next week’s key scenarios.
Have a great Thursday—and good luck out there!
The content provided here is for informational purposes only. It is not intended as personal investment advice and does not constitute a solicitation or invitation to engage in any financial transactions, investments, or related activities. Past performance is not a reliable indicator of future results.
The financial products offered by the Company are complex and come with a high risk of losing money rapidly due to leverage. These products may not be suitable for all investors. Before engaging, you should consider whether you understand how these leveraged products work and whether you can afford the high risk of losing your money.
The Company does not accept clients from the Restricted Jurisdictions as indicated in our website/ T&C. Some services or products may not be available in your jurisdiction.
The applicable legal entity and its respective products and services depend on the client’s country of residence and the entity with which the client has established a contractual relationship during registration.


