Welcome back to another market update from PrimeXBT.
Today, we’re revisiting the key levels we’ve tracked throughout the week—starting with the S&P 500, and working our way through Bitcoin, Gold, and EUR/USD.
S&P 500 (SPX)
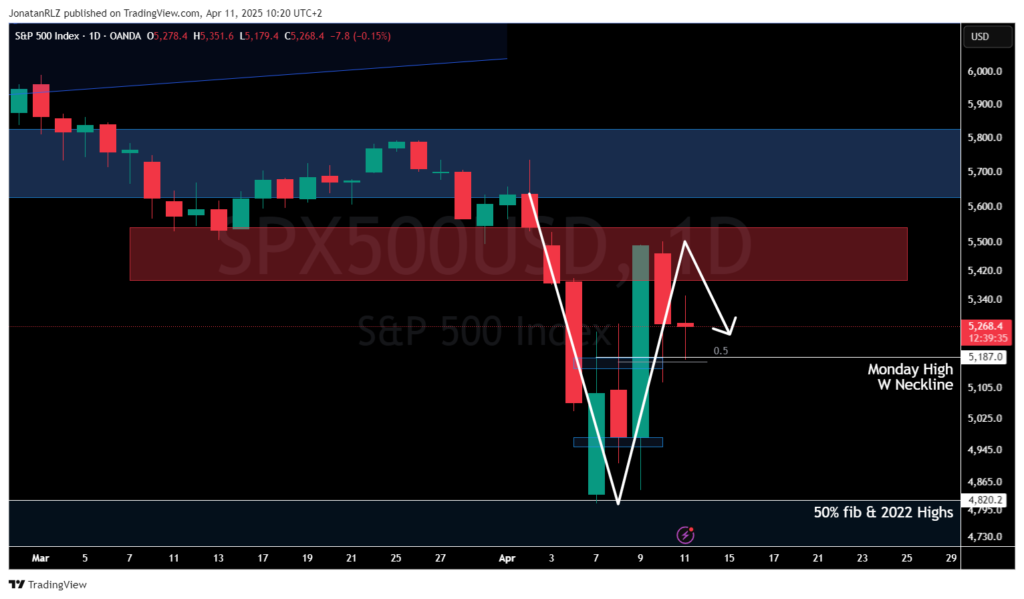
Looking at the daily timeframe, the S&P 500 saw a strong move upward earlier this week following Trump’s 90-day pause on tariffs for countries that do not retaliate. However, despite this strength, price has not yet reclaimed the key 5,500 resistance zone, which we’ve highlighted throughout the week.
This level remains a significant reference point. Until it’s reclaimed, the market could still be vulnerable to renewed volatility and potential weakness.
Intraday Perspective – 4H
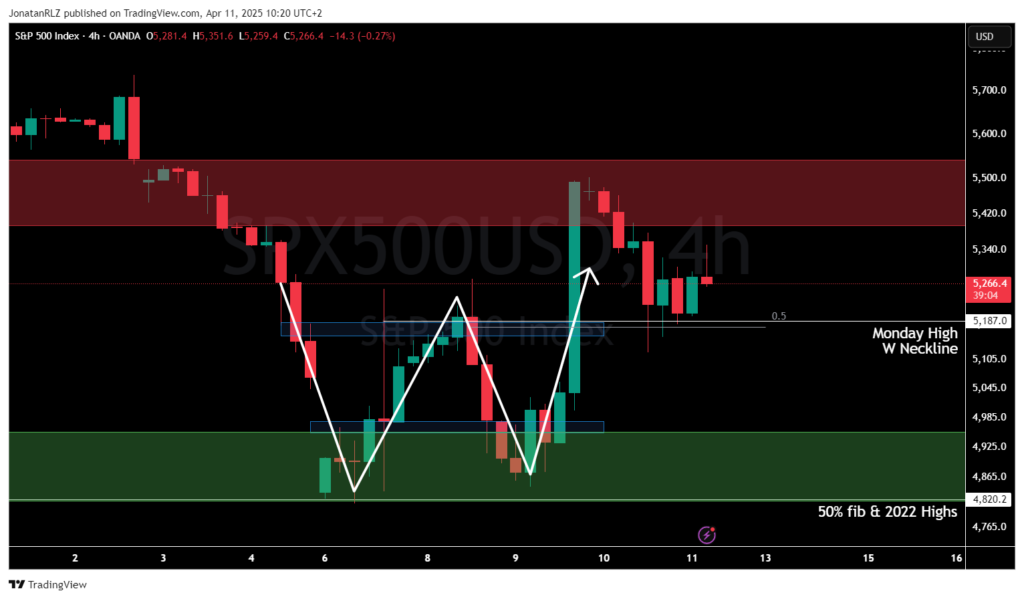
Zooming into the 4-hour chart, we can see that the Monday high and W-structure neckline at around 5,200 has been reclaimed, and price is holding above that level. Using a Fibonacci retracement from the right leg of the W-pattern to the recent swing high, we see a retest of the 50% level, further emphasizing the importance of using this Fib level in technical analysis.
The confluence of structure and Fib levels suggests there is still some optimism in the market, but whether it turns into sustained momentum will likely depend on how price behaves around 5,500. If this level remains unbroken, we could even see a range forming here, with the W-neckline acting as a potential range EQ.
Low Timeframe Perspective – 1H
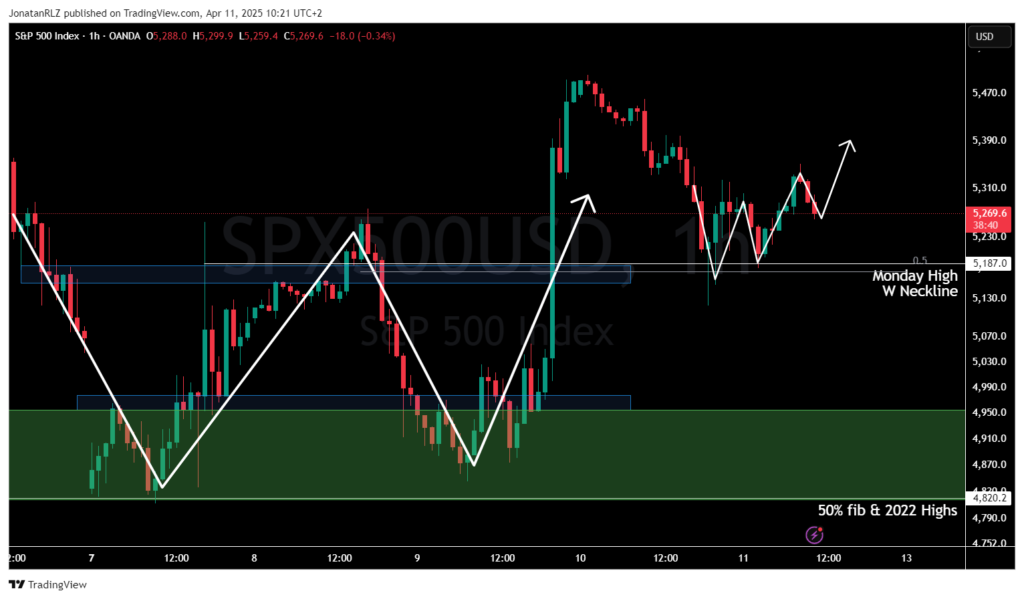
On the 1-hour timeframe, we also see a low timeframe W-pattern forming right on the neckline of the larger W-structure. This kind of simple structure shows how a basic concept like the double bottom can play a role across multiple timeframes, incorporating the fractal nature of price action. It supports the importance of clear and simple price action analysis.
Bitcoin (BTC/USD)
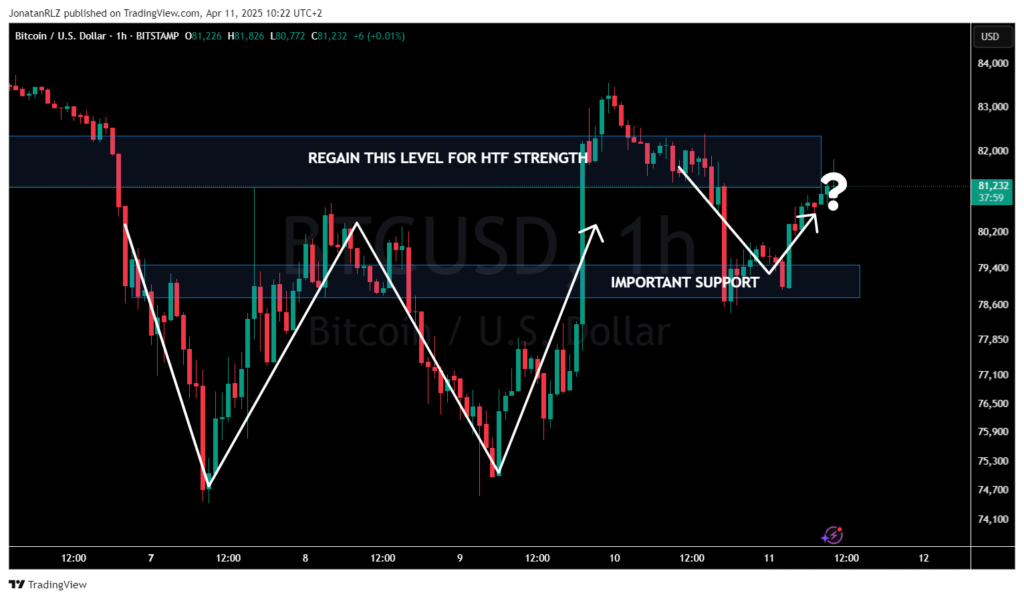
Moving on to Bitcoin, we’re seeing a similar setup to the S&P 500, with a high timeframe W-pattern and a current retest of the previously marked support zone from yesterday’s update. Bitcoin also shows a low timeframe W-structure right at the neckline, echoing the pattern seen on SPX.
The key question now is whether the $81K–$82K region will act as resistance again—or if this is the move that leads to a breakout. While there’s no way to know for certain, traders can use these levels to guide risk management decisions. A break above resistance may indicate a shift in momentum, while a rejection could suggest the structure remains in consolidation.
Gold (XAU/USD)
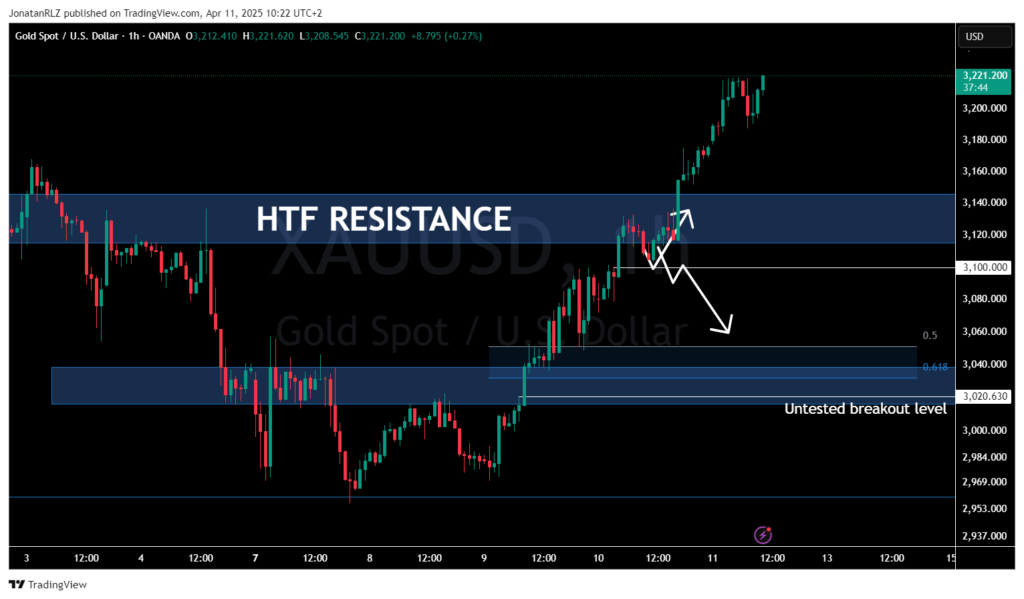
Gold saw a bullish reaction around the $3,100 zone, a level highlighted in yesterday’s report as the final swing low before the breakout into new all-time highs. This reaction underscores the value of a clear understanding of market structure and keeping analysis simple.
Throughout this week’s updates, many of the technical levels highlighted have played a key role in price action—reaffirming their utility for risk management, regardless of whether you’re focused on long-term positioning or short-term trades.
Now trading in price discovery, gold may need to form new structure and swing points before directional bias becomes more clear. The weekend could be volatile, and weekend gaps carry risk, so it’s worth approaching the next few days with caution.
We’ll revisit gold’s chart on Monday to see whether a new structure emerges and to evaluate the potential for trend continuation.
EUR/USD
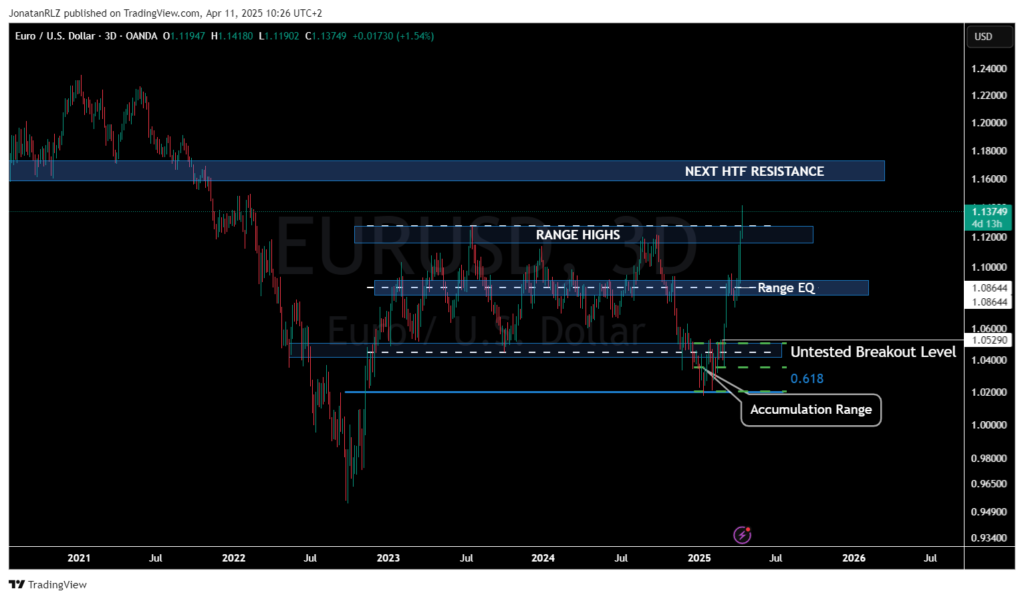
In yesterday’s update, we pointed out the 1.12–1.13 region as high timeframe resistance, and noted that EUR/USD hasn’t traded above this area since early 2022. As of this morning, EUR/USD is now trading above 1.13, placing it at a relatively elevated level compared to recent years.
With major shifts in global trade conditions unfolding, one question now is whether EUR/USD will remain above this level and begin forming new structure—possibly even signaling the start of a new trading cycle. If daily structure forms and holds above 1.12–1.13, it could suggest a shift in tone. Until then, caution and measured positioning remain key.
This wraps up the April 11, 2025 market update. As we’ve seen, volatility remains elevated, and the technical structures unfolding across major markets are worth watching closely.
In uncertain times, the most valuable tools you have are risk management, patience, and discipline. Stay flexible, stay informed, and remember—opportunity and volatility often go hand-in-hand.
We’ll be back on Monday with a fresh update. Until then, trade safe, and have a great weekend.
The content provided here is for informational purposes only. It is not intended as personal investment advice and does not constitute a solicitation or invitation to engage in any financial transactions, investments, or related activities. Past performance is not a reliable indicator of future results.
The financial products offered by the Company are complex and come with a high risk of losing money rapidly due to leverage. These products may not be suitable for all investors. Before engaging, you should consider whether you understand how these leveraged products work and whether you can afford the high risk of losing your money.
The Company does not accept clients from the Restricted Jurisdictions as indicated in our website/ T&C. Some services or products may not be available in your jurisdiction.
The applicable legal entity and its respective products and services depend on the client’s country of residence and the entity with which the client has established a contractual relationship during registration.


