S&P 500 (SDX):
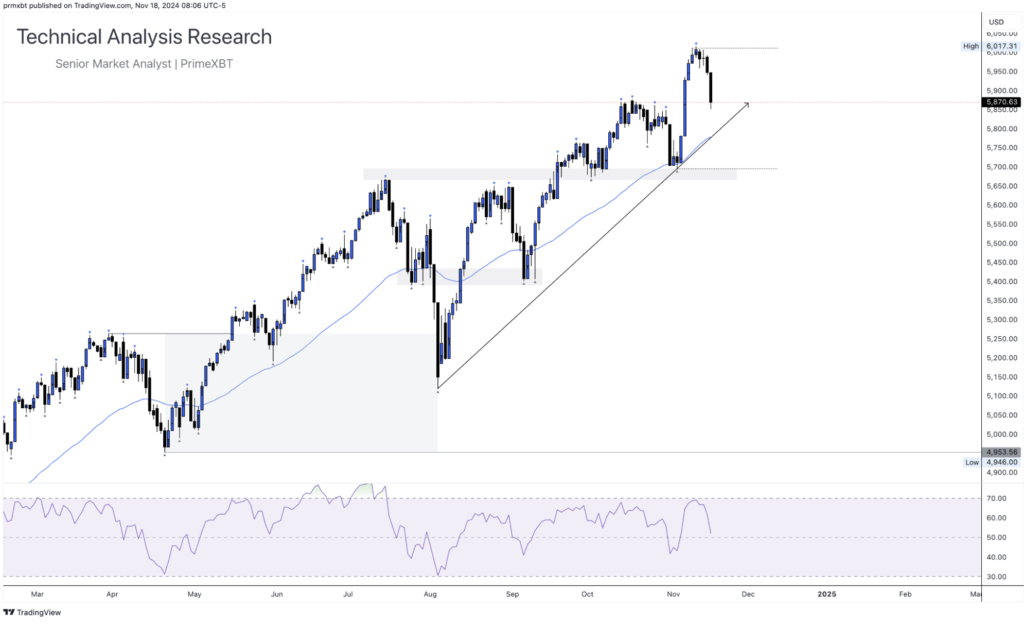
The S&P 500 has experienced a slight pullback over the past few days, with prices retreating below the $5,900 mark. The index has also moved back toward the internal ascending trend line highlighted in the chart below, which may now serve as a key area to watch for potential support.

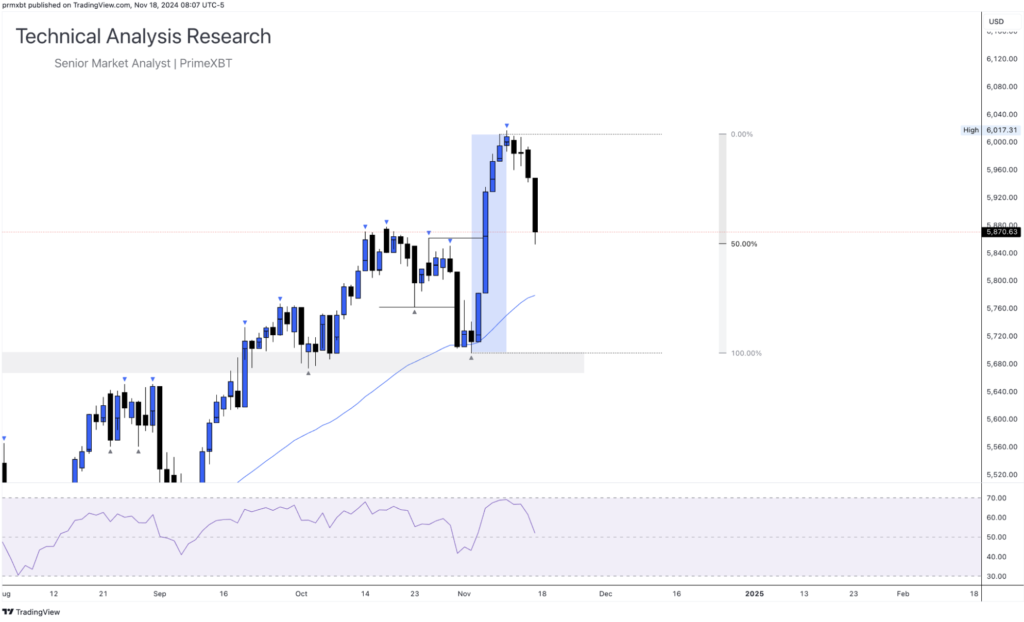
Examining the latest price action that propelled the market into a new all-time high and price discovery, it’s evident that we have retraced back to the 50% level of the Fibonacci tool. Moving forward, I will closely monitor the price action to determine whether support can be maintained above this level or if the structure will fail, signalling a potential move lower.
The content provided here is for informational purposes only. It is not intended as personal investment advice and does not constitute a solicitation or invitation to engage in any financial transactions, investments, or related activities. Past performance is not a reliable indicator of future results.
The financial products offered by the Company are complex and come with a high risk of losing money rapidly due to leverage. These products may not be suitable for all investors. Before engaging, you should consider whether you understand how these leveraged products work and whether you can afford the high risk of losing your money.
The Company does not accept clients from the Restricted Jurisdictions as indicated in our website/ T&C. Some services or products may not be available in your jurisdiction.
The applicable legal entity and its respective products and services depend on the client’s country of residence and the entity with which the client has established a contractual relationship during registration.


