Gold has once again broken into new all-time highs, continuing its impressive run with remarkable momentum. The strength of this move has caught the attention of traders and investors alike, as the metal pushes deeper into uncharted territory.
When an asset is in price discovery, traditional resistance levels become difficult to define. With no previous historical structure above current price, traders often turn to tools like the Fibonacci extension to help identify potential zones of interest.
We’ll start today’s analysis by looking at the daily timeframe and applying the Fibonacci retracement and extension levels to the recent impulse move. This helps establish technical projections that could serve as potential resistance or profit-taking zones as the uptrend continues.
Let’s take a closer look at how these levels are forming and where gold could be headed next—at least from a technical standpoint.
Fibonacci Structure and Key Extension Levels
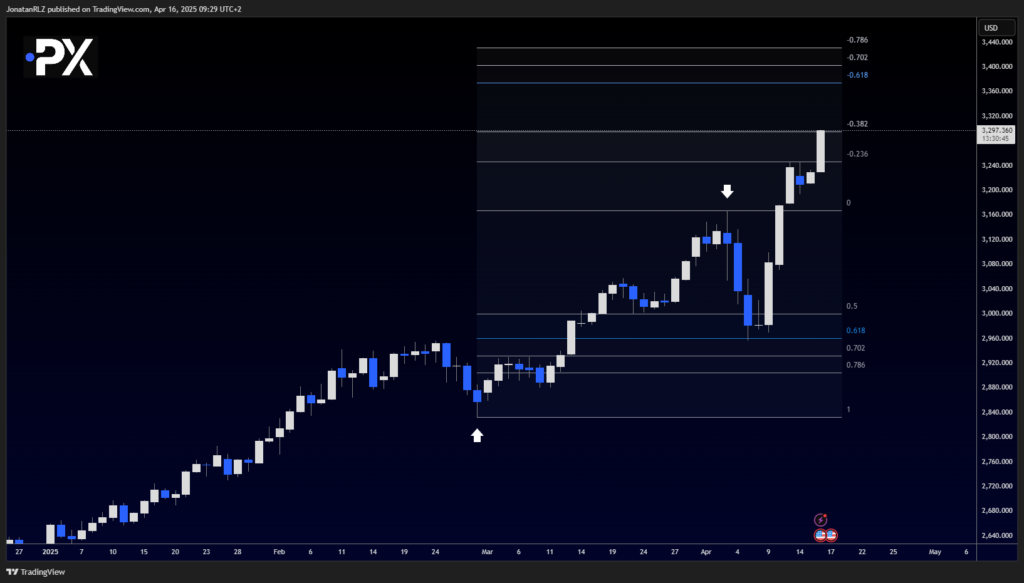
Looking at the daily chart, we’ve applied the Fibonacci retracement tool using the recent impulse leg. The Fib anchor low is set at point 1 (marked with a wide upward arrow), and the anchor high is placed at point 0 (marked with a wide downward arrow).
What’s notable is how gold continues to respect these levels. The most recent breakout took price above the -0.236 extension level, and we’re now testing the -0.382 level, which may act as short-term resistance.
If gold manages to break and sustain above this zone, the next significant extension level that some traders watch is the -0.618, often referred to as the Reload Zone (RLZ) in extension setups. This area can act as a potential target or reaction zone in strong momentum-driven moves.
Of course, there’s no certainty that price will reach this level, but in the absence of historical structure, these Fibonacci-based extensions provide a useful framework for navigating price discovery on the higher timeframes.
We’ll continue monitoring price behavior at the -0.382 and -0.618 levels to assess whether this breakout still has room to run—or if a consolidation phase may follow.

Intraday View – Gold (1H Chart)
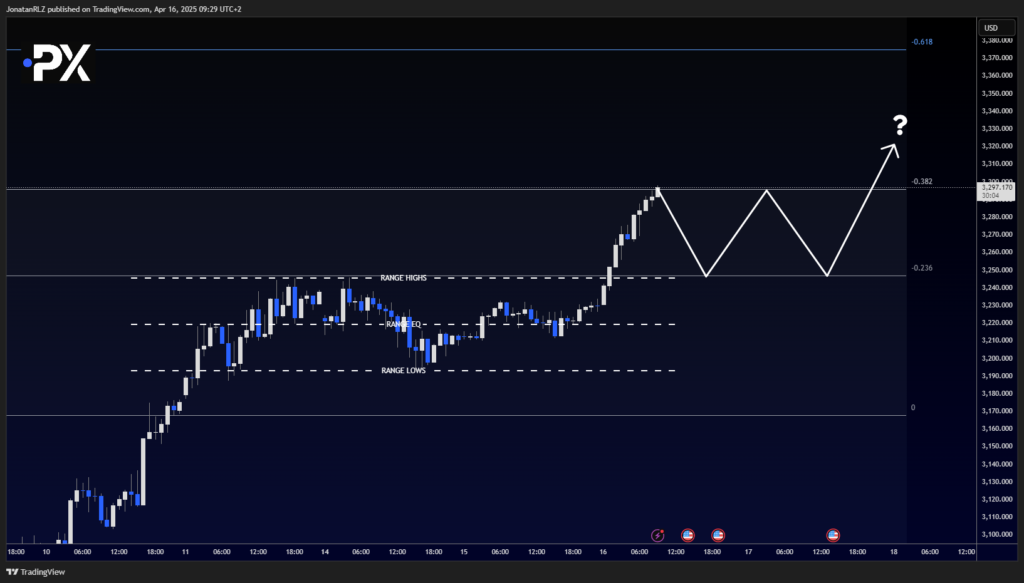
Zooming into the 1-hour timeframe, we can clearly see how gold is reacting to the previous range structure, particularly around the range highs. There is a strong confluence between the previous range high and the -0.236 Fibonacci extension level, which acted as resistance during the initial breakout.
Price is now testing the -0.382 extension, and traders may want to keep a close eye on how gold behaves around this area. These Fibonacci levels are proving significant, and may serve as potential guideposts for intraday direction.
Should price pull back, the previous range high near the -0.236 level could act as new support, while the current -0.382 level might remain a resistance zone, possibly forming the boundaries of a new short-term range.
Of course, future direction is unknown—but having these levels marked out allows traders to stay responsive and manage risk more effectively, regardless of which way the next move unfolds.

The content provided here is for informational purposes only. It is not intended as personal investment advice and does not constitute a solicitation or invitation to engage in any financial transactions, investments, or related activities. Past performance is not a reliable indicator of future results.
The financial products offered by the Company are complex and come with a high risk of losing money rapidly due to leverage. These products may not be suitable for all investors. Before engaging, you should consider whether you understand how these leveraged products work and whether you can afford the high risk of losing your money.
The Company does not accept clients from the Restricted Jurisdictions as indicated in our website/ T&C. Some services or products may not be available in your jurisdiction.
The applicable legal entity and its respective products and services depend on the client’s country of residence and the entity with which the client has established a contractual relationship during registration.


