Welcome back, everyone, to another technical update on the S&P 500.
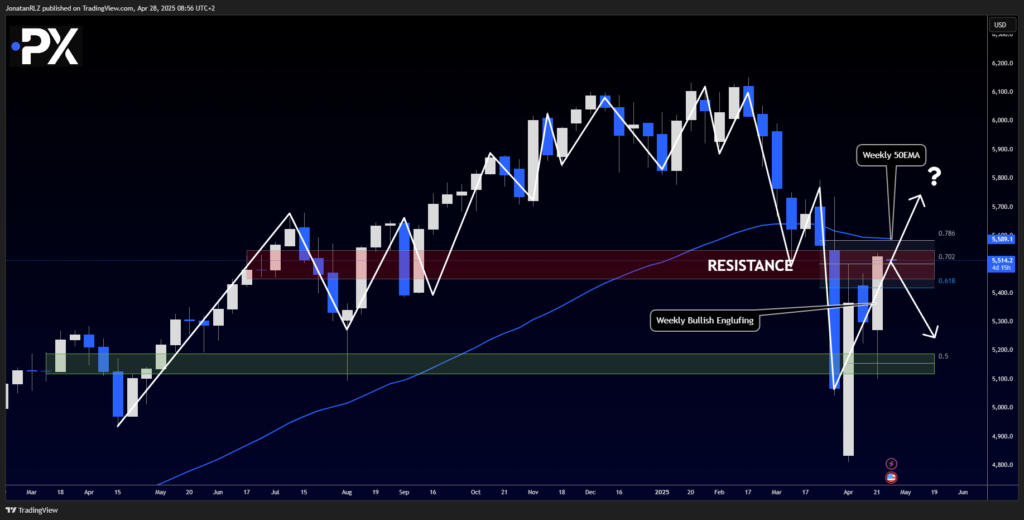
Looking at the broader picture, it’s important to highlight that the weekly candle not only closed above the key 5,500 level, but it also closed as a massive bullish engulfing candle, completely covering the range of the previous week’s price action.
While this can be interpreted as a strong bullish signal, we must also recognize that price is still trading within the broader high timeframe resistance zone, which aligns closely with the 0.786–0.618 Fibonacci retracement area.
It’s also worth noting that the weekly 50 EMA, marked as a blue line on the chart, is sitting right near the 0.786 Fibonacci level, just above this high timeframe resistance zone.
This adds extra confluence to the significance of this area and reinforces its importance as a major decision point for the index.
As shown here on the weekly chart, this week could prove critical for the S&P 500—and for broader risk sentiment across the markets.
A confirmed break and hold above this resistance zone would likely signal a renewal of bullish momentum, potentially setting the stage for a much stronger continuation to the upside.

Daily Timeframe – Confluence Builds at Key Resistance Levels
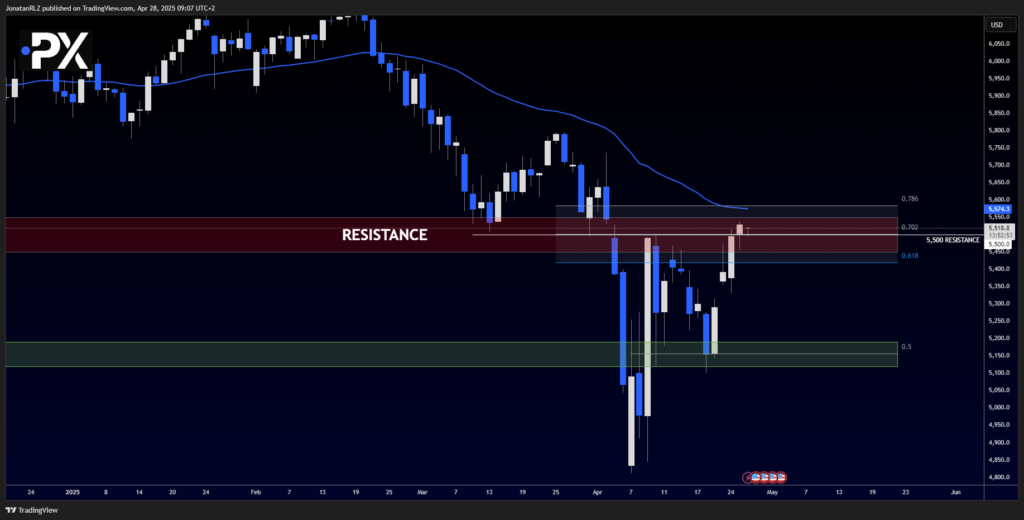
Looking at the daily chart, it’s worth highlighting that the same resistance zone we’ve been discussing—where the weekly 50 EMA sits—also lines up with the daily 50 EMA, just above current price around the 0.786 Fibonacci retracement level.
This adds even more confluence to this region, reinforcing it as a critical technical area to watch closely.
With multiple moving averages and Fibonacci levels clustering here across both daily and weekly timeframes, price action around this zone could be decisive for the short- to medium-term trend.
Let’s now move into the lower timeframes to see if any new intraday structures, developing ranges, or breakout setups are forming that we could monitor throughout today’s trading session.

1H Chart – Rising Wedge Forming as Momentum Slows
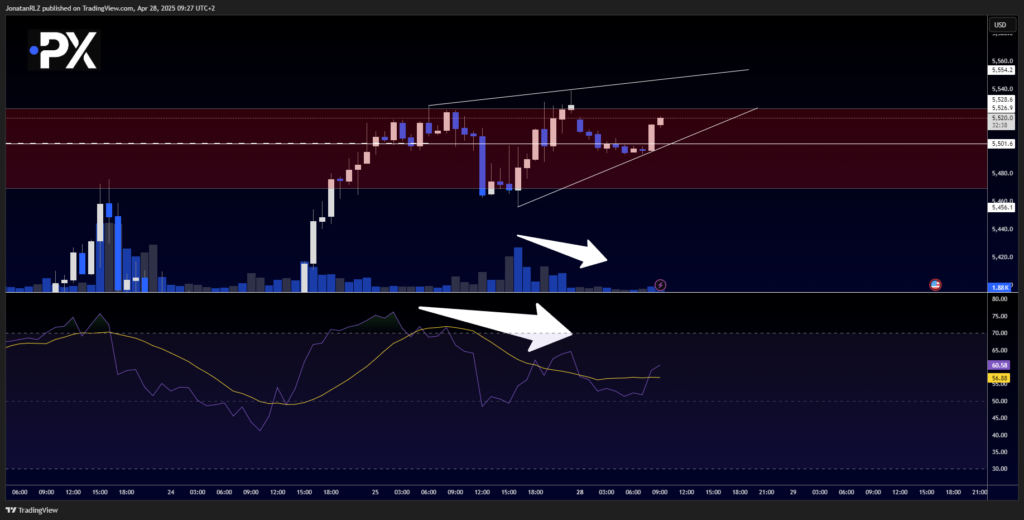
On the 1-hour chart for the S&P 500, we can now observe a classic rising wedge pattern developing.
A rising wedge is typically a bearish pattern, where both the upper resistance line and the lower support line slope upward—but the lower support line rises faster than the resistance line, causing the wedge to converge over time.
This structure tells us that while price is making higher highs and higher lows, the momentum behind the highs is weakening, as the highs rise more slowly than the lows.
Additional characteristics of a rising wedge include:
- Declining volume during the formation (note: the chart is using tick volume, and for even better accuracy, Futures market volume would ideally be analyzed)
- Bearish divergence on momentum indicators like the RSI—and we are seeing that here as well, with the RSI creating lower highs> while price continues upward
Confirmation of the pattern would typically occur on a break below the lower support line of the wedge. Ideally, this break would happen near or at a horizontal support level in addition to the trendline for added strength.
Often, a pickup in volume accompanies the breakdown, further confirming bearish momentum.
Of course, it’s important to remember that not all rising wedges break to the downside.
Invalidation of the bearish pattern would happen if price breaks above the wedge’s upper resistance trendline, signaling renewed bullish momentum instead.
We’ll continue to monitor this structure closely and will update you on any key developments in tomorrow’s market update.

The content provided here is for informational purposes only. It is not intended as personal investment advice and does not constitute a solicitation or invitation to engage in any financial transactions, investments, or related activities. Past performance is not a reliable indicator of future results.
The financial products offered by the Company are complex and come with a high risk of losing money rapidly due to leverage. These products may not be suitable for all investors. Before engaging, you should consider whether you understand how these leveraged products work and whether you can afford the high risk of losing your money.
The Company does not accept clients from the Restricted Jurisdictions as indicated in our website/ T&C. Some services or products may not be available in your jurisdiction.
The applicable legal entity and its respective products and services depend on the client’s country of residence and the entity with which the client has established a contractual relationship during registration.


