12 min read
 Ethereum (ETH) trades around $1,850 in early August 2026, below where most institutional forecasters put it a year ago. ETH is the token of the Ethereum blockchain — used to pay transaction fees, secure the network through staking, and serve as collateral across decentralized finance. This page sets out PrimeXBT’s price outlook for ETH through 2030 and out to 2050, the technical levels traders are watching now, and the catalysts that could move the price. The outlook is built on current market data and given as ranges, not false-precise numbers; where the picture is genuinely uncertain, we say so.
Ethereum outlook at a glance
- Current price: $2,560.17 per ETH.
- 2026 base case: $1,680–$2,090, a year of consolidation rather than a new bull market.
- Main bullish catalyst: Fed rate cuts and renewed spot-ETF inflows, with post-Fusaka scaling lifting network activity.
- Biggest downside risk: higher-for-longer Fed policy and a sustained break below the $1,717 support.
- Long-term view: a gradual recovery remains the base case, but forecasts beyond 2030 read as broad scenarios, not precise targets.
Live Ethereum price chart
Today (12 October 2026) Ethereum (ETH/USD) is trading at $2,560.17 per ETH, with a market cap of $312,558,997,966 USD. The 24-hour trading volume amounts to $9,944,960,816 USD. ETH price has changed by 2.56% in the last 24 hours. Ethereum’s circulating supply is 122,127,761 ETH.
Trading involves risk.
Ethereum price prediction 2026–2030 (yearly forecast)
The table sets our expected range for each year. Longer-horizon institutional targets, which rest on different assumptions and diverge sharply, are kept separate in the analyst section rather than blended in here.
| Year | Minimum | Average | Maximum |
|---|---|---|---|
| 2026 | ~$1,680 | ~$1,880 | ~$2,090 |
| 2027 | ~$1,900 | ~$2,570 | ~$3,340 |
| 2028 | ~$3,000 | ~$3,570 | ~$4,060 |
| 2029 | ~$2,880 | ~$3,340 | ~$3,830 |
| 2030 | ~$2,710 | ~$3,170 | ~$3,580 |
Ethereum price prediction 2026
Our 2026 outlook keeps ETH close to its early-August level of $1,850 — a tight range of roughly $1,680–$2,090, averaging near $1,880, with no return to prior cycle highs. A narrow band for crypto, and the signature of a market consolidating rather than trending.
For the rest of 2026, our month-by-month view holds ETH in a tight, slightly rising band — an August average near $1,869 climbing toward $1,899 by December:
| Month (2026) | Minimum | Average | Maximum |
|---|---|---|---|
| August | $1,682 | $1,869 | $2,056 |
| September | $1,689 | $1,876 | $2,064 |
| October | $1,696 | $1,884 | $2,072 |
| November | $1,702 | $1,892 | $2,081 |
| December | $1,710 | $1,899 | $2,089 |
Ethereum price prediction 2027
2027 is the recovery year: the path climbs from around $2,000 early on to roughly $3,100 by December, a full-year range of about $1,900–$3,340 averaging near $2,570. The step up rests on firmer network usage, not a single catalyst.
| Month (2027) | Minimum | Average | Maximum |
|---|---|---|---|
| January | $1,902 | $2,002 | $2,102 |
| February | $1,997 | $2,105 | $2,214 |
| March | $2,091 | $2,209 | $2,327 |
| April | $2,185 | $2,312 | $2,439 |
| May | $2,278 | $2,415 | $2,552 |
| June | $2,371 | $2,518 | $2,666 |
| July | $2,463 | $2,620 | $2,778 |
| August | $2,553 | $2,721 | $2,890 |
| September | $2,643 | $2,822 | $3,002 |
| October | $2,732 | $2,923 | $3,114 |
| November | $2,821 | $3,024 | $3,226 |
| December | $2,910 | $3,125 | $3,339 |
Ethereum price prediction 2028
2028 holds the cycle high: the path peaks mid-year near $3,760 before easing, for a range of about $3,000–$4,060 and an average near $3,570. The outlook places the next cyclical top in this window.
| Month (2028) | Minimum | Average | Maximum |
|---|---|---|---|
| January | $2,998 | $3,225 | $3,453 |
| February | $3,086 | $3,326 | $3,566 |
| March | $3,174 | $3,427 | $3,680 |
| April | $3,261 | $3,528 | $3,794 |
| May | $3,348 | $3,629 | $3,909 |
| June | $3,435 | $3,730 | $4,024 |
| July | $3,456 | $3,760 | $4,063 |
| August | $3,413 | $3,719 | $4,025 |
| September | $3,369 | $3,678 | $3,987 |
| October | $3,325 | $3,637 | $3,949 |
| November | $3,282 | $3,596 | $3,911 |
| December | $3,238 | $3,555 | $3,872 |
Ethereum price prediction 2029
2029 is the cool-down after the peak — a gentle decline through the year, ranging about $2,880–$3,830 with an average near $3,340.
| Month (2029) | Minimum | Average | Maximum |
|---|---|---|---|
| January | $3,195 | $3,515 | $3,834 |
| February | $3,152 | $3,474 | $3,795 |
| March | $3,109 | $3,433 | $3,756 |
| April | $3,067 | $3,392 | $3,718 |
| May | $3,024 | $3,351 | $3,679 |
| June | $2,981 | $3,310 | $3,639 |
| July | $2,953 | $3,285 | $3,617 |
| August | $2,938 | $3,275 | $3,612 |
| September | $2,924 | $3,265 | $3,606 |
| October | $2,909 | $3,255 | $3,601 |
| November | $2,895 | $3,245 | $3,595 |
| December | $2,881 | $3,235 | $3,589 |
Ethereum price prediction 2030
Our 2030 view spans roughly $2,710–$3,580, averaging near $3,170. Five years out the outlook leans on trajectory over precision, so read the month-by-month path below as a shape, not a set of dated targets.
| Month (2030) | Minimum | Average | Maximum |
|---|---|---|---|
| January | $2,866 | $3,225 | $3,584 |
| February | $2,852 | $3,215 | $3,578 |
| March | $2,837 | $3,205 | $3,573 |
| April | $2,823 | $3,195 | $3,567 |
| May | $2,809 | $3,185 | $3,561 |
| June | $2,795 | $3,175 | $3,555 |
| July | $2,780 | $3,165 | $3,549 |
| August | $2,765 | $3,154 | $3,542 |
| September | $2,750 | $3,143 | $3,535 |
| October | $2,735 | $3,132 | $3,528 |
| November | $2,721 | $3,121 | $3,521 |
| December | $2,706 | $3,110 | $3,514 |
Ethereum long-term price prediction: 2035, 2040–2050
Forecasts this far out are guesses dressed as numbers. No model can price a decade of halving cycles, technology shifts, and macro regimes that don’t exist yet, so read everything below as a rough trajectory rather than a target — the error bars widen with every year out. With that caveat, our long-range path trends steadily higher without ever hockey-sticking:
| Year | Minimum | Average | Maximum |
|---|---|---|---|
| 2035 | $3,618 | $3,979 | $4,318 |
| 2040 | $4,579 | $5,577 | $6,321 |
| 2050 | $6,511 | $7,361 | $8,109 |
What analysts and models say (compared)
Ethereum forecasts have rarely been further apart. Algorithmic models cluster between $1,700 and $2,630 for 2026, while named institutions have published 2026 targets from about $3,175 to $25,000 (CoinGecko compilation). Averaging figures built on incompatible assumptions would mislead, so they are laid out side by side instead.
| Source | Method | Ethereum view (2026 unless noted) |
|---|---|---|
| CoinCodex | Algorithmic | Avg ~$2,207 (range $1,747–$2,634) |
| Changelly | Algorithmic | Avg ~$2,070 (range $1,703–$2,542) |
| Standard Chartered (Geoff Kendrick) | Institutional | $4,000 end-2026, cut 47% from $7,500 in June 2026; $40,000 by 2030 |
| Citi | Institutional | $3,175 base case / $4,488 bull case (12-month) |
| ARK Invest (Cathie Wood) | Institutional, long-horizon | ~$25,000 (multi-year bull case) |
The spread is the story. Standard Chartered has revised hardest: the bank cut its end-2026 target from $7,500 to $4,000 in June 2026 — ETH sat near $1,745 that day — while holding a $40,000 target for 2030 (BeInCrypto). Geoff Kendrick called the drop cyclical, likening ETH’s slump to Amazon’s 2001 crash rather than a structural break. Citi trimmed its own outlook on stalled U.S. legislation and softer on-chain activity (CoinGecko). Anyone hunting for a single number won’t find consensus here.
Track record of this forecast
This is the first published PrimeXBT price forecast for Ethereum. From the next monthly review onward, this section will compare the previous forecast against ETH’s actual price on the update date, and explain any miss rather than smoothing it over.
Ethereum technical analysis
ETH sits between its two most-watched moving averages. It trades below the 200-day simple moving average of $2,166 — a sign the longer trend is still down — but above the 50-day average of $1,732, which shows it has recovered from its local lows. The RSI has held in neutral territory through late July, with no overbought or oversold extreme.
The support and resistance levels that matter now: support at $1,807, then $1,717, with a deeper demand zone near $1,500; resistance at $2,000, then $2,029, with a broader zone around $2,400. Reclaiming the 200-day average at $2,166 would be the clearest signal that the longer trend has turned. Broader signals leaned bearish through late July, with elevated volatility. For a primer on reading these signals, see PrimeXBT’s guide to crypto technical analysis.
Correlation with other assets
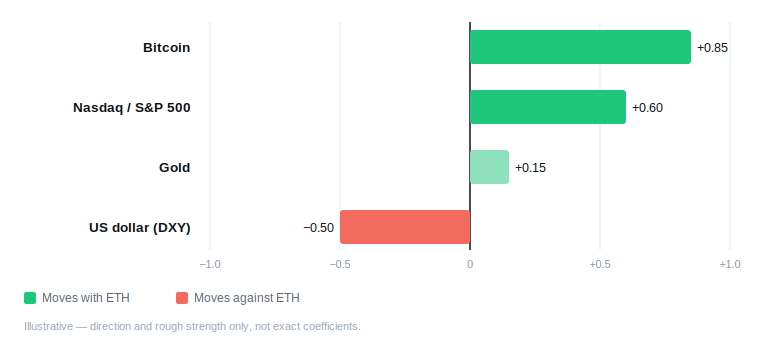
Ethereum still trades largely as a high-beta version of Bitcoin. Both fell together over the past week — ETH about 3.6%, Bitcoin about 2.8% — and ETH’s direction remains tied to Bitcoin dominance — when capital rotates toward Bitcoin, altcoins including ETH tend to lag. Against the U.S. dollar index (DXY), ETH has historically moved inversely: a stronger dollar has pressured crypto, a weaker one has supported it. Since spot ETFs pulled institutions into the market, ETH has also tracked risk assets like the Nasdaq more closely than it once did, which is why Federal Reserve policy now shows up quickly in its price. These are directional relationships, not fixed coefficients, and they shift over time.
Fundamental factors
Ethereum is the largest smart-contract platform, and ETH has uses beyond speculation: it pays for computation on the network, and holders can earn yield by staking it to help secure the chain. That staking demand locks up supply, which matters for price. Ethereum has no hard cap like Bitcoin’s 21 million, but a portion of transaction fees is burned, so net issuance depends on how heavily the network is used.
The most recent major upgrade, Fusaka, went live on December 3, 2025. It lowered node-operating costs and sped up settlement for layer-2 networks, and moved Ethereum onto a twice-yearly hard-fork schedule. Two forks a year turns network upgrades into steady increments rather than rare mega-releases — a cadence that rewards builders over traders. The next fork is expected in 2026, but no mainnet date has been confirmed at the time of writing, so it is not treated as a dated catalyst below. Spot Ethereum ETFs have given institutions a regulated way to hold ETH; their inflows and outflows have become a swing factor for the price, though flow figures are not published on a consistent enough basis to forecast precisely.
Upcoming catalysts
Only confirmed, dated events are listed. Macro policy is the clearest near-term driver, given how closely ETH now tracks risk assets.
| Date | Event | Potential impact |
|---|---|---|
| September 15–16, 2026 | FOMC meeting (with economic projections) | Bull if the Fed signals cuts; bear if it holds rates higher for longer |
| October 27–28, 2026 | FOMC meeting | Rate path drives risk appetite across crypto |
| December 8–9, 2026 | FOMC meeting (with economic projections) | Year-end policy signal for 2027 positioning |
| 2026 (date not yet confirmed) | Next Ethereum hard fork (twice-yearly cadence) | Further scaling for layer-2s; no mainnet date announced yet |
FOMC dates follow the Federal Reserve’s published 2026 schedule. The Ethereum fork is included without a date because none has been confirmed — an estimated date would be a guess, not information.
Bull case vs bear case
Bull case:
- The Fed shifts to rate cuts, and capital rotates back into risk assets including ETH.
- Spot Ethereum ETF inflows resume, adding steady institutional demand.
- Post-Fusaka scaling lowers costs and pulls more activity onto Ethereum and its layer-2s.
- Staking continues to lock up supply, thinning the float available to sell.
Bear case:
- Rates stay higher for longer, keeping risk assets under pressure.
- ETH keeps lagging Bitcoin, trading below its 200-day average with “Fear” sentiment.
- Analyst targets get cut again as sentiment sours.
- Weak momentum persists and support levels give way.
Invalidation levels. The bull case weakens if ETH closes below $1,717, the secondary support. The bear case is invalidated on a sustained break above $2,029 and, more decisively, a reclaim of the 200-day average at $2,166 — roughly 17% above the early-August price, and the line that would mark the longer downtrend as broken. The nearer downside trigger, $1,717, sits about 7% below spot. These are the same levels from the technical section, not separate numbers.
Historical performance
Ethereum’s history is a series of sharp cycles, not a steady climb — large drawdowns from each peak, then multi-year recoveries. In early August 2026 it again trades well below its record highs and below its own 200-day average. The shape matters more than any single past price, and no cycle is obliged to repeat the last one.
Is Ethereum a good investment in 2026?
The answer depends on time horizon and risk tolerance. Our outlook sees ETH roughly flat into year-end — a ~$1,880 average for 2026 — with the market consolidating rather than breaking out. The facts underneath are steadier: ETH is consolidating below its long-term average, sentiment is fearful, and the near-term path runs through Fed policy. Whether that reads as an opportunity or a warning is the reader’s call. PrimeXBT’s explainer on whether Ethereum is a good investment digs into the case.
How to trade Ethereum on PrimeXBT
On PrimeXBT you can take a position on Ethereum in either direction. CFDs on ETH can be traded long or short — see the guides to trading Ethereum and shorting Ethereum. Leverage magnifies gains and losses alike, so position sizing and a stop-loss matter on any trade. Trade on your own analysis and risk tolerance, and never risk more than you can afford to lose.
Trading involves risk.
How we build this forecast
This outlook is put together by PrimeXBT’s analysts, not lifted from a single price feed. We start from where ETH trades today, read its position against the 50- and 200-day moving averages and the key support and resistance levels, weigh the fundamentals — staking demand, network upgrades, ETF flows — and set all of it against the macro backdrop, chiefly the path of U.S. interest rates. The yearly ranges combine that technical read with the fundamental and macro picture; the long-range figures lean on trajectory rather than precision.
None of this is a guarantee. Crypto is volatile, the inputs shift, and one macro surprise can move ETH faster than any forecast expects. Treat every figure here as a considered estimate, not a promise — we revisit and update the outlook monthly as the data changes.
How much will Ethereum be worth in 2026?
Our outlook is roughly $1,680–$2,090 for 2026, averaging near $1,880.
How much will Ethereum be worth in 2030?
Our long-range view is roughly $2,710–$3,580, averaging near $3,170. Five-year forecasts are low-confidence by nature.
What will Ethereum be worth in five years?
See 2030 above. On this horizon, treat any single number as a direction rather than a target — the plausible range spans thousands of dollars.
Can Ethereum reach $10,000?
Not on our numbers — the top of our modeled range is about $4,060 (mid-2028). Reaching five figures would take a stronger cycle than the current picture shows.
Is Ethereum a good investment in 2026?
Mixed: a roughly flat near-term outlook, fearful sentiment, a price below its long-term average. The case runs both ways.
What will Ethereum be worth tomorrow?
This page updates monthly and does not publish next-day price targets — a single-day figure would be wrong within days and stay uncorrected until the next review. For the price right now, use the live chart above.
When is the next Ethereum upgrade?
The last major upgrade, Fusaka, went live on December 3, 2025. Ethereum now ships hard forks roughly twice a year, so another is expected in 2026, but no mainnet date has been confirmed yet.
Author



 Risk Disclaimer
The content provided here is for informational purposes only. It is not intended as personal investment advice and does not constitute a solicitation or invitation to engage in any financial transactions, investments, or related activities. Past performance is not a reliable indicator of future results.
The financial products offered by the Company are complex and come with a high risk of losing money rapidly due to leverage. These products may not be suitable for all investors. Before engaging, you should consider whether you understand how these leveraged products work and whether you can afford the high risk of losing your money.
The Company does not accept clients from the Restricted Jurisdictions as indicated in our website/ T&C. Some services or products may not be available in your jurisdiction.
The applicable legal entity and its respective products and services depend on the client’s country of residence and the entity with which the client has established a contractual relationship during registration.