The week for crypto came with many negative news out of the USA, first with credit card giants Visa and Mastercard suspending their plans of launching crypto-related products, which failed to take crypto prices lower initially. However, a second string of bad news caused a sudden drop in crypto prices on Thursday night, which wiped out almost $200 million worth of long positions within one hour.
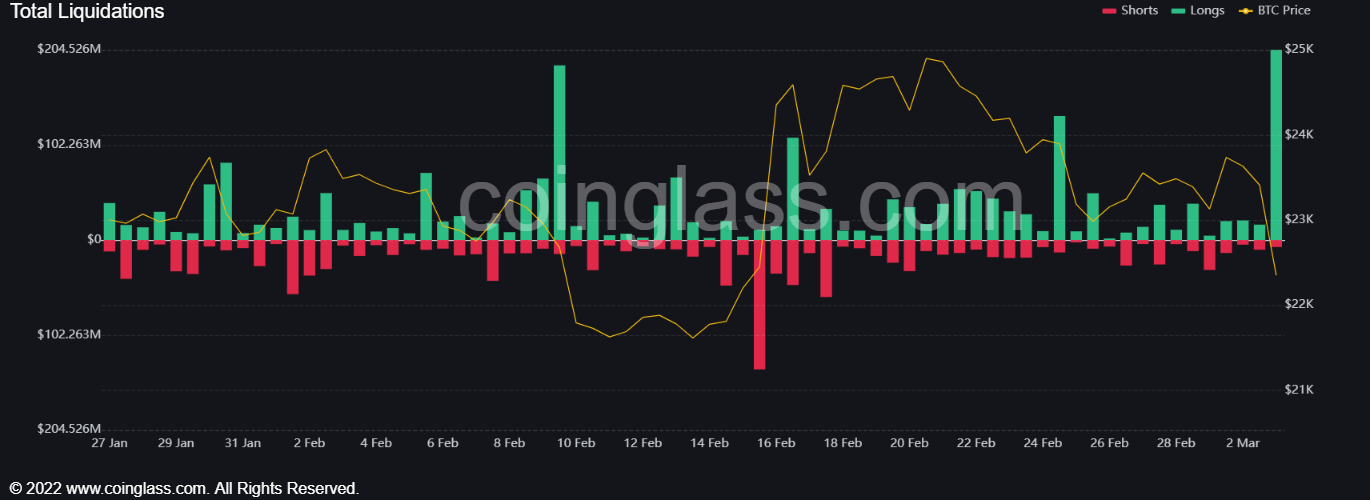
Troubles at Silvergate bank, which used to be one of two crypto friendly banks in the USA supporting fiat on and off ramps for crypto exchanges, were confirmed after the bank said that it had to delay its annual financial report filing due to the impact the FTX fallout had on the bank. This immediately led to Coinbase terminating its relationship with the bank, which intensified fears amongst the crypto community. Sentiment on the ground has already been soured after a series of warnings by the US SEC on various crypto projects as well as US senators’ continuous pursuit to drag Binance into muddy waters.
Weighed down by worries of a cut in fiat ramps in the USA, the price of BTC flashed dipped by 5% on Thursday, with altcoins also quickly losing an average of 10% in the immediate aftermath. Many altcoins that have recently risen have since been down by more than 20% for the week.
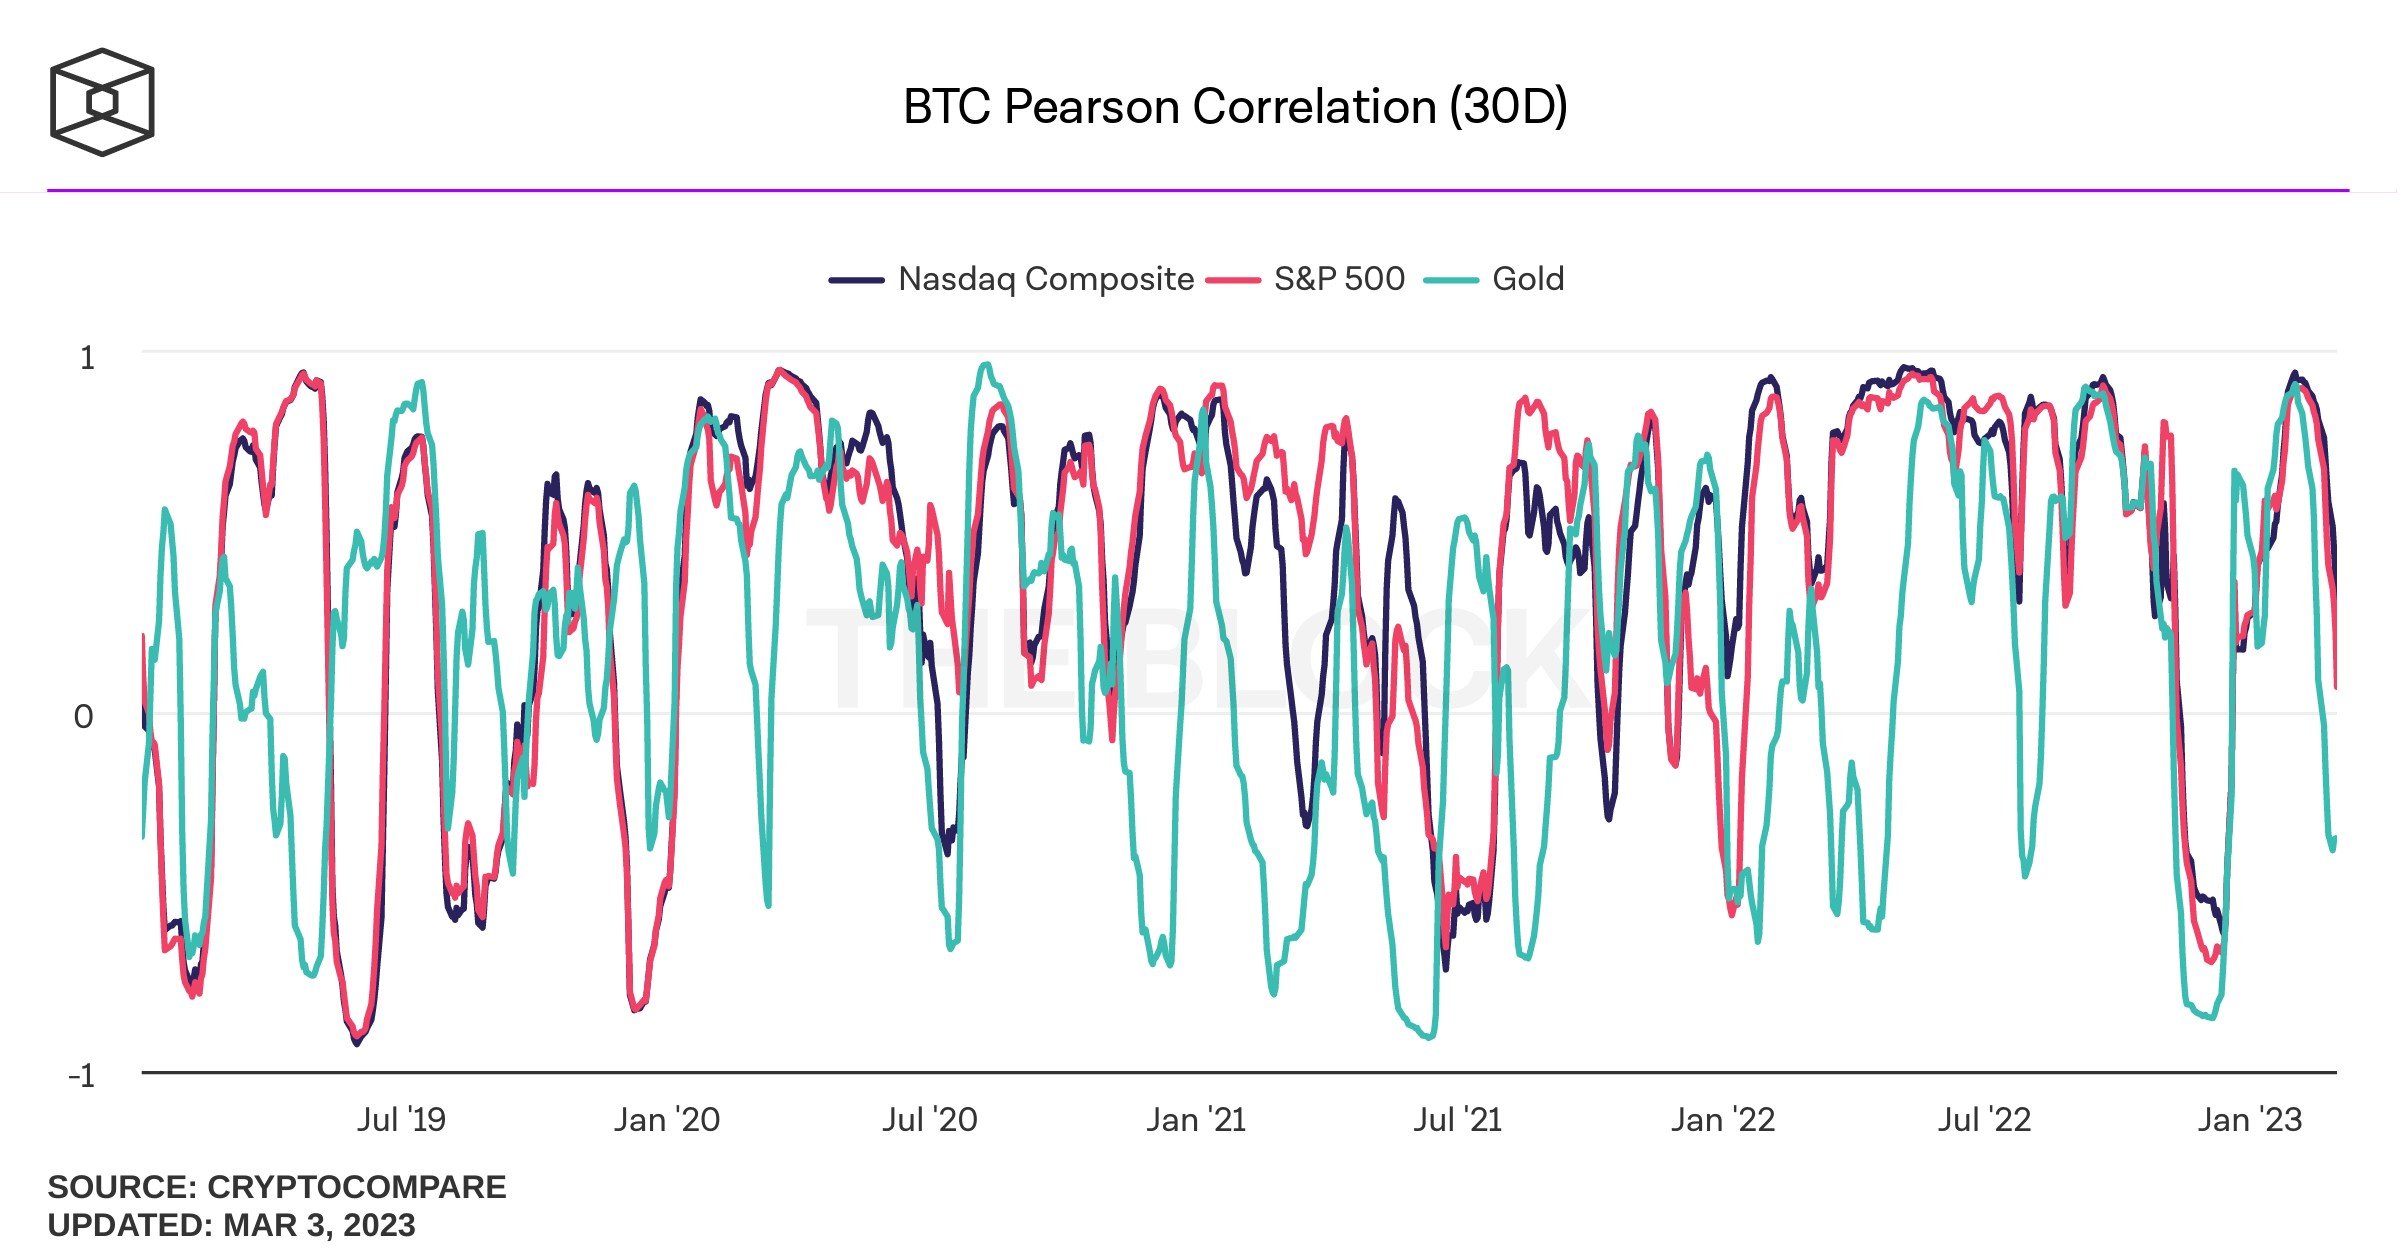
Crypto’s Correlation to Stocks Lowest in Two Months
With persistent FUD causing crypto prices to fall at a time when stocks have been rising, the correlation between stocks and crypto prices have fallen to a three-month low, with almost zero correlation between the two asset classes now.
As measured by a 30-day average coefficient, the correlation between the performance of stocks to BTC is showing a steep fall since being perfectly correlated in January 2023. In fact, the correlation between BTC and the Nasdaq and S&P has now fallen to 0 (no correlation) from 1 (perfectly correlated) barely two months ago, while its correlation to gold is now -0.5, which means BTC is now moving in the opposite direction as that of gold. That said however, this correlation is often rather jumpy and can change very fast. Thus, it can only be used as an indication of current market conditions and should not be used as a guide for the future price movement of any asset class.
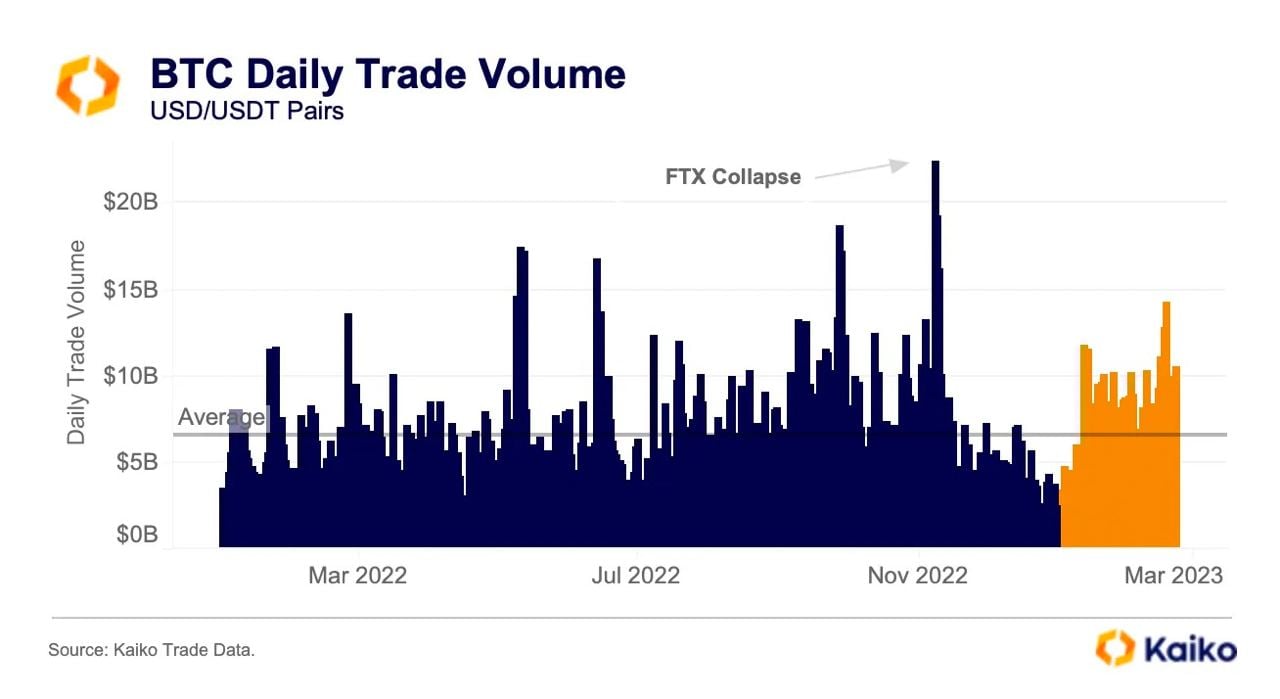
Despite the lacklustre price action towards the end of February, trading volume in crypto assets have doubled from its low of December 2022. In fact, the average trading volume in the past 2 months have been higher than the average trading volume last year, which shows that crypto trading activities are increasing even despite US clampdowns. Whether this increase in volume is a sign of more players entering the market, which is a sign of adoption, or are leaving the market due to US regulations, which is a negative, is still unknown. Only time will tell where this increase in trading volume is taking the market.
More BTC Bought Than is Issued
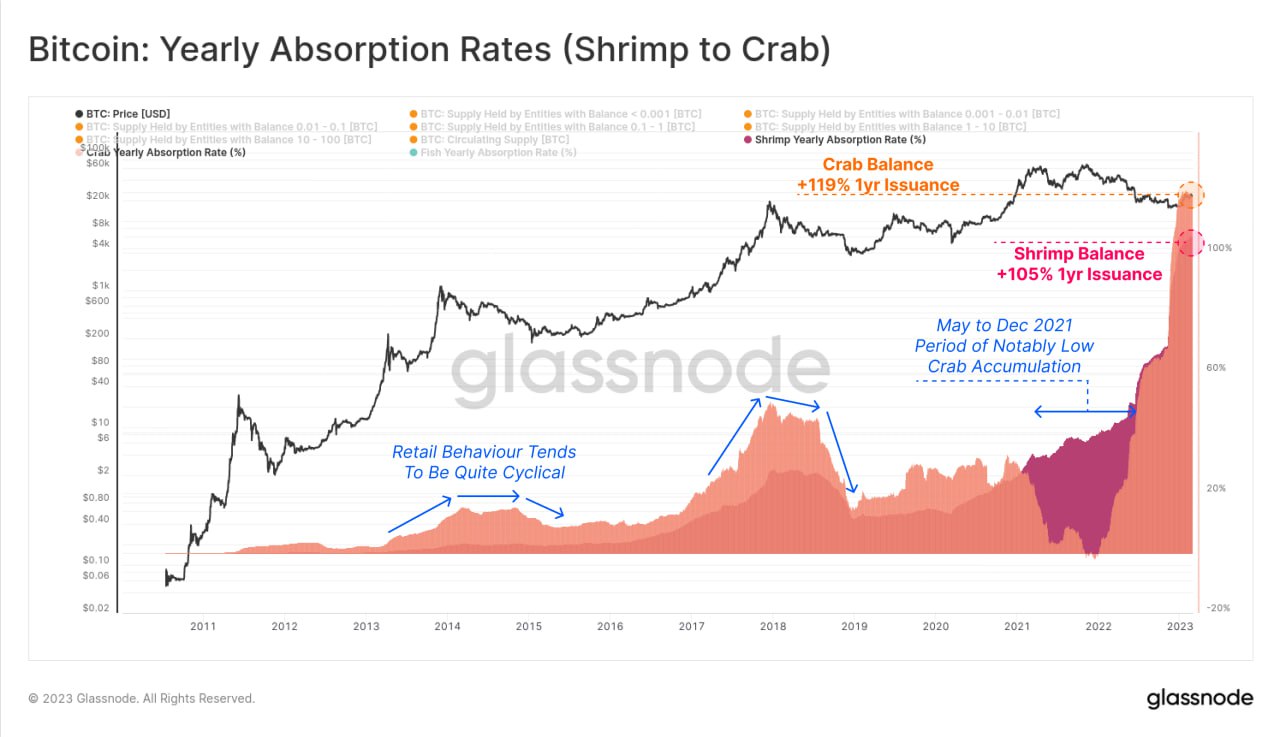
One positive implication that can be deduced from the rise in trading volume is that the number of smaller holders is also increasing, as can be seen by the fast growth in the number of smaller BTC holders so far this year in the diagram below. The amount of BTC held by this group of holders have increased notably since the end of 2022, hitting new ATHs as at the time of writing. Specifically, holders under the Crab category of investors holding between 1 to 10 BTC is at 119% of BTC’s annual issuance, which means these investors have bought up 19% more BTC than the amount of BTC that will be issued in a year. Those in the Shrimp category who hold less than 1 BTC, have accumulated 5% more BTC than is issued. In total, these two groups of holders are absorbing 24% more BTC than is issued on an annualized basis. This is in sharp contrast to 2021 when more BTC was being issued than were bought by this group of investors.
This aggressive rate of the removal of the circulating supply of BTC is escalating its supply scarcity even though price is not showing a lot of volatility. Should this rate of accumulation continue, there would be very little BTC available for sale by the time the next bull run comes, which may reinforce BTC’s upward price pressure in the next bull cycle.
SOPR Ratio Shows BTC Has Bottomed
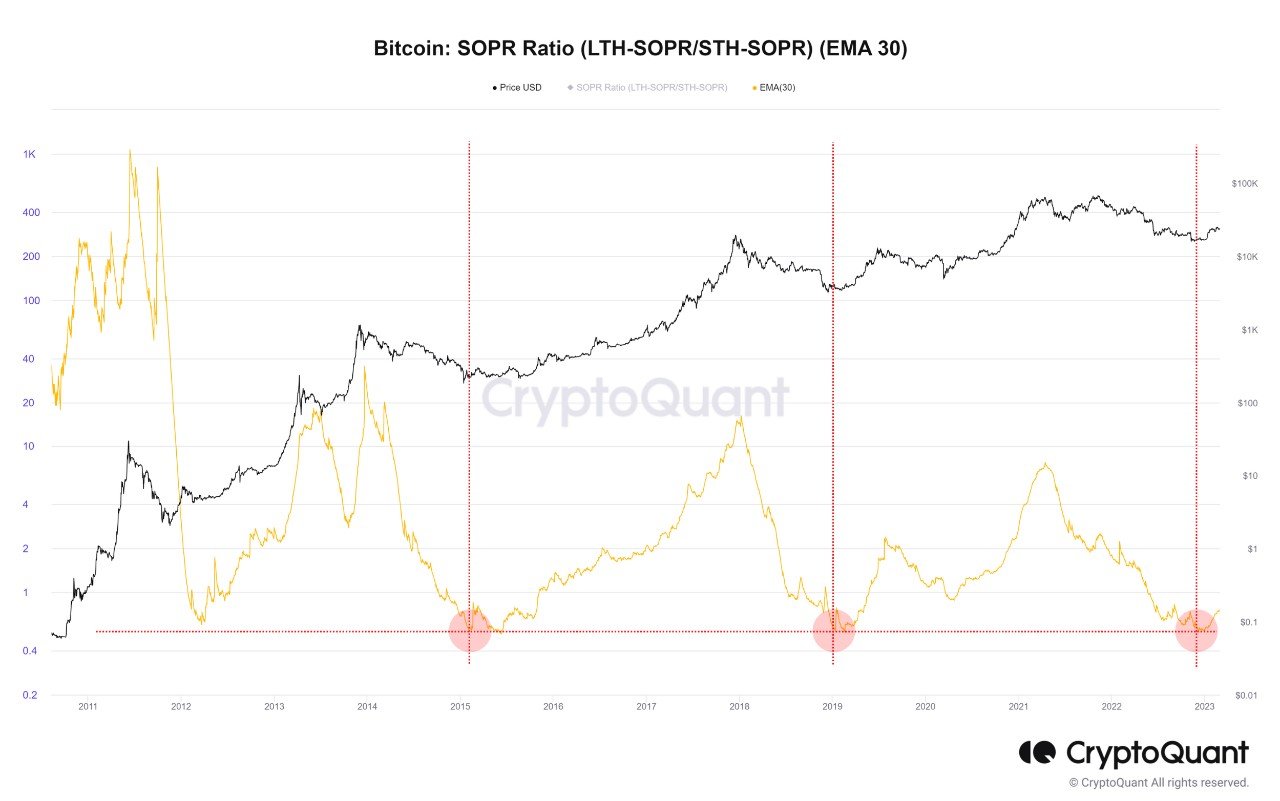
The SOPR LTH/STH Ratio, which is a metric derived by dividing the long-term holders’ SOPR with short-term holders’ SOPR, indicates that BTC may have already bottomed.
Using a 30-day moving average to smooth out kinks, we can see from the diagram below that the value of this ratio bottomed between 0.5 and 0.6 in every past cycle before rising again. This phenomenon can be observed in our current cycle as well – the value of this indicator hit a low of 0.57 in November last year during the FTX saga. That ratio has since risen to about 0.7 currently. In previous cases, when the ratio turned to move higher significantly, the price of BTC bottomed out. Applying the same phenomenon to our current cycle implies that BTC may have bottomed out last November, even when its price action in recent days has been bearish. This implies that even if BTC should dip lower in the days to come, it may not revisit the low point set in November during the FTX saga but instead form a higher low.
ETH Developers Push Shanghai to April
ETH developers have pushed back the highly-anticipated Shanghai hard fork by approximately two weeks, from late March to within the first two weeks of April. The delay was announced at an Ethereum developer meeting on 2 March. The two-week delay disappointed some traders, who took to selling Shanghai-related coins like ETH itself and liquid staking platform token LDO. However, once Shanghai goes underway in April, interest in these tokens may return.
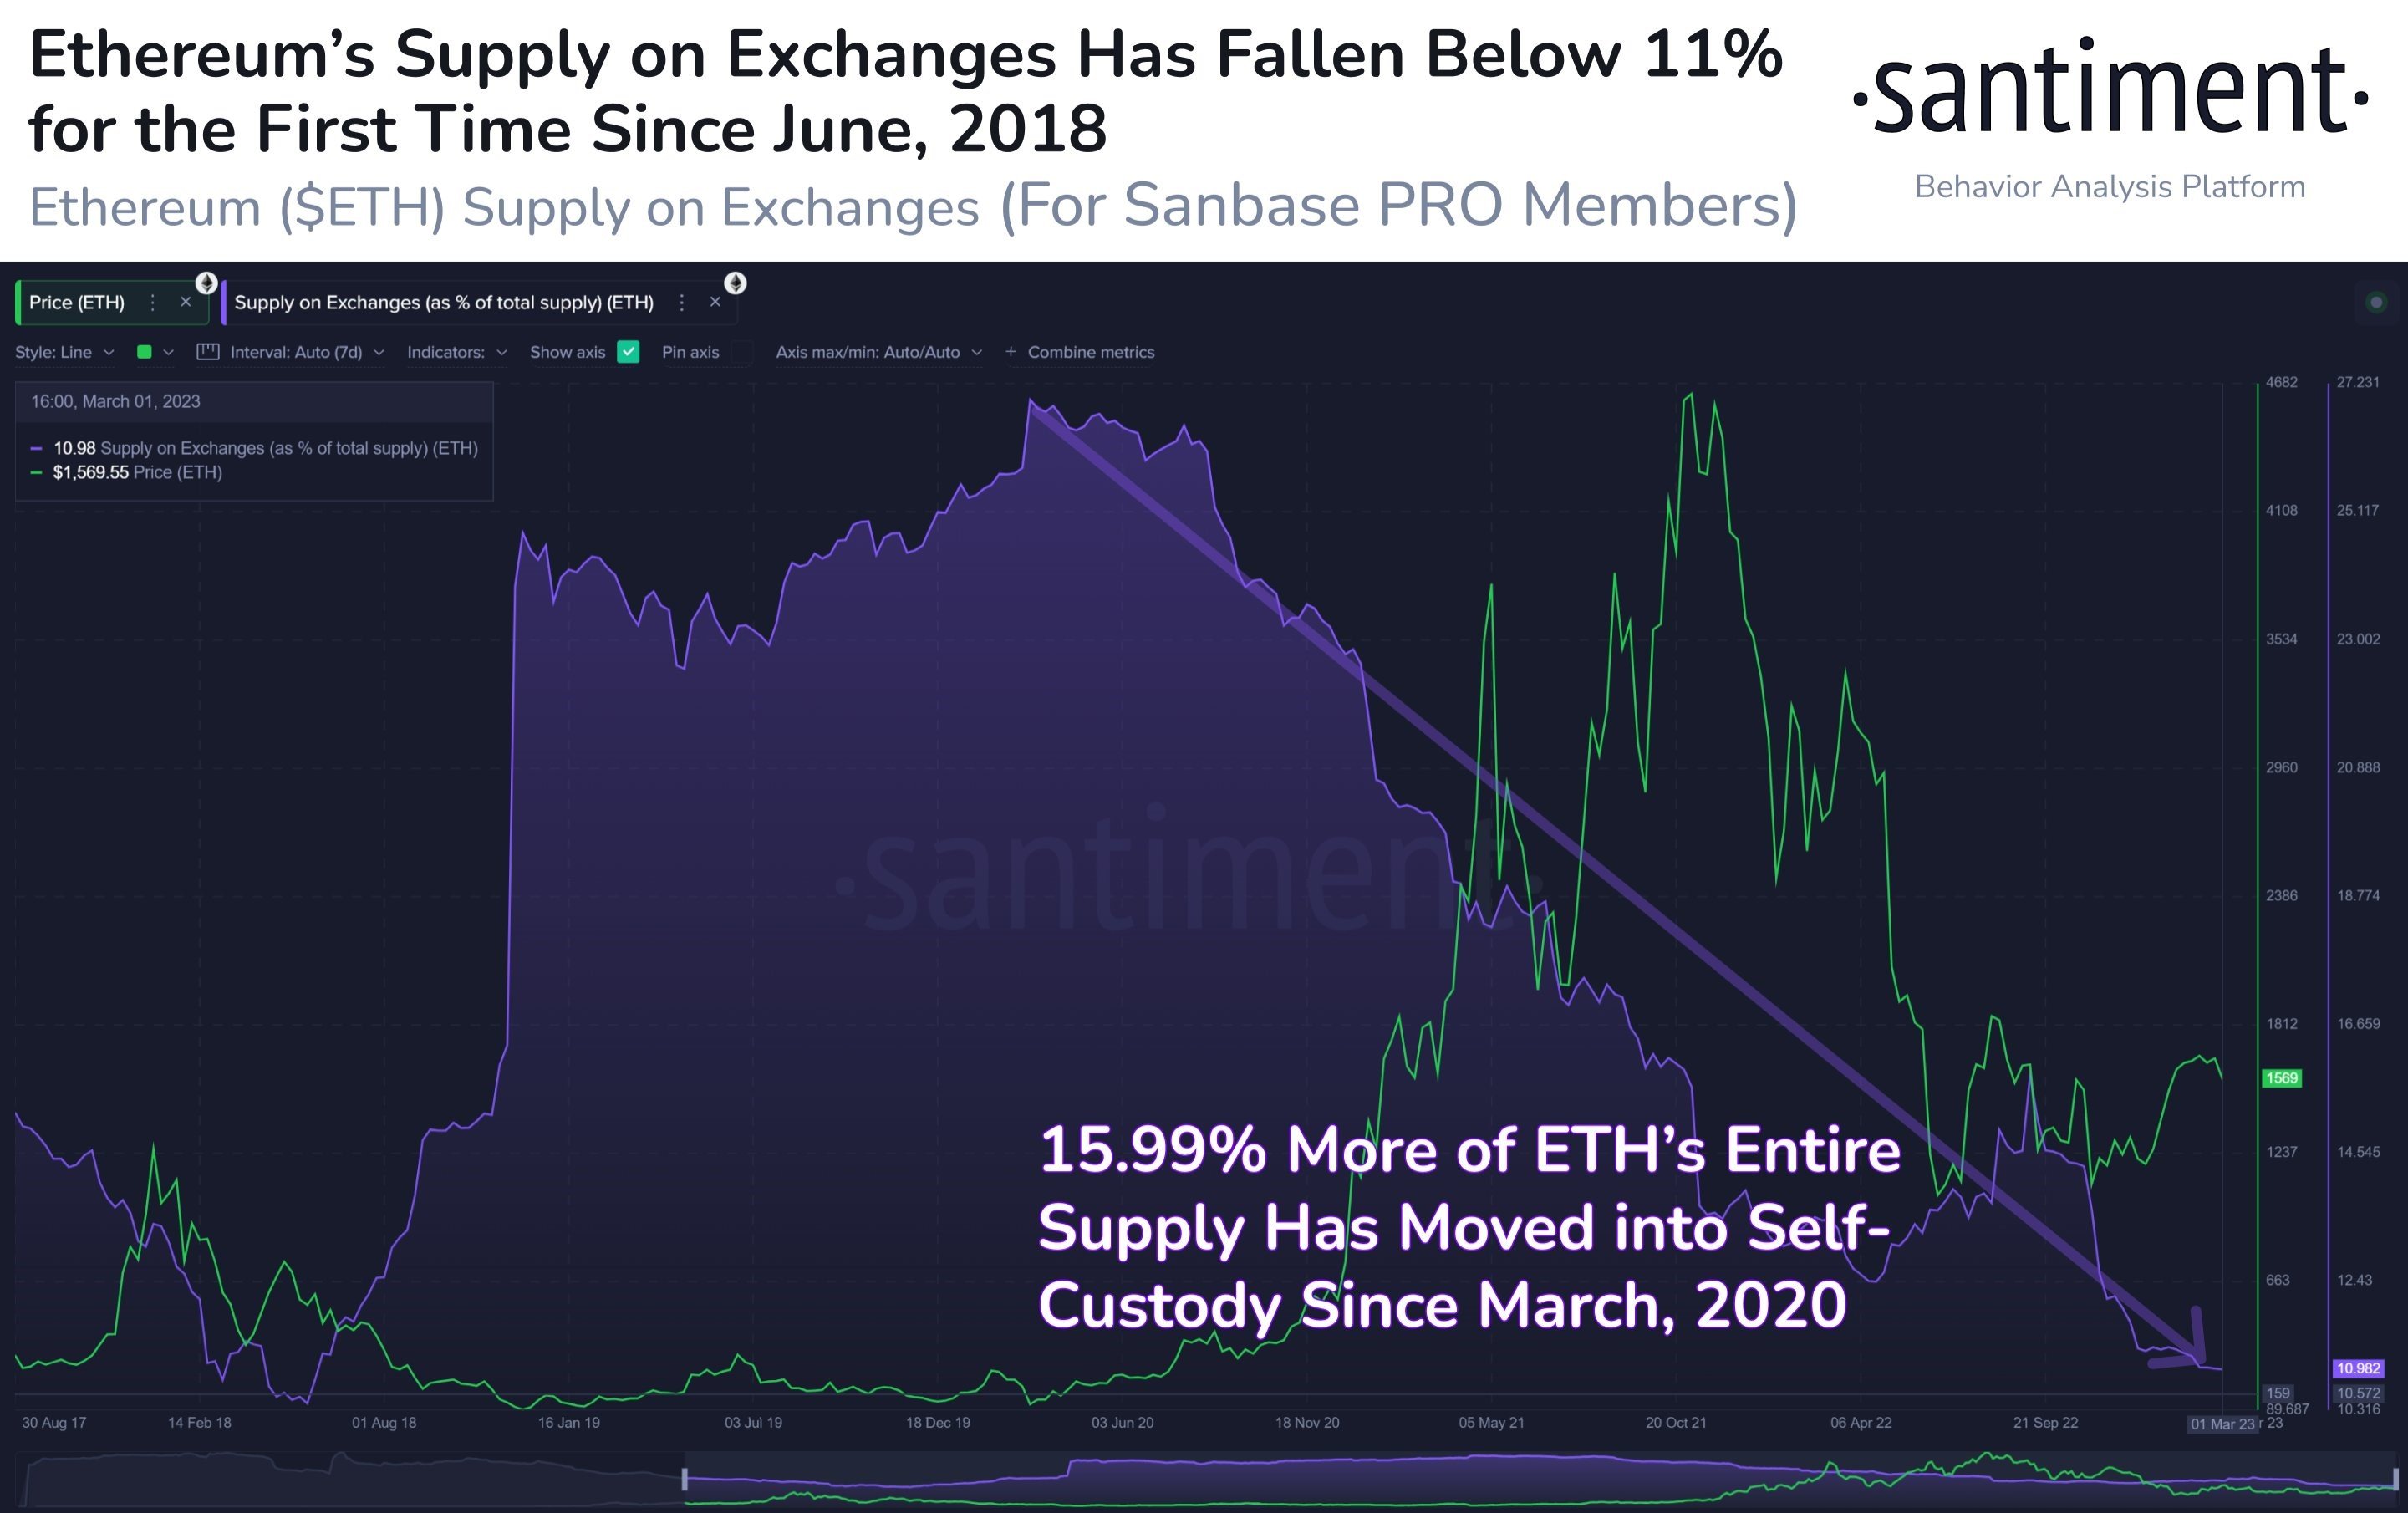
Meanwhile, while short-term traders with no holding power close off their trades, longer term investors have been making use of the recent weakness in price to accumulate even more ETH and remove for safe-keeping, or even to stake in Shanghai. This can be evidenced by the supply of ETH on centralised exchanges falling again in March to a five-year low, to around 11% of its total supply.
The reduction of ETH’s supply on exchanges could imply lesser selling pressure in the days ahead even as negative headlines continue to pressure crypto prices.
Interesting Large Transactions Seen on LINK
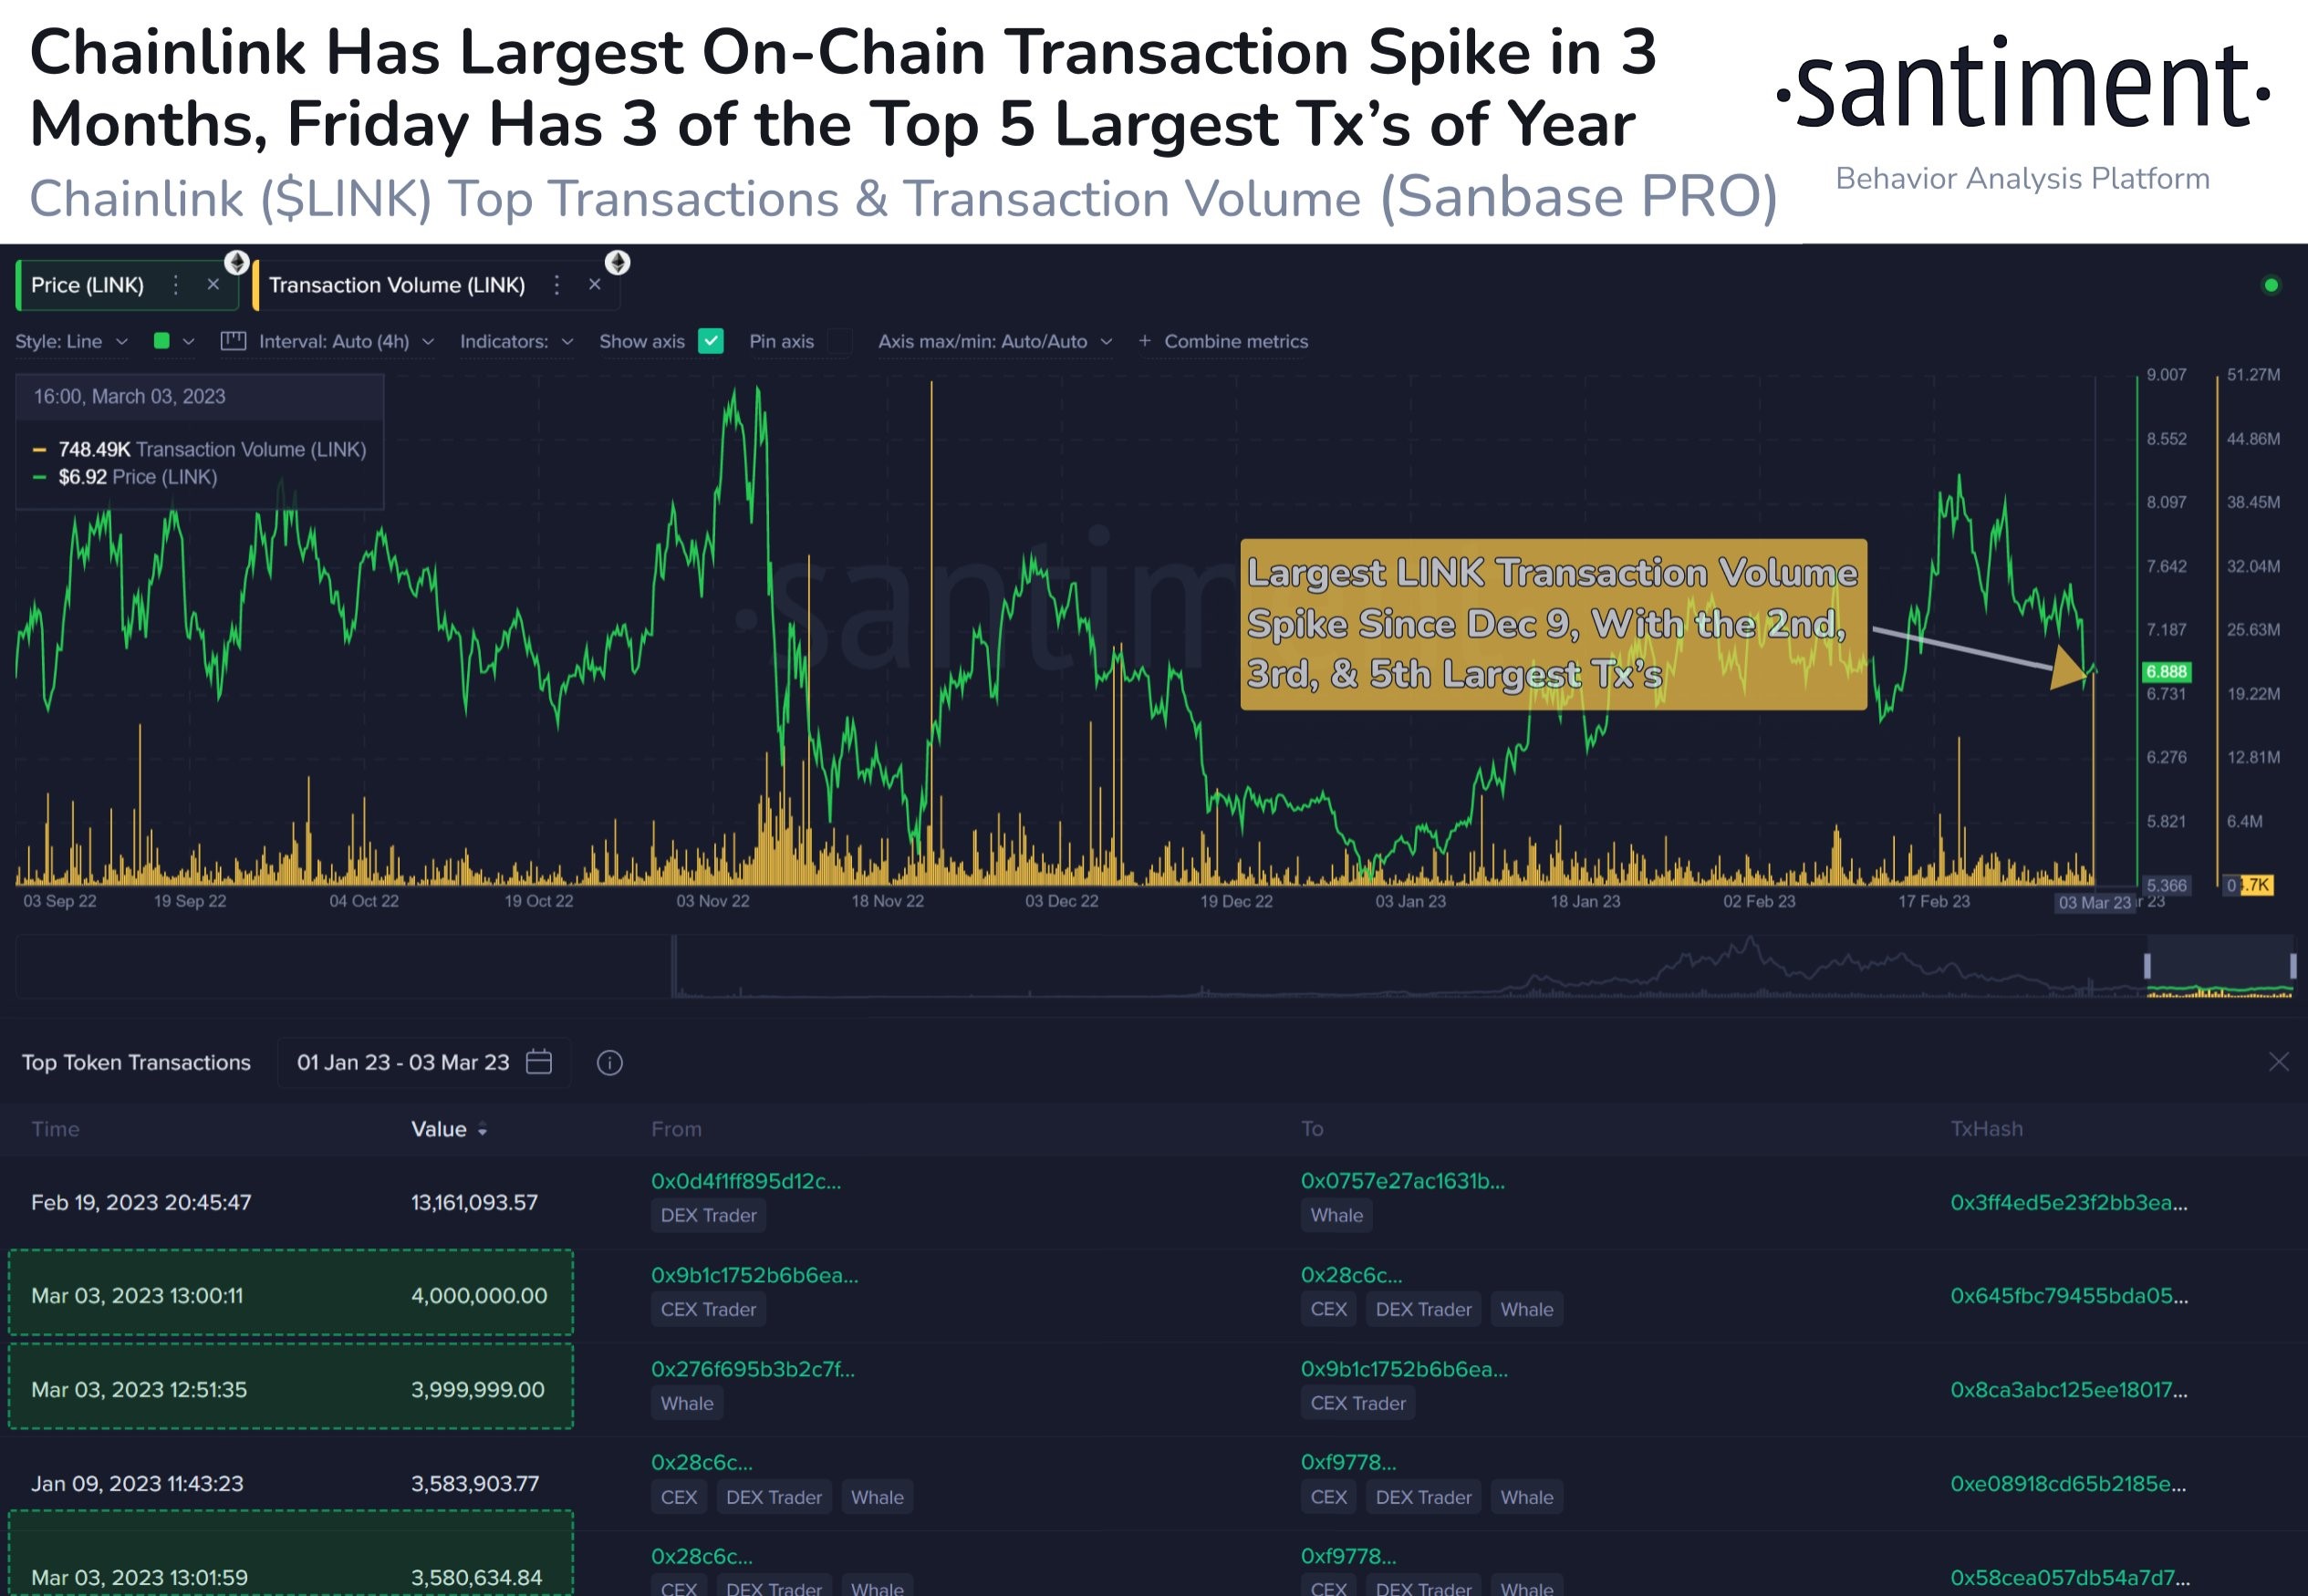
Meanwhile, in the midst of a weaker market, LINK witnessed 3 big whale transactions all occurring within 11 minutes of each other during Friday’s final hours. In total, 11.6 million LINK were moved to whale wallets as the price of LINK fell. This could suggest a buy-on-dip by LINK whales who were taking advantage of the price drop to accumulate even more LINK. This purchase could be on the back of recent positive development by the Chainlink team. Recently, the team has launched a new project called Functions, which is a serverless developer platform that allows anyone to easily connect a smart contract to any Web2 API and run custom computations using Chainlink’s highly secure and reliable network. This project may allow users to integrate smart contracts into web2 services like Google, AWS and even AI through using LINK, which could have huge positive implications for Chainlink’s adoption.
Traditional Markets
As for the traditional markets, US stocks had a positive week as bond yields started to drop after Atlanta Fed President Raphael Bostic said he thinks the central bank can keep its interest rate hikes to 25-bps rather than the half-point increase favored by some other officials. The yield on the benchmark 10-year Treasury notes has since dipped below the 4% threshold as at the close of Friday, leading stocks and gold higher while putting a cap on the dollar.
As a result, the Dow posted a 1.75% gain and snapped a four-week losing streak, while the S&P closed higher by 1.90%, its first positive week in the last four. The Nasdaq ended the week 2.58% higher, while the DXY dipped by around 0.6%. The more positive outlook from China’s better than expected manufacturing data released over the week also promoted a more risk-on trading approach, leading oil prices higher. Brent rose by around 3.5% and the WTI ended the week 4.2% higher. Gold also benefited from the better sentiment out of China, gaining 2.43%, while Silver edged up by 2.24%.
This week brings more Fed talk as we move one week closer to the Fed meeting scheduled for March 21-22. Wednesday’s Fed Chair testifying at the Semi-Annual Monetary Policy Report before the House Financial Services Committee could be keenly watched by traders as they try to get an early preview of what is to come from Powell in the upcoming Fed meeting, while the non-farm payrolls employment number release on Friday would be closing the week. How this data performs could have a significant impact on how much the Fed decides to hike at the next meeting after January’s blowout number showed a stronger labour market than what the Fed expected. Meanwhile, the RBA and the BOJ would also be holding their own monetary policy meetings on Tuesday and Friday respectively this week.
The content provided here is for informational purposes only. It is not intended as personal investment advice and does not constitute a solicitation or invitation to engage in any financial transactions, investments, or related activities. Past performance is not a reliable indicator of future results.
The financial products offered by the Company are complex and come with a high risk of losing money rapidly due to leverage. These products may not be suitable for all investors. Before engaging, you should consider whether you understand how these leveraged products work and whether you can afford the high risk of losing your money.
The Company does not accept clients from the Restricted Jurisdictions as indicated in our website/ T&C. Some services or products may not be available in your jurisdiction.
The applicable legal entity and its respective products and services depend on the client’s country of residence and the entity with which the client has established a contractual relationship during registration.

