GOLD (XAU/USD):
Currently on the daily timeframe, we can observe that Gold has finally broken out of the range it was trading in last week. Initially we could see price trading sideways before breaking above the $2480.00 region, which was previously acting as resistance. Price action then retested this previous resistance area now acting as support around $2480.00 and continued to trade higher into new all time highs (ATH).
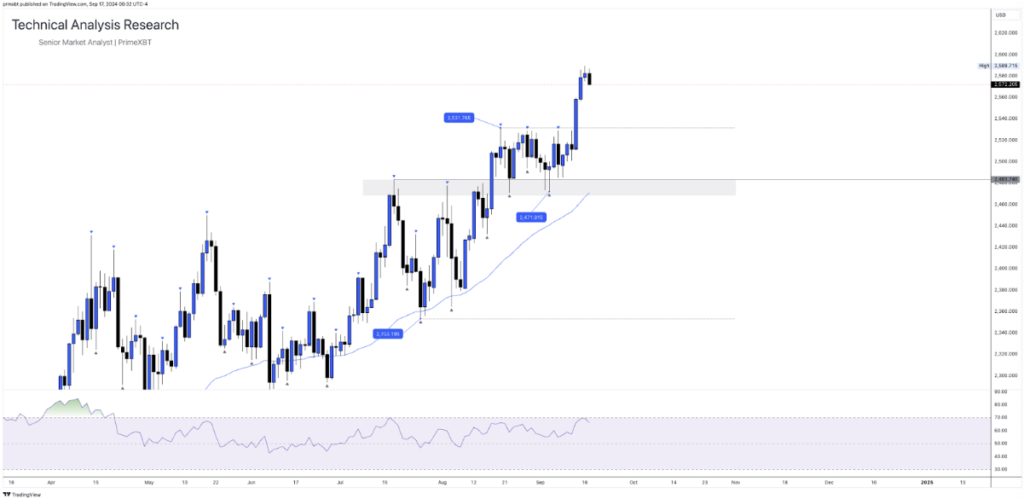
As price continues to trade into undiscovered territory, there are some useful trading indicators and tools that you can use to measure where price may move to in the event that price action starts to trade lower before continuing higher.
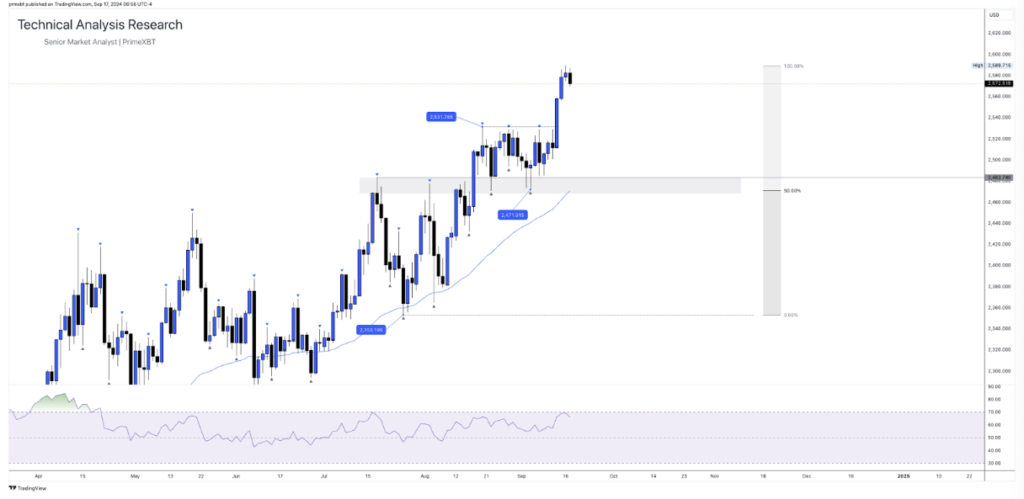
In the above example, you can observe how the RSI is indicating that Gold is somewhat overbought currently, as it looks to be trading into that 70% level. This often indicates that there may be some sort of price cooling when this indicator is trading at this level. Another tool that is useful is the Fibonacci tool. Ideally you would like to observe price action pullback/ trade back into the “50%” level before continuing to trade higher.
EURO vs DOLLAR (EUR/USD):
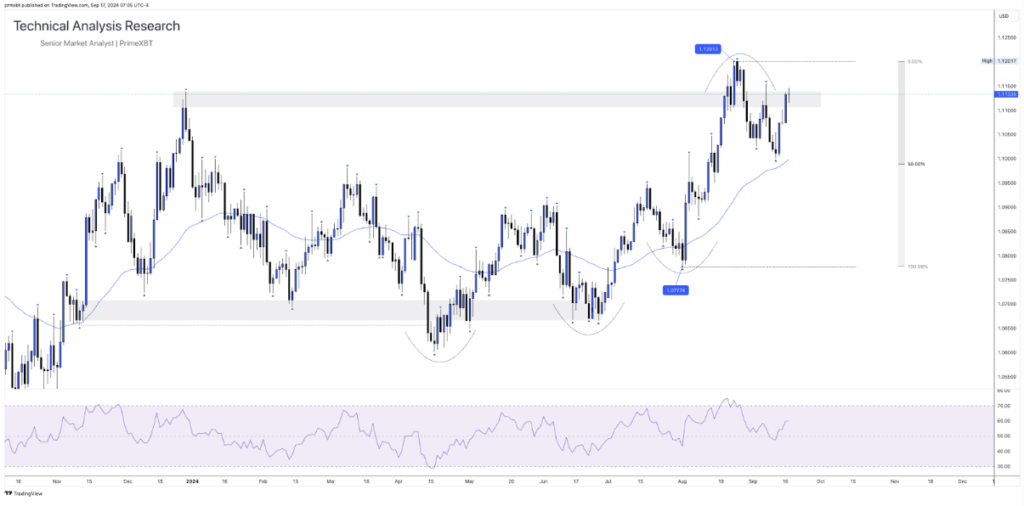
Currently on the daily timeframe, we can observe that EURUSD has been hovering around the 1.1000 region for quite some time now, we traded into this area a few weeks back and look to have rejected it in the short term. However, currently we can observe that price has found some strength and is trading above that psychological 1.11000 region again.
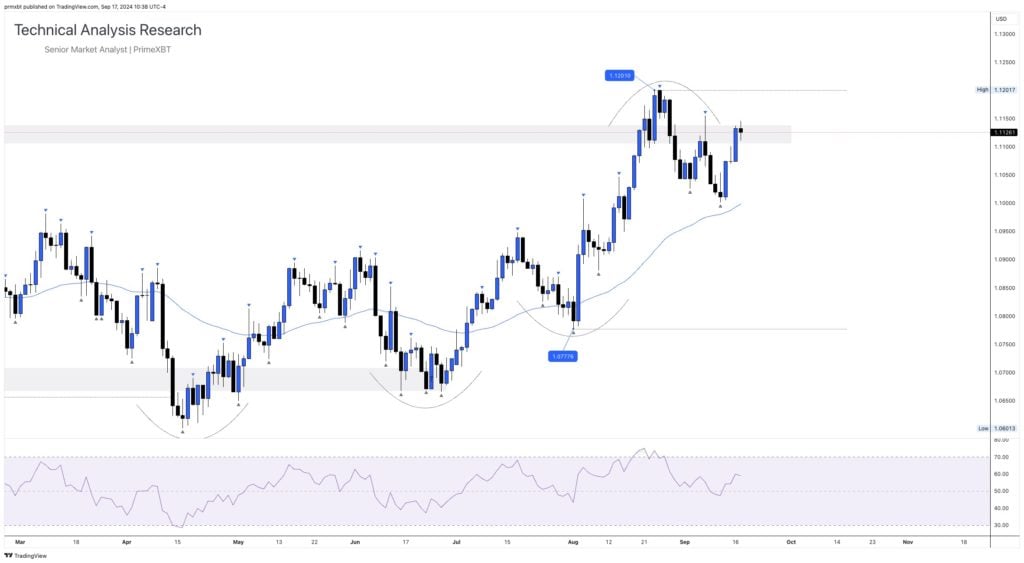
Currently there is no observation that the RSI indicator is showing any signs of the asset being overbought or oversold. However, we can observe when price was trending lower in the short term, we just missed tapping into that 50% fibonacci level where price then found support at roughly 1.10000. Another key psychological level for the currency pair.
NASDAQ (NDX):
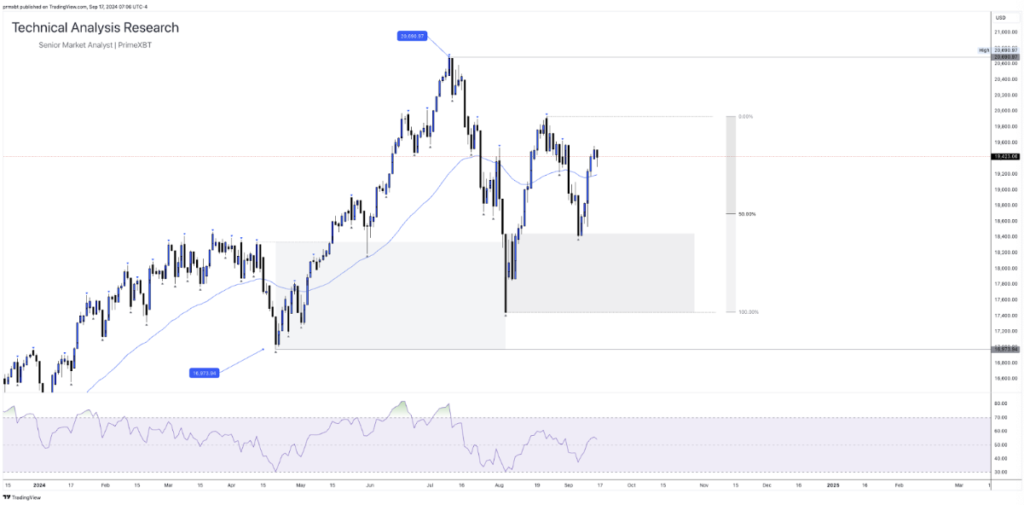
Currently on the daily timeframe, we can observe that NASDAQ is trading just below $19,500.00, but currently holding steadily above the 50 EMA. Taking a look at the current price action shown on the RSI, it can be observed that we are trading relatively inline with market expectations. There are no signs of the asset being overbought or oversold for the time being.
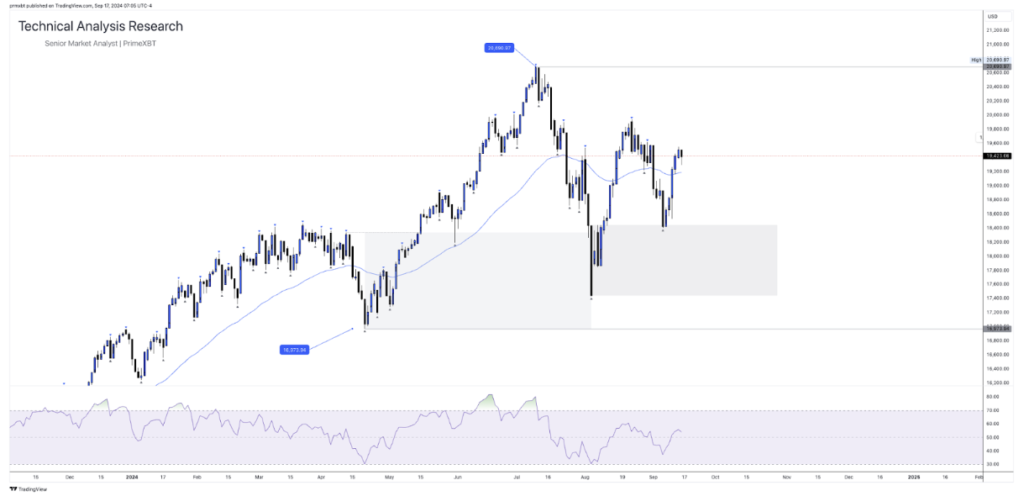
Deep diving a little further we can observe that when price action traded up and into the $20,000.00 region, we found some short term resistance here before continuing to trade lower into the 50% level of the fibonacci tool. Price action then found some support around $18,750.00 before continuing to trade higher.
The content provided here is for informational purposes only. It is not intended as personal investment advice and does not constitute a solicitation or invitation to engage in any financial transactions, investments, or related activities. Past performance is not a reliable indicator of future results.
The financial products offered by the Company are complex and come with a high risk of losing money rapidly due to leverage. These products may not be suitable for all investors. Before engaging, you should consider whether you understand how these leveraged products work and whether you can afford the high risk of losing your money.
The Company does not accept clients from the Restricted Jurisdictions as indicated in our website/ T&C. Some services or products may not be available in your jurisdiction.
The applicable legal entity and its respective products and services depend on the client’s country of residence and the entity with which the client has established a contractual relationship during registration.

