News that $4.2 trillion asset manager Fidelity filed a spot BTC ETF kept crypto market sentiment buoyant, with the price of BTC holding above $30,000 while BCH continued on its tear, gaining yet another 50% to break $300. Apparently, word has it that the skyrocketing moves by BCH were a result of Korean buying, as data showed that the Korean exchanges accounted for almost 30% of the market share of all BCH trades. South Korea passed its first independent cryptocurrency bill to strengthen investor protection last week, which may explain the sudden surge in crypto trading from the nation.
Such buoyant market moves spilled over to the rest of the market, with the price of SOL gaining 40% after a new feature called Debridge allows Solana users access to EVM-based blockchains without needing to convert into a wrapped token. This would allow easy movement of funds between Solana and L2 EVMs like Arbitrum and Optimism.
FTT, the token of beleaguered exchange FTX, which is on track to relaunch itself after claiming to have recovered $ 7 billion in user funds, rose more than 100% after the news was released.
SEC gave traders a scare but PoW coins led recovery
After such heady gains in a span of a few days, early Friday morning came a huge dip after the SEC announced that most of the recent spot BTC ETF filings were incomplete. The price of BTC dipped 5% back below $30,000, while other top gainers lost an average of 10% in the same dip, wiping out around $85 million worth of long positions within an hour.
However, prices recovered strongly after the said funds made adjustments and refiled their ETF applications. Most altcoins reclaimed almost the full extent of the entire dip, while ETH and LTC rose even higher than before the SEC scare. LTC, which is due to half its block rewards around 3 August, was one of the top catch-up players, rising almost 30% on just Friday alone to trade back above $100, while BCH appeared to be losing some steam after hitting a high of $332, putting in a breather after three relentless weeks of magnificent gains.
ETC, the PoW version of ETH, also saw substantial gain of close to 30%, while even DOGE, which had been forgotten by the market, gained 20%. A point worth noting is that other altcoins did not perform as well. The more substantial gains witnessed by these legacy PoW coins could indicate that funds are more aggressively accumulating PoW coins – a phenomenon that we had predicted in one of our previous reports because of the risk that PoS coins could be classified as securities by the SEC. BCH and LTC are also PoW coins.
Even though BTC is also PoW, it did not manage to reclaim the full extent of the SEC-led decline, still hovering in the mid $30,000s at the time of writing, unable to break out of the $31,500 resistance as yet.
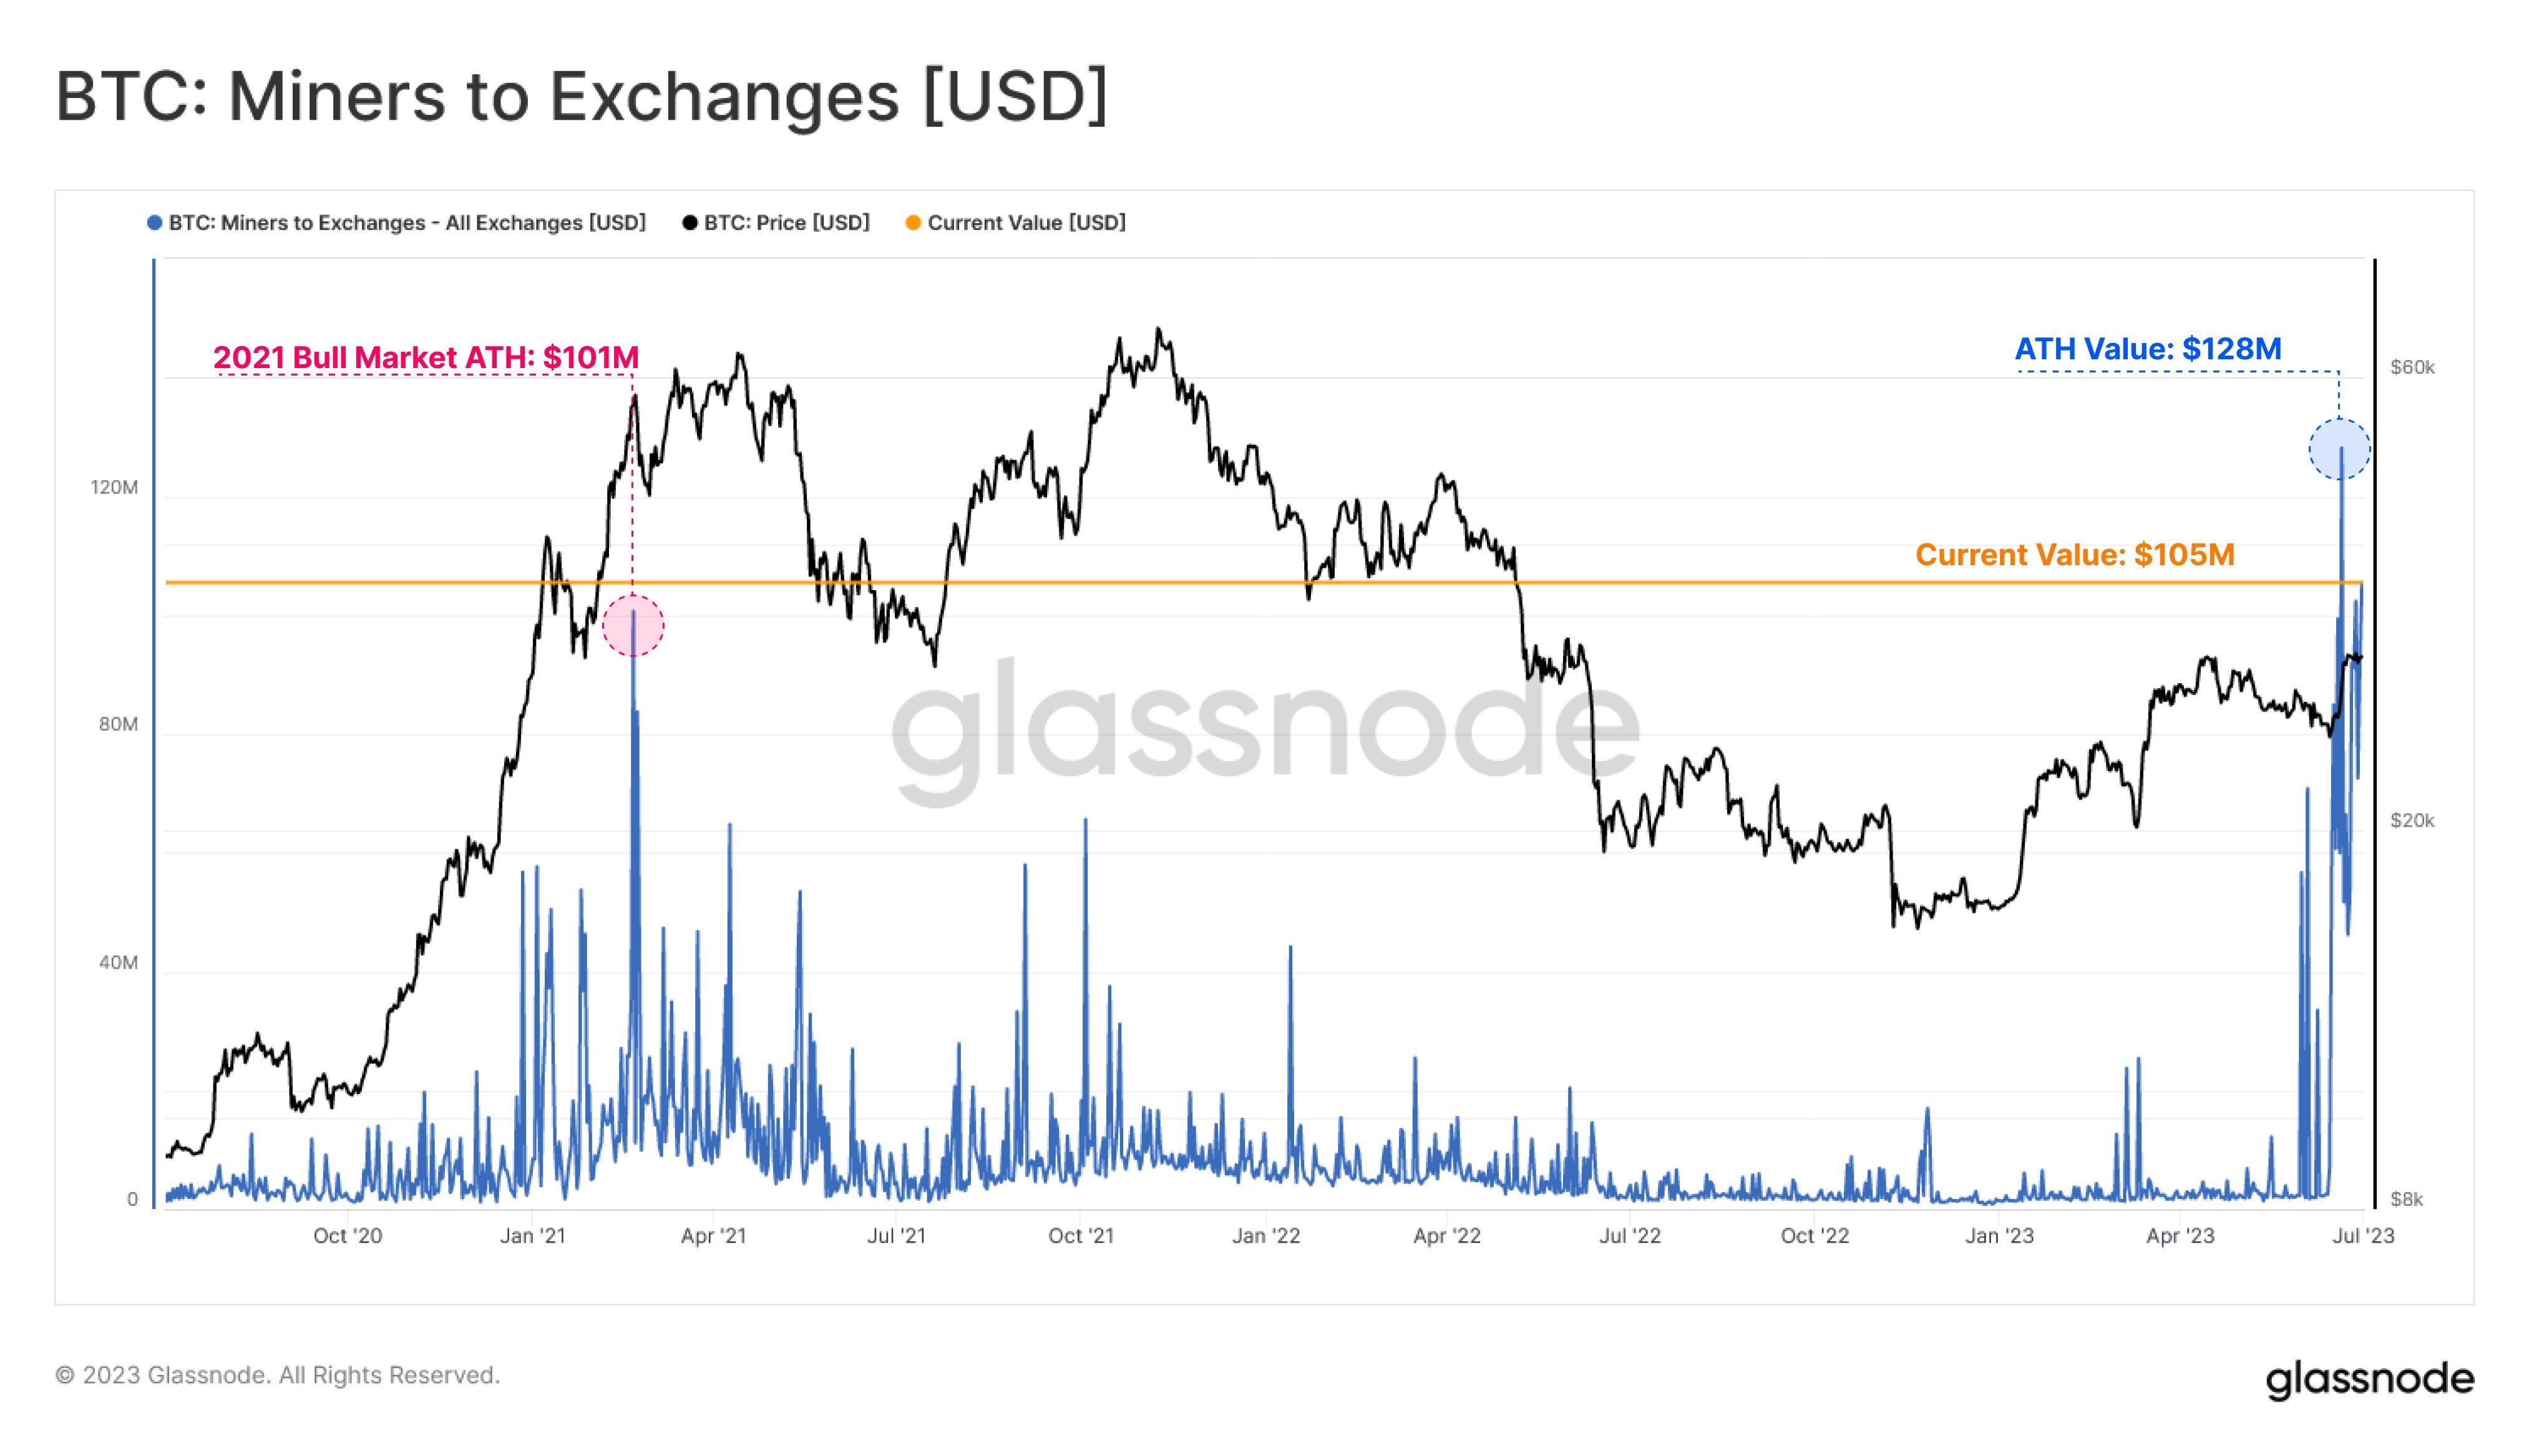
Miners could be why BTC stalled at $31,500
One possible culprit that prevented the price of BTC from breaking above the $31,500 resistance last week could be miners, which have sent a record volume of BTC to exchanges for sale towards the end of last week.
With the price of BTC nearing a strong resistance, such a move by miners is not unreasonable. However, it is worth noting that the price of BTC has remained resilient even with such heavy selling. Thus, it will be interesting to watch how the price of BTC would react once the bulk of the selling is over.
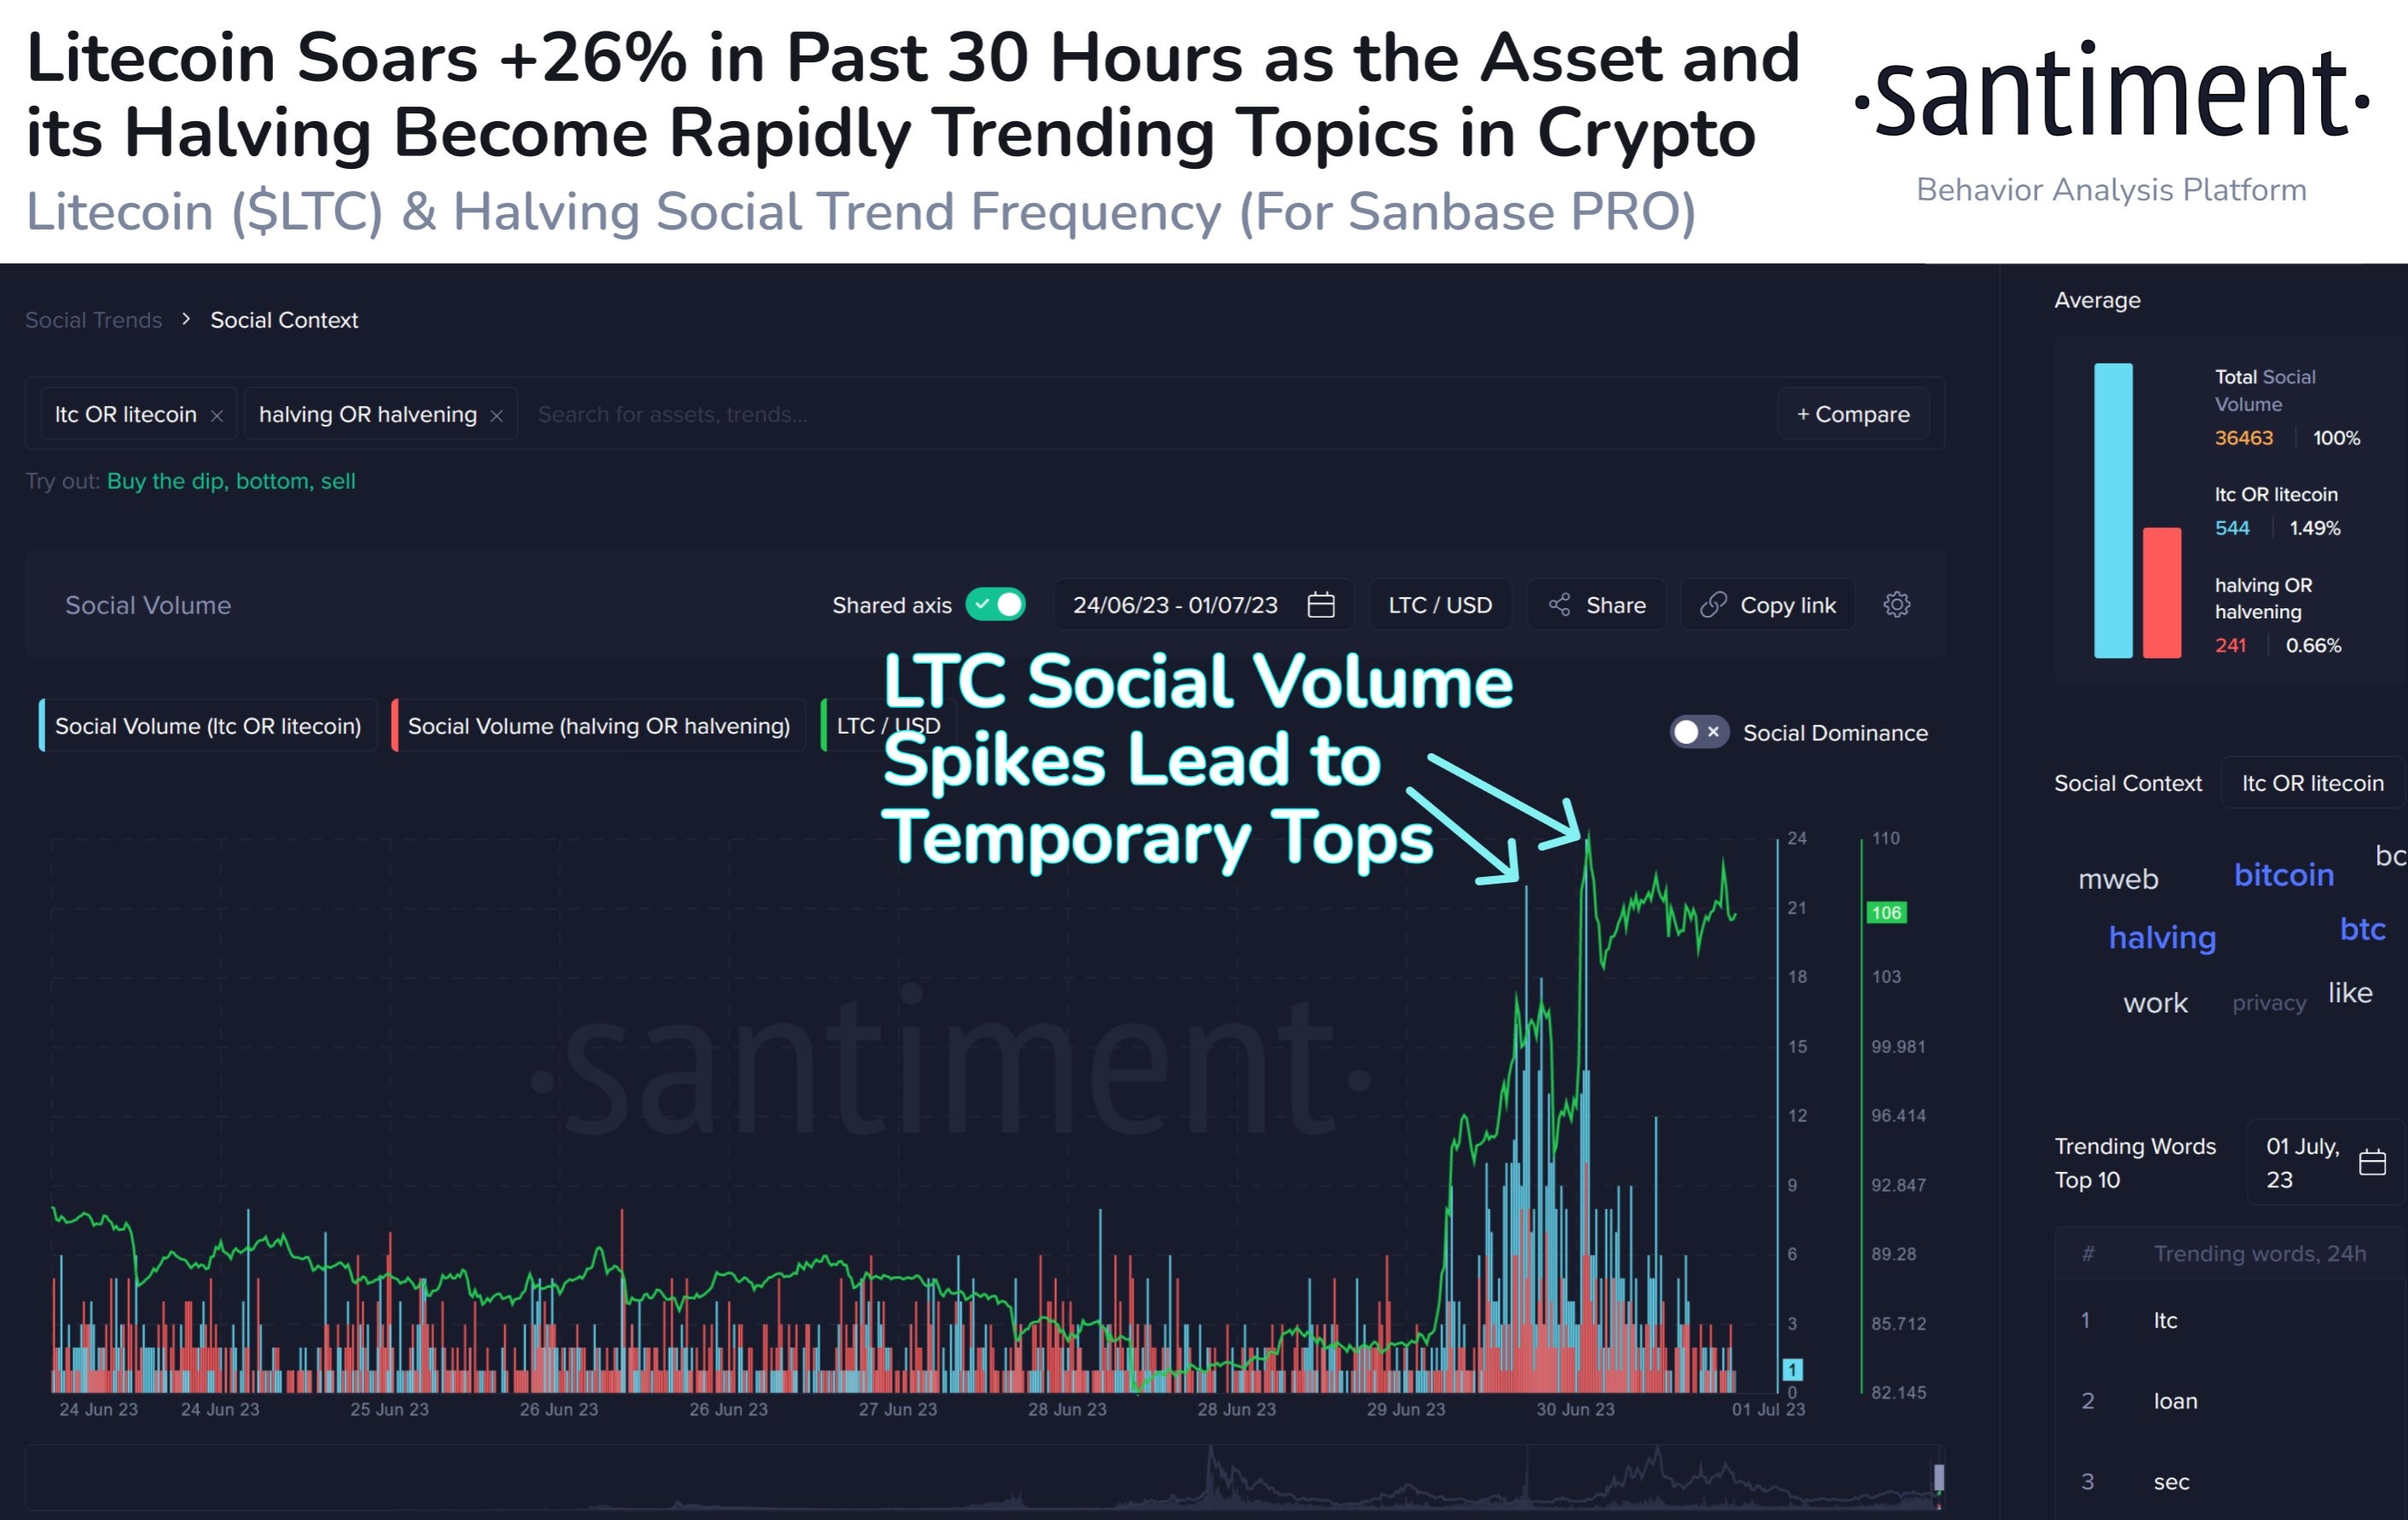
LTC social score soars with price as halving event nears
With less than 5 weeks to go before its anticipated halving of block rewards and a resounding rise of almost 30% on Friday, traders were reasonably giving LTC a lot of attention over the weekend, sending its social volume spiking significantly.
While LTC’s price continues to gain momentum reminiscent of BCH’s rise last week, what made BCH’s rally different from that of LTC was that BCH has had a consistently negative funding rate, which meant that traders were shorting BCH as its price rose, not believing that its rise would sustain. As its price continued to advance, the liquidation of these shorts created cascades of surges which led to an eventual 250% rise.
However, in the case of LTC, its funding rate has started to rise, while its social volume is also rapidly increasing, meaning that an increasing number of traders are talking about LTC on social media. Should these scores continue to rise for LTC, the chance of a temporary pullback would increase as the market gets overheated since everyone appears to be on the same side buying.
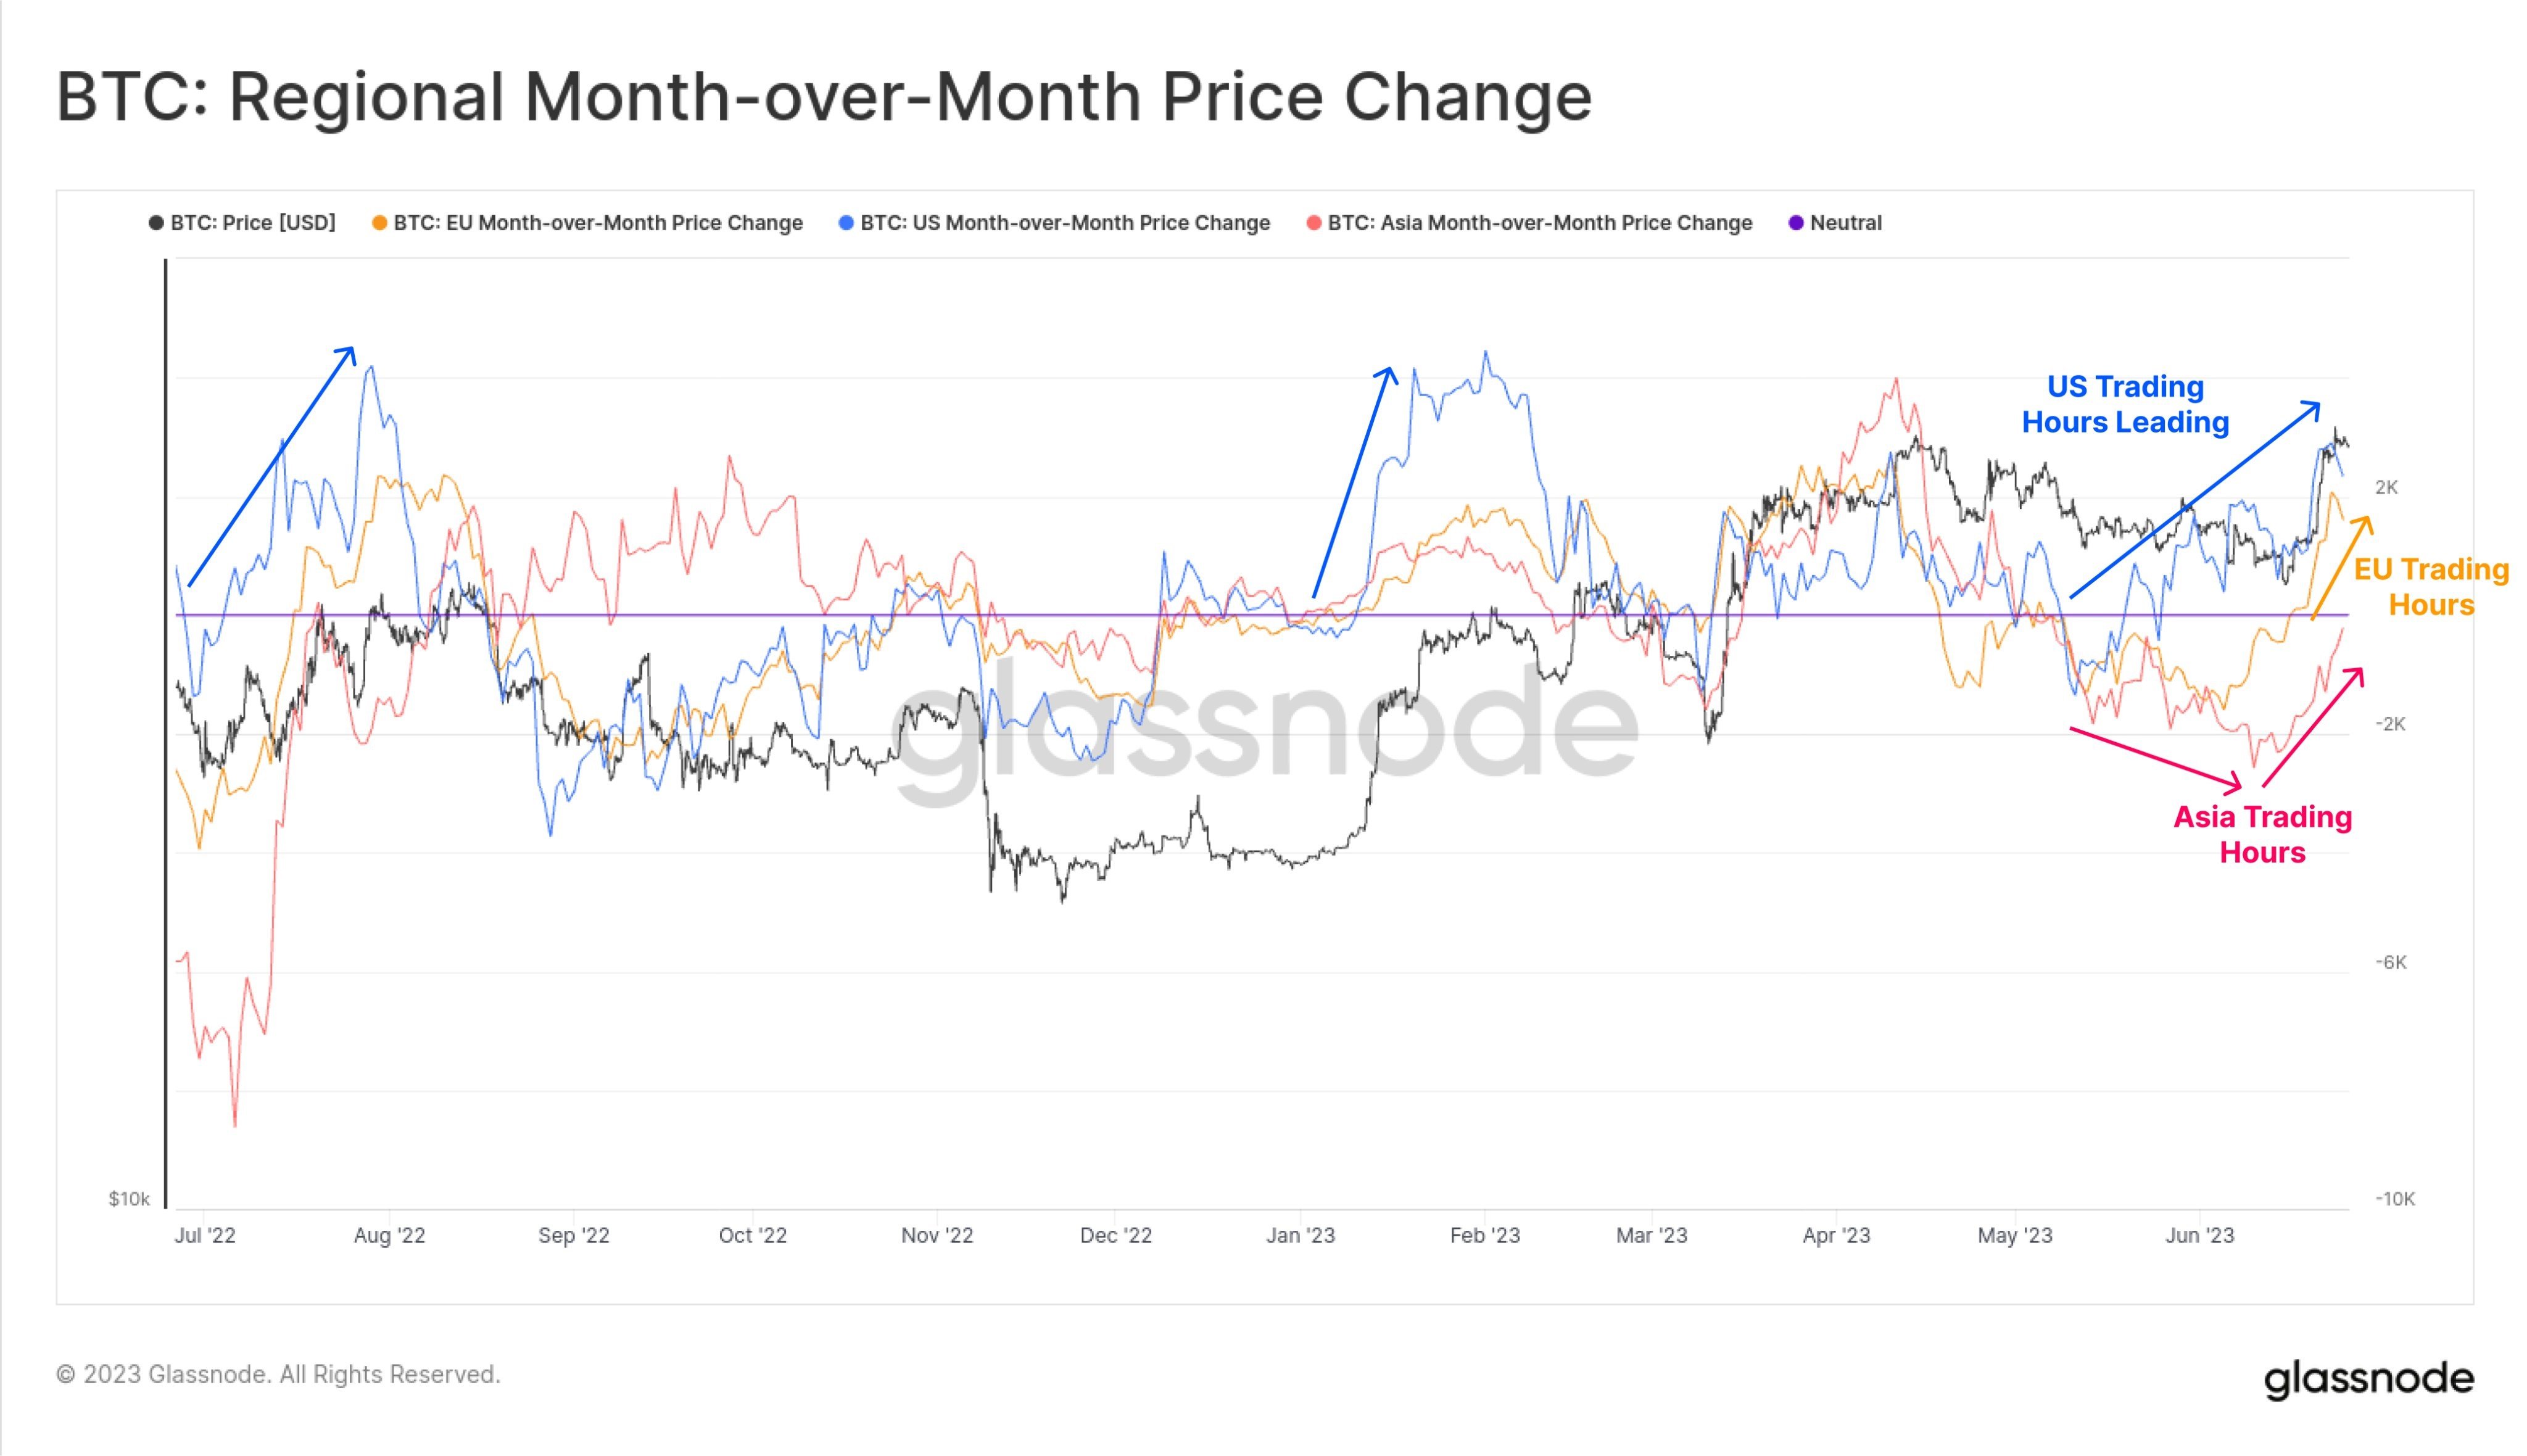
USA likes crypto again
Even though the Korean wave has returned to the crypto market, trading action is still the most active during the USA session. This can be seen most clearly from the SEC-led dip cum recovery, where any large move made during the Asian session was rinsed and repeated during the American session.
The good news is that positive trading action has swung back to the US timezone, with BTC recording the highest positive price change in the US time zone, with the EU in second place and Asia hours still lagging.
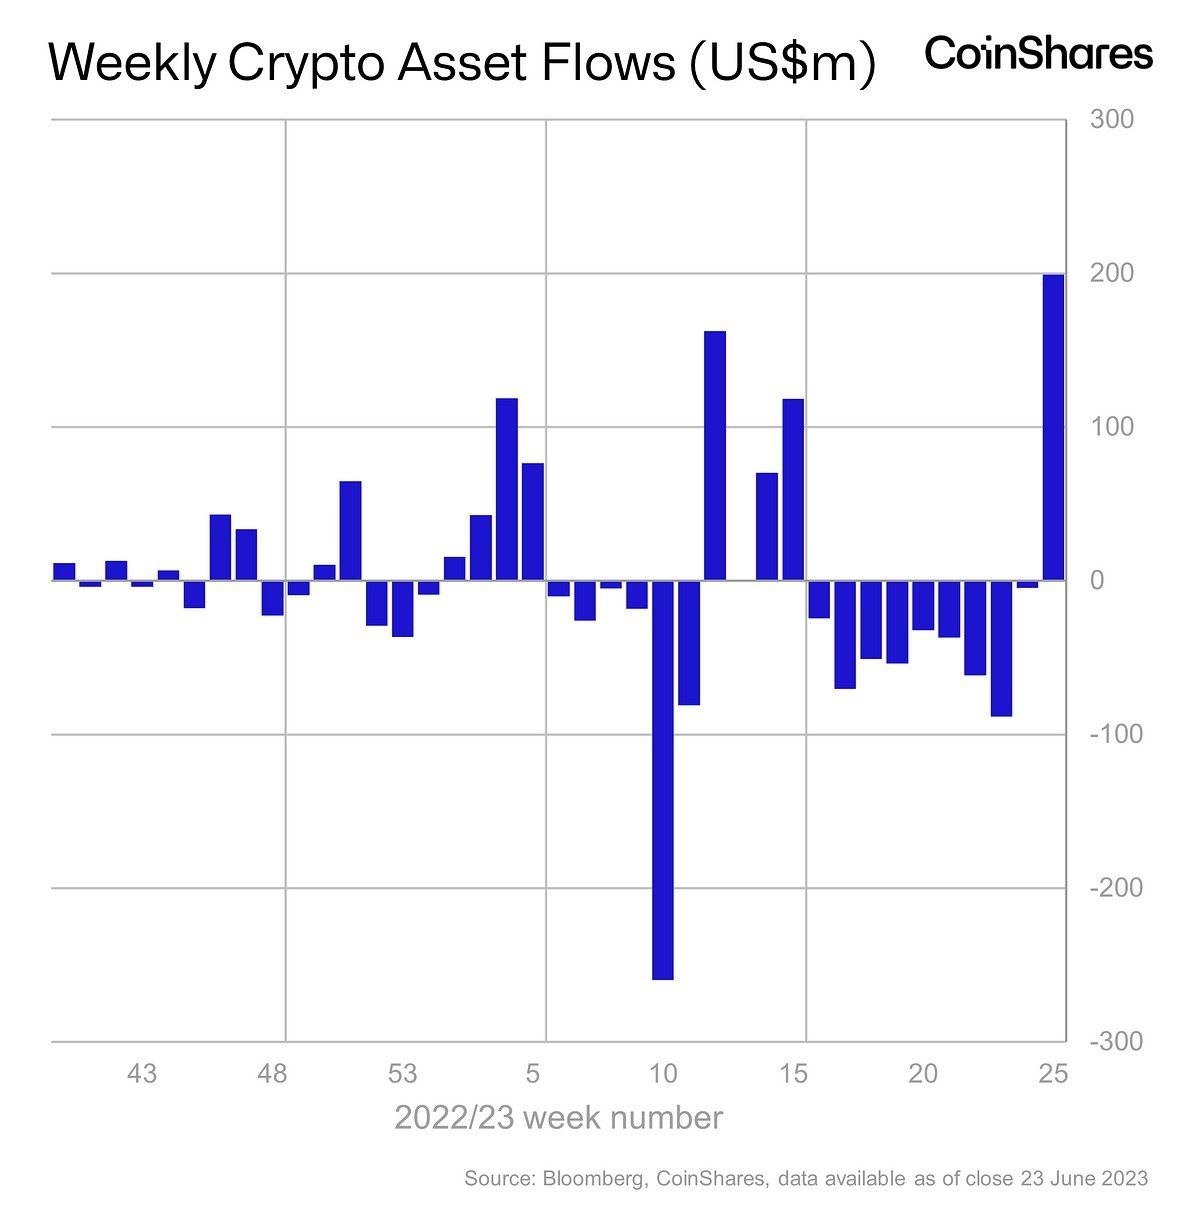
As expected after the huge amount of institutional participation announced over the last two weeks, investing in crypto has become sexy again in the USA, as even fund flows into digital asset investment products in the USA has increased sharply.
After falling for 9 weeks consecutively, digital asset investment products finally saw the largest single weekly inflow since July 2022, totalling $199 million, after the price of BTC broke above $30,000 again in the final week of June.
BTC perma-bull MicroStrategy (MSTR) also announced that they had purchased another 12,333 BTC for $347.0 million at an average price of $28,136 per coin. As of 27 June, MSTR holds a total of 152,333 BTC acquired for $4.52 billion at an average price of $29,668 per coin, finally above breakeven after several months of losses.
BTC may see a high of $45,000 this year
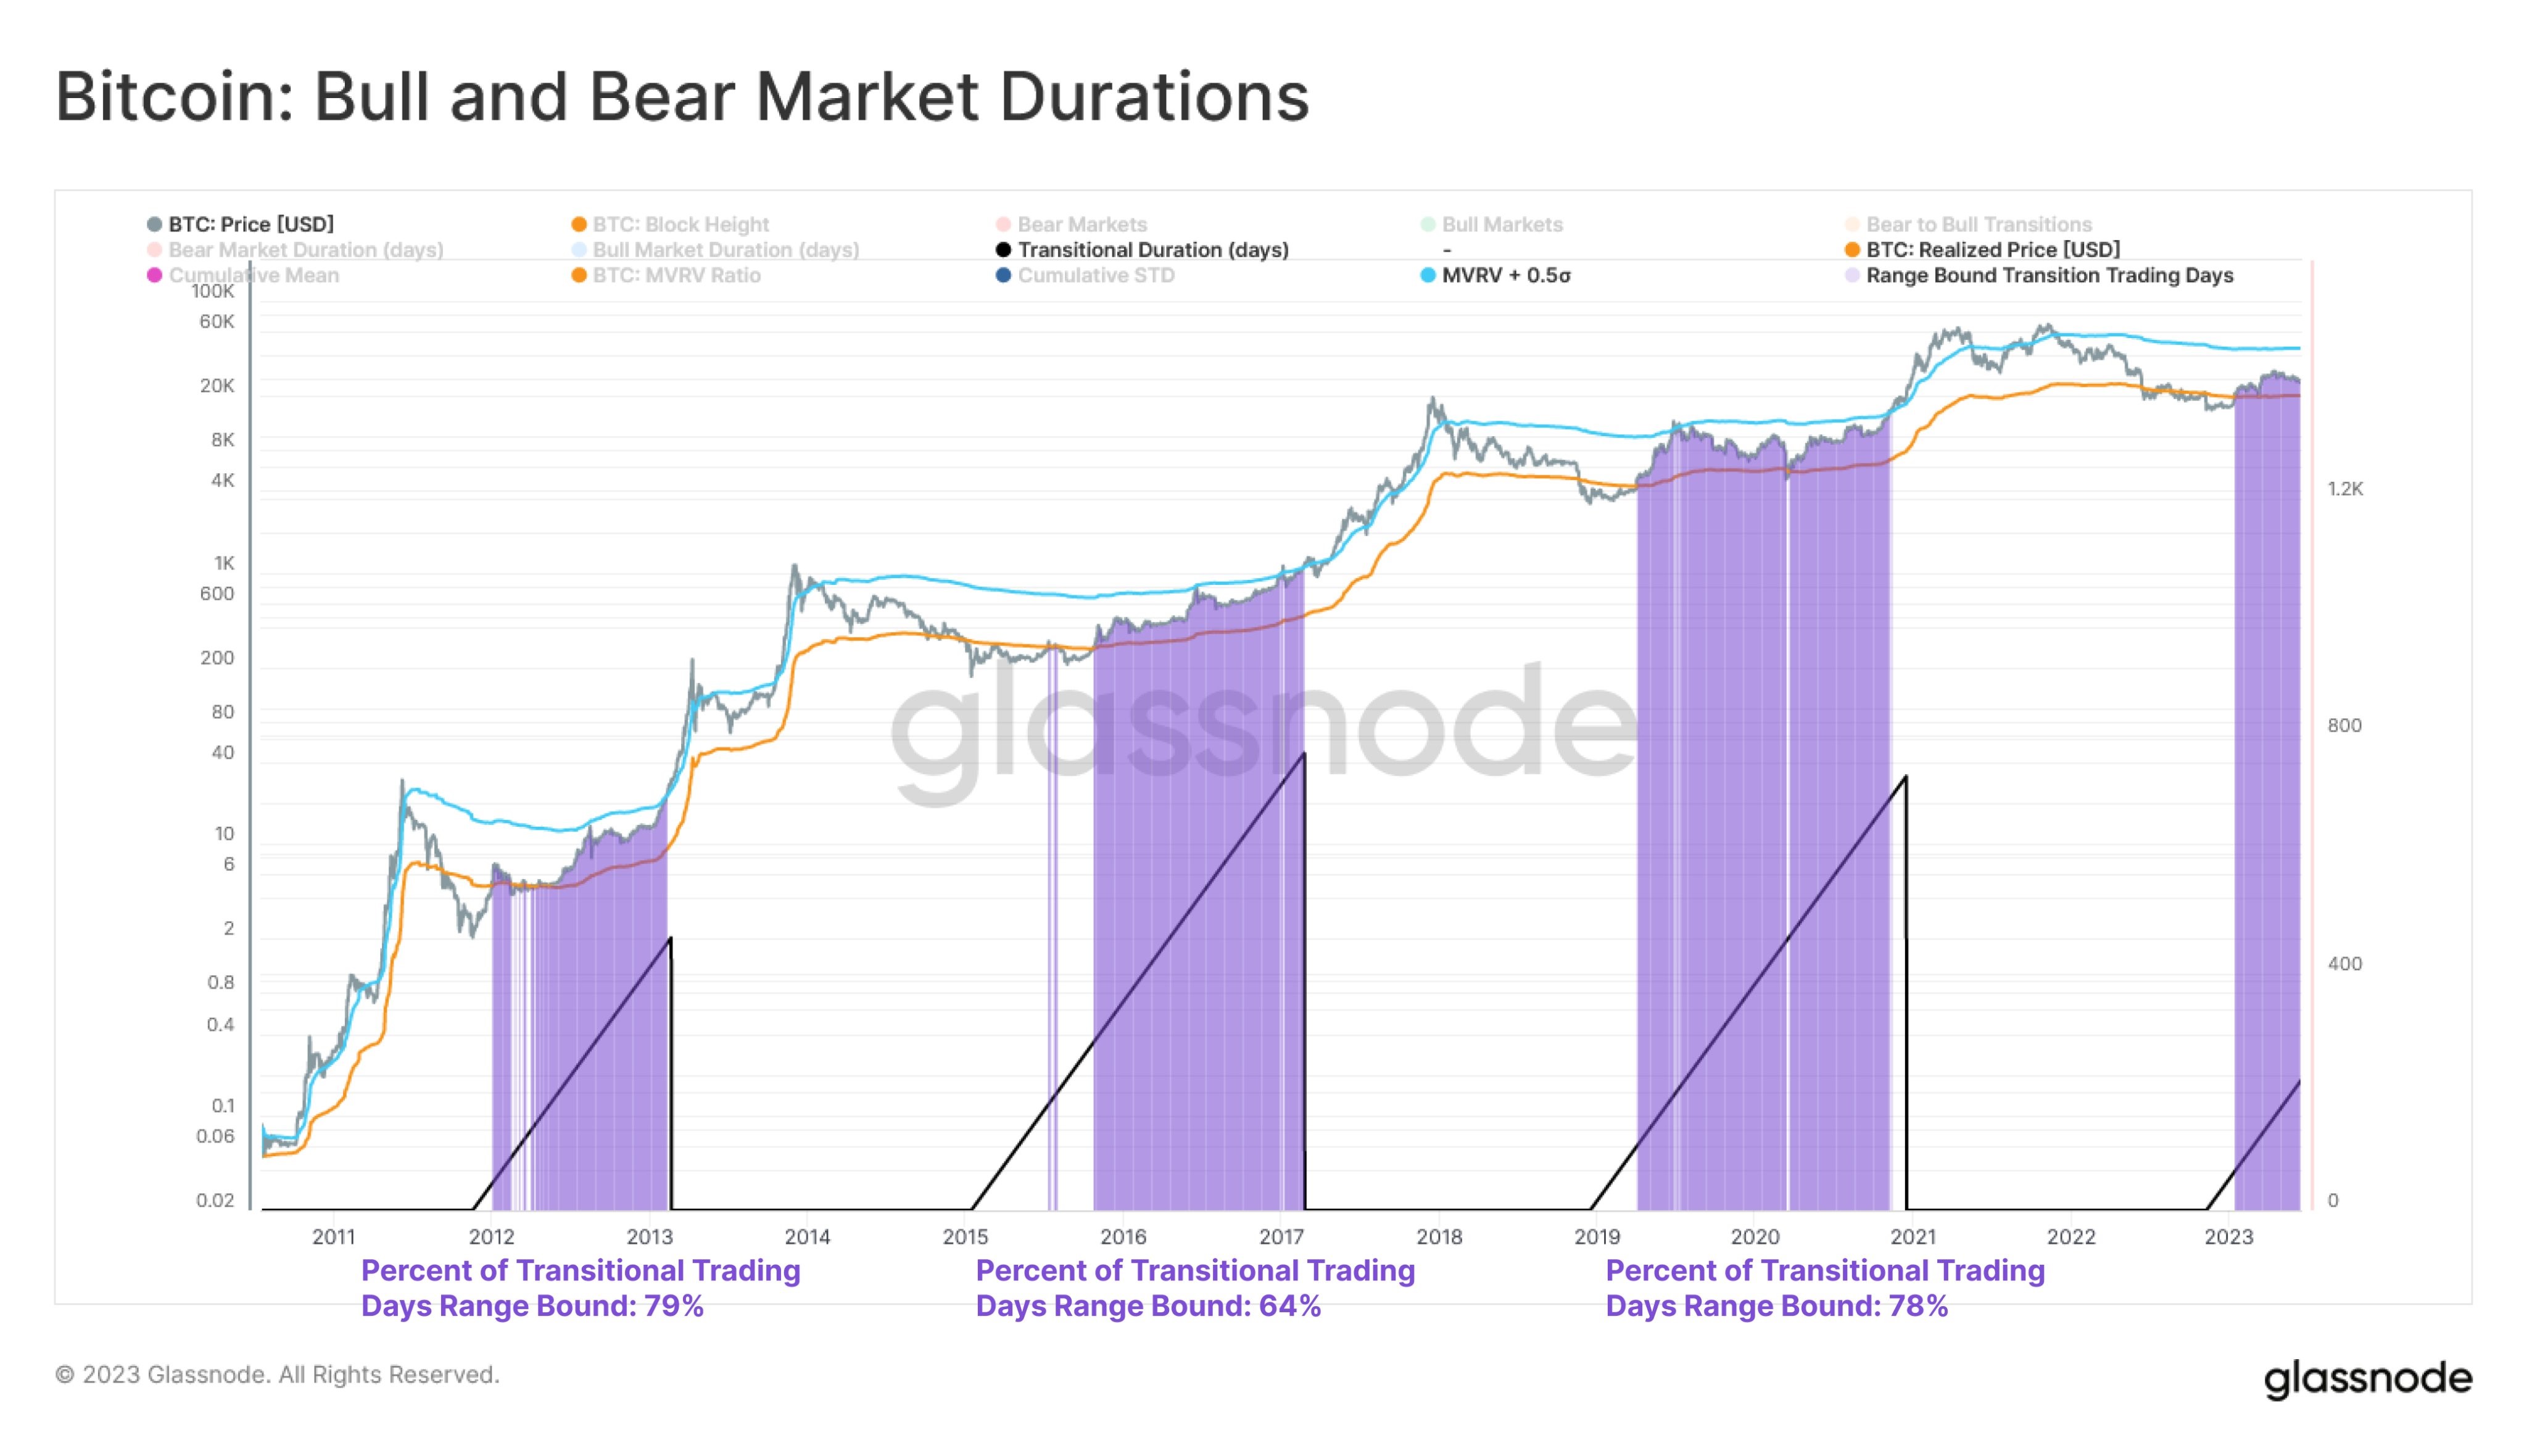
As BTC has been directionless for almost four months now, traders are increasingly getting confused over where to position their trades. One way to get a good idea of where to buy and sell would be to map BTC’s high and low price during a similar stage in BTC’s past cycles. A method to do this is to map the average duration and trading range of BTC during previous market cycles to help traders estimate where the price of BTC could move in the upcoming days.
In the past cycles, the price of BTC stayed range bound for between 64% and 79% of the time, with price ranging between the Realized Price and the Realized Price + 0.5 Standard Deviations. Using the same framework would suggest a price range of between $20,100 on the low side to $45,000 on the upside during this period before the actual start of the bull market.
Stocks end 1Q2023 on positive note as dollar retraces
US stocks rose after the latest batch of economic data released early last week beat market expectations. May durable goods data unexpectedly increased, while consumer confidence improved more than expected in June. New home sales also topped expectations, increasing investor’s faith that the economy may not enter into a recession after all. The PCE price index released on Friday also rose less than expected in May. The welcoming reduction in inflation sent the three major US indices to end the week gaining around 2% each.
Friday also marked the end of the first half of the year, with key US indices clocking commendable gains. For the first six months of 2023, the S&P 500 rose 15.9%, the Nasdaq surged 31.7% for its best first half since 1983, while the Dow added a modest gain of 3.8%.
With expectation that inflation would start to ease, the dollar retreated slightly at the end of the week even after FED Chair Powell gave a more hawkish than anticipated speech at the central bankers forum in Europe on Wednesday. However, for the week, the dollar was still up about 0.1% while Gold lost 0.3%. Silver gained 1%.
Oil prices remain stuck in consolidation. The WTI gained 0.7% and Brent rose by 0.5%. However, prices are still trading within the low $70s range and could stay that way unless the OPEC+ meeting this Wednesday springs up some surprise.
At the start of the new week, the dollar is finding a bid while commodity prices are falling back around 0.1% in Asian trading. This could be related to the fact that Tuesday is the Independence Day holiday. Consequently because of this, the early part of the week may be quieter than usual. However, volatility could return mid-week as a series of data releases would provide for good trading opportunities.
Wednesday will see the release of FED meeting minutes. Thursday will see the release of private ADP employment numbers as well as unemployment claims. Friday may likely be the most eventful day as the non-farm payrolls (NFP) for June will get released. The NFP is the most watched data point for US employment and any big unexpected change is likely to impact the dollar and US stock market a great deal.
The content provided here is for informational purposes only. It is not intended as personal investment advice and does not constitute a solicitation or invitation to engage in any financial transactions, investments, or related activities. Past performance is not a reliable indicator of future results.
The financial products offered by the Company are complex and come with a high risk of losing money rapidly due to leverage. These products may not be suitable for all investors. Before engaging, you should consider whether you understand how these leveraged products work and whether you can afford the high risk of losing your money.
The Company does not accept clients from the Restricted Jurisdictions as indicated in our website/ T&C. Some services or products may not be available in your jurisdiction.
The applicable legal entity and its respective products and services depend on the client’s country of residence and the entity with which the client has established a contractual relationship during registration.


