14 min read
 Pepe Coin (PEPE) trades around $0.0000028 in early August 2026, roughly 90% below the record it set in December 2024. Pepe is an ERC-20 meme token on the Ethereum blockchain, launched in April 2023 and built on the Pepe the Frog internet meme, with no product, no yield, and no stated purpose beyond the meme itself. This page lays out PrimeXBT’s price outlook for PEPE through 2030 and out to 2050, the technical levels traders are watching now, and the events that could push the price either way. Where a meme coin’s future is genuinely unknowable, the text says so rather than dressing a guess as a target.
Pepe outlook at a glance
- 2026 base case: $0.00000255–$0.00000325, a sideways year near current levels rather than a fresh run.
- Main bullish catalyst: a broad risk-on turn led by Bitcoin, with retail attention rotating back into meme coins.
- Biggest downside risk: fading social interest and a sustained break below the $0.0000027 support, which opens the door toward $0.0000023.
- Long-term view: the model drifts higher into the next market cycle and peaks in 2029, but anything past 2030 is a direction, not a price.
Live Pepe price chart
Trading involves risk.
Pepe price prediction 2026–2030 (yearly forecast)
The table sets PrimeXBT’s expected range for each year, derived from the month-by-month path in the sections below. Wider institutional and algorithmic targets, which rest on very different assumptions, are kept separate in the analyst section rather than blended in here.
| Year | Minimum | Average | Maximum |
|---|---|---|---|
| 2026 | $0.00000255 | $0.00000286 | $0.00000325 |
| 2027 | $0.00000273 | $0.00000356 | $0.00000454 |
| 2028 | $0.00000354 | $0.00000465 | $0.00000597 |
| 2029 | $0.00000429 | $0.00000553 | $0.00000686 |
| 2030 | $0.00000365 | $0.00000506 | $0.00000646 |
Pepe price prediction 2026
Our 2026 outlook keeps Pepe close to where it trades now: a $0.00000255–$0.00000325 band, averaging near $0.00000285, with no return to the 2024 high. For a meme coin that is a quiet year, and the profile of a market waiting for a reason to move rather than one already moving.
The rest of 2026 reads as a flat, slightly firmer drift. The forward months hold Pepe inside a narrow band, with the average edging up only marginally into December:
| Month (2026) | Minimum | Average | Maximum |
|---|---|---|---|
| August | $0.00000255 | $0.00000280 | $0.00000305 |
| September | $0.00000256 | $0.00000283 | $0.00000309 |
| October | $0.00000258 | $0.00000285 | $0.00000312 |
| November | $0.00000261 | $0.00000290 | $0.00000319 |
| December | $0.00000265 | $0.00000295 | $0.00000325 |
Pepe price prediction 2027
2027 is where the recovery starts to show. Our path lifts through the year to an average near $0.00000360 across a $0.00000273–$0.00000454 range, carried by a broader risk-on tone rather than anything Pepe does on its own — a meme coin with no roadmap has no internal catalyst to lean on, so its year depends on the crowd coming back.
| Month (2027) | Minimum | Average | Maximum |
|---|---|---|---|
| January | $0.00000273 | $0.00000305 | $0.00000337 |
| February | $0.00000281 | $0.00000315 | $0.00000349 |
| March | $0.00000289 | $0.00000325 | $0.00000361 |
| April | $0.00000297 | $0.00000335 | $0.00000373 |
| May | $0.00000305 | $0.00000345 | $0.00000385 |
| June | $0.00000313 | $0.00000355 | $0.00000397 |
| July | $0.00000319 | $0.00000364 | $0.00000408 |
| August | $0.00000325 | $0.00000371 | $0.00000417 |
| September | $0.00000330 | $0.00000378 | $0.00000426 |
| October | $0.00000335 | $0.00000385 | $0.00000436 |
| November | $0.00000340 | $0.00000393 | $0.00000445 |
| December | $0.00000346 | $0.00000400 | $0.00000454 |
Pepe price prediction 2028
2028 runs with the next market cycle. Bitcoin’s fourth halving lands in the spring, and meme coins have historically caught the late, speculative leg of the rally that follows. Our model averages near $0.00000470 for the year within a $0.00000354–$0.00000597 range, the strongest reading since the 2024 top but still short of it.
| Month (2028) | Minimum | Average | Maximum |
|---|---|---|---|
| January | $0.00000354 | $0.00000411 | $0.00000468 |
| February | $0.00000362 | $0.00000422 | $0.00000481 |
| March | $0.00000370 | $0.00000432 | $0.00000495 |
| April | $0.00000378 | $0.00000443 | $0.00000509 |
| May | $0.00000386 | $0.00000454 | $0.00000522 |
| June | $0.00000393 | $0.00000465 | $0.00000536 |
| July | $0.00000400 | $0.00000474 | $0.00000548 |
| August | $0.00000404 | $0.00000481 | $0.00000557 |
| September | $0.00000409 | $0.00000488 | $0.00000567 |
| October | $0.00000414 | $0.00000495 | $0.00000577 |
| November | $0.00000418 | $0.00000503 | $0.00000587 |
| December | $0.00000423 | $0.00000510 | $0.00000597 |
Pepe price prediction 2029
2029 is the peak year in our outlook. The path tops out mid-year before easing, averaging near $0.00000560 across a $0.00000429–$0.00000686 range. That marks roughly a doubling from today’s price, yet it still leaves Pepe below its December 2024 record — a full round trip to the old high is not the base case, only the bull case.
| Month (2029) | Minimum | Average | Maximum |
|---|---|---|---|
| January | $0.00000430 | $0.00000521 | $0.00000611 |
| February | $0.00000438 | $0.00000532 | $0.00000625 |
| March | $0.00000445 | $0.00000542 | $0.00000640 |
| April | $0.00000452 | $0.00000553 | $0.00000654 |
| May | $0.00000459 | $0.00000564 | $0.00000668 |
| June | $0.00000467 | $0.00000575 | $0.00000683 |
| July | $0.00000466 | $0.00000576 | $0.00000686 |
| August | $0.00000459 | $0.00000569 | $0.00000679 |
| September | $0.00000451 | $0.00000562 | $0.00000672 |
| October | $0.00000444 | $0.00000555 | $0.00000665 |
| November | $0.00000436 | $0.00000547 | $0.00000658 |
| December | $0.00000429 | $0.00000540 | $0.00000651 |
Pepe Coin price prediction 2030
2030 cools off after the cycle peak. Our view spans a $0.00000365–$0.00000646 range, averaging near $0.00000505, as speculative flows rotate out and the market settles. Read the month-by-month figures below as the shape of a decline from the 2029 high, not as dated price promises.
| Month (2030) | Minimum | Average | Maximum |
|---|---|---|---|
| January | $0.00000423 | $0.00000535 | $0.00000646 |
| February | $0.00000417 | $0.00000529 | $0.00000641 |
| March | $0.00000412 | $0.00000524 | $0.00000636 |
| April | $0.00000406 | $0.00000518 | $0.00000631 |
| May | $0.00000400 | $0.00000513 | $0.00000626 |
| June | $0.00000395 | $0.00000508 | $0.00000621 |
| July | $0.00000389 | $0.00000503 | $0.00000616 |
| August | $0.00000384 | $0.00000498 | $0.00000612 |
| September | $0.00000379 | $0.00000494 | $0.00000608 |
| October | $0.00000375 | $0.00000489 | $0.00000604 |
| November | $0.00000370 | $0.00000485 | $0.00000599 |
| December | $0.00000365 | $0.00000480 | $0.00000595 |
Pepe long-term price prediction: 2035, 2040–2050
Put a price on a meme coin a decade out and you are really betting on how long the joke keeps paying. No model can price the attention span of a market that hasn’t formed yet, so the numbers below are a rough arc rather than targets, and the error bars widen every year. On that basis, our long-range path drifts higher without ever hockey-sticking: an average near $0.00000850 in 2035, near $0.00001150 in 2040, and near $0.00001700 in 2050 — a level that would still sit below the December 2024 record.
| Year | Minimum | Average | Maximum |
|---|---|---|---|
| 2035 | $0.00000612 | $0.00000850 | $0.00001088 |
| 2040 | $0.00000759 | $0.00001150 | $0.00001541 |
| 2050 | $0.00000986 | $0.00001700 | $0.00002414 |
What analysts and models say (compared)
Forecasts for Pepe scatter widely, which is what happens when an asset has no fundamentals to anchor to. Algorithmic aggregators cluster in the low-to-mid $0.000002–$0.000005 range through 2030; the loudest bull cases talk about one cent, a level that would require a market capitalization larger than the entire crypto market today. Averaging figures built on such different premises would mislead, so they sit side by side.
| Source | Method | Pepe view |
|---|---|---|
| Changelly | Algorithmic | 2026 avg ~$0.0000026; 2030 avg ~$0.0000047; 2040 avg ~$0.0000121 |
| CoinGabbar | Technical (Aug 2026) | Base case $0.00000227–$0.00000310 for the month; bull to ~$0.0000038 |
| Coinbase (5%/yr model) | Mechanical | Simple compounding tool, no independent target |
| “$0.01” retail thesis | Narrative | One cent — implies a multi-trillion-dollar market cap; treated as improbable |
The gap between the algorithmic models and the one-cent crowd is the whole story. Pepe carries roughly 420.69 trillion tokens, so every extra zero on the price multiplies an already enormous supply. At one cent the token would be worth more than four trillion dollars, which is why that target reads as a rallying cry rather than a forecast. The credible disagreement is narrower: whether the next cycle drags PEPE back toward its old high or leaves it a fraction of the way there.
Track record of this forecast
This is the first published PrimeXBT price forecast for Pepe. From the next monthly review onward, this section will hold the previous forecast against PEPE’s actual price on the update date and account for any miss instead of quietly moving the goalposts.
Pepe technical analysis
Pepe sits between its two most-watched moving averages. It trades near its 50-day average around $0.0000028, which has capped the downside, but below its 200-day average near $0.0000038 — a sign the longer trend is still down. The RSI has held around the middle of its range through late July, neither overbought nor oversold, which fits a market drifting sideways.
The support and resistance levels that matter now: support at roughly $0.0000027, then a deeper floor near $0.0000023; resistance at about $0.0000029, then $0.0000031 at the top of the recent range, with the far heavier supply band starting near $0.0000073. Reclaiming the 200-day average around $0.0000038 would be the first real evidence the longer downtrend has broken. Broader sentiment reads neutral: the crypto Fear & Greed Index sits near 44 (neutral) in early August. For a primer on reading these signals, see PrimeXBT’s guide to crypto technical analysis.
Correlation with other assets
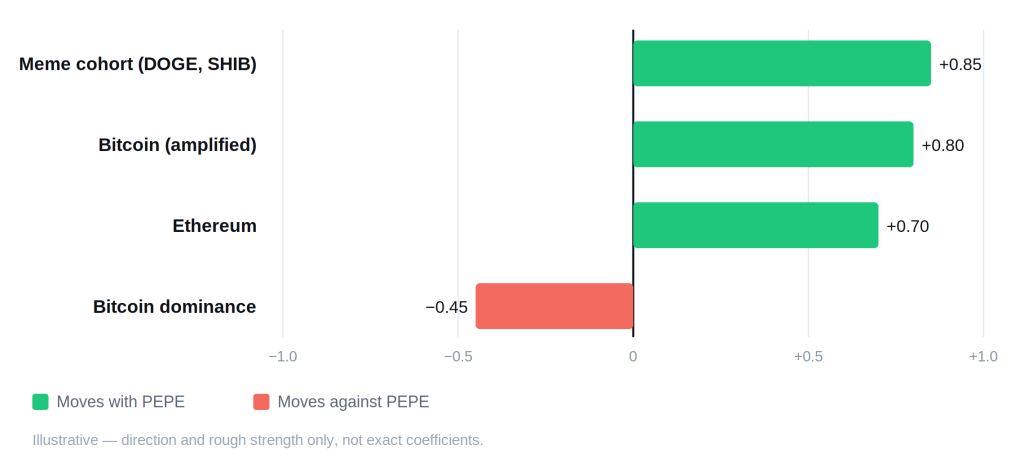
Pepe is a pure high-beta play on the rest of the market. When Bitcoin rises, PEPE tends to rise harder; when Bitcoin falls, it falls further — the amplification runs both ways, which is the defining feature of a meme coin with no story of its own. It trades almost in lockstep with the meme-coin cohort, so a green day for Dogecoin or Shiba Inu usually means a green day for Pepe. Because PEPE is an ERC-20 token, Ethereum’s health and gas costs feed into it as well. The one relationship that hurts it is Bitcoin dominance: when money crowds into Bitcoin and dominance climbs, thin-liquidity meme coins are the first to bleed, and Pepe underperforms. Above all it moves on retail attention — social volume and momentum drive it more than any chart pattern does. None of these ties are fixed; they tighten when the market runs hot and slacken when it goes quiet.
Fundamental factors
Pepe’s fundamentals are, by design, close to nothing. Its own site describes the project as created for fun, “with no roadmap, no utility,” and no promises — “it’s a meme coin, plain and simple.” There is no staking, no fee revenue, no protocol to generate demand, and no team building toward a product. What backs the price is attention and liquidity: the coin is worth what the next wave of buyers will pay while the meme is in fashion.
The token launched on April 14, 2023 as an ERC-20 on Ethereum, with a fixed supply of 420.69 trillion PEPE — a number chosen as a meme in itself. Almost all of that supply is already in circulation, so there is no drip of team unlocks waiting to hit the market, but there is also no scarcity engine working in a holder’s favor. Despite talk of burns, no meaningful burn program exists: only trivial amounts have ever been removed, and the team has been open that a burn happens if and when it feels like it. Unlike Bitcoin’s fixed 21 million cap or Ethereum’s fee-burn mechanism, Pepe has no built-in force tightening supply over time. It rode the 2023–2024 meme wave from launch to a market capitalization above a billion dollars within about eighteen months, which is the case for it and the warning at once — the same crowd that carried it up can leave as quickly.
Upcoming catalysts
Only confirmed, dated events are listed. Pepe has no upgrades or releases of its own to schedule, so the calendar is macro, and macro is what sets the risk appetite that a meme coin lives on.
| Date | Event | Potential impact |
|---|---|---|
| September 15–16, 2026 | FOMC meeting (with economic projections) | Bull if the Fed signals cuts and risk appetite improves; bear if it holds rates higher for longer |
| October 27–28, 2026 | FOMC meeting | Rate path steers flows into or out of speculative crypto |
| December 8–9, 2026 | FOMC meeting (with economic projections) | Year-end policy signal for 2027 positioning |
| 2028 (date not yet confirmed) | Bitcoin’s next halving | Historically precedes the speculative leg meme coins ride; timing is block-based, so no calendar date is fixed |
FOMC dates follow the Federal Reserve’s published 2026 schedule. The halving is listed without a date because it is triggered by block height, not the calendar, so any exact day this far out would be a guess.
Bull case vs bear case
Bull case:
- Bitcoin turns risk-on and capital rotates down the risk curve into meme coins.
- Retail attention returns, and social volume around Pepe picks up as it did in 2023 and 2024.
- The post-halving cycle drives a speculative late leg, Pepe’s historical sweet spot.
- Thin float means fresh demand moves the price quickly once buyers show up.
Bear case:
- Buyers lose interest, 24-hour volume dries up, and the $0.0000027 support gives way toward $0.0000023.
- Bitcoin dominance climbs and low-liquidity meme coins bleed out first.
- Newer meme coins pull attention and trading volume away from Pepe.
- With no utility to fall back on, a sentiment shift has nothing to cushion it.
Invalidation levels. The bull case weakens on a daily close below $0.0000027, the level holding up the current range; lose it and the deeper $0.0000023 floor comes into play. The bear case is invalidated on a sustained reclaim of the 200-day average near $0.0000038, which would be the clearest sign the year-long downtrend has turned. Both figures come straight from the levels traders are already watching, not from a separate model.
Historical performance
Pepe’s chart is a spike, not a staircase. It launched in April 2023 and ran thousands of percent within its first few weeks, minting a wave of overnight gains before giving most of them back just as fast. It came alive again through 2024, climbing to a record on December 9, 2024, then fell roughly 90% into the middle of 2026. Two violent up-cycles and two long bleeds in barely three years: a meme coin’s price history is a record of attention, and attention is the one thing no forecast can schedule.
Is Pepe a good investment in 2026?
That comes down to what a buyer wants from it. Pepe is an attention trade, not a cash-flow asset: there is no yield, no product, and no floor under the price beyond the next round of buyers. Our outlook has PEPE roughly flat into year-end, averaging near $0.00000285, with the real upside tied to the next market cycle in 2028–2029. For a trader who understands the swings and sizes accordingly, that volatility is the appeal; for anyone expecting fundamentals to catch a falling price, there are none here. The honest read is that Pepe rewards timing and conviction about sentiment, and punishes the assumption that it owes anyone a recovery.
How to trade Pepe on PrimeXBT
On PrimeXBT you can take a position on Pepe in either direction. CFDs on PEPE can be traded long or short, so you are not forced to bet only on a rally — short selling lets you trade a decline too. Leverage magnifies gains and losses alike, which matters more than usual on an asset this volatile, so position sizing and a stop-loss earn their keep on every trade. Trade on your own analysis and risk tolerance, and never stake more than you can afford to lose.
Trading involves risk.
How we build this forecast
This outlook is put together by PrimeXBT’s analysts rather than pulled from a single price feed. We start from where PEPE trades today, read its position against the 50- and 200-day moving averages and the support and resistance levels traders are watching, and weigh the only things that actually move a meme coin — Bitcoin’s direction, the meme-coin cycle, and retail attention — against the macro backdrop of U.S. interest-rate policy. The yearly ranges combine that technical read with the market cycle; the long-range figures lean on trajectory, not precision.
None of this is a guarantee. Pepe is more volatile than almost anything else on the board, has no fundamentals to anchor it, and one shift in sentiment can move it faster than any forecast expects. Treat every figure here as a considered estimate, not a promise — we revisit and update the outlook monthly as the data changes.
How much will Pepe be worth in 2026?
Our outlook averages near $0.00000285 for 2026, with the year spent close to current levels rather than breaking out.
How much will Pepe be worth in 2030?
Our 2030 view averages near $0.00000505, easing off the 2029 cycle peak. A number this far out is a direction, not a target.
What will Pepe be worth in five years?
See 2030 above. A meme coin five years out is close to a coin flip, so read the figure as an arc rather than a price to bank on.
Will Pepe reach 1 cent?
Not on any realistic path. One cent against Pepe's 420.69 trillion supply implies a market capitalization above four trillion dollars, larger than the entire crypto market today. Our modeled peak through 2030 is a small fraction of a cent.
Author



 Risk Disclaimer
The content provided here is for informational purposes only. It is not intended as personal investment advice and does not constitute a solicitation or invitation to engage in any financial transactions, investments, or related activities. Past performance is not a reliable indicator of future results.
The financial products offered by the Company are complex and come with a high risk of losing money rapidly due to leverage. These products may not be suitable for all investors. Before engaging, you should consider whether you understand how these leveraged products work and whether you can afford the high risk of losing your money.
The Company does not accept clients from the Restricted Jurisdictions as indicated in our website/ T&C. Some services or products may not be available in your jurisdiction.
The applicable legal entity and its respective products and services depend on the client’s country of residence and the entity with which the client has established a contractual relationship during registration.