Traders use shooting star candlestick patterns to forecast upcoming bearish trends, interpreting the price decline as a sign of sellers dominating the market. When trading with shooting stars, investors focus on entry points, stop-loss strategies, and profit targets. They often wait for confirmation from subsequent candlestick patterns to make sure the price decline is true, and usually act on this information by selling or shorting if the following pattern also signals a price drop.
By helping traders anticipate market trends, shooting star patterns play a crucial role in helping them make trading decisions.
The advantages of shooting stars include the fact that they are easy to recognise and are useful in identifying upcoming price trend reversals. However, they can occasionally give false signals and require confirmation from following candlesticks to ensure it’s a strong trend. Among the 35 most popular candlestick patterns, the seven main ones, including morning star, hammer, inverted hammer, piercing pattern, shooting star, hanging man, and doji, are the most widely recognised in technical analysis.
Key takeaways
- Shooting star candlestick: initial rise, followed by near-opening price fall
- Signifies a potential downward trend
- Used in technical analysis to predict bearish trends; confirmation from subsequent candlesticks is needed
What is a shooting star candlestick?
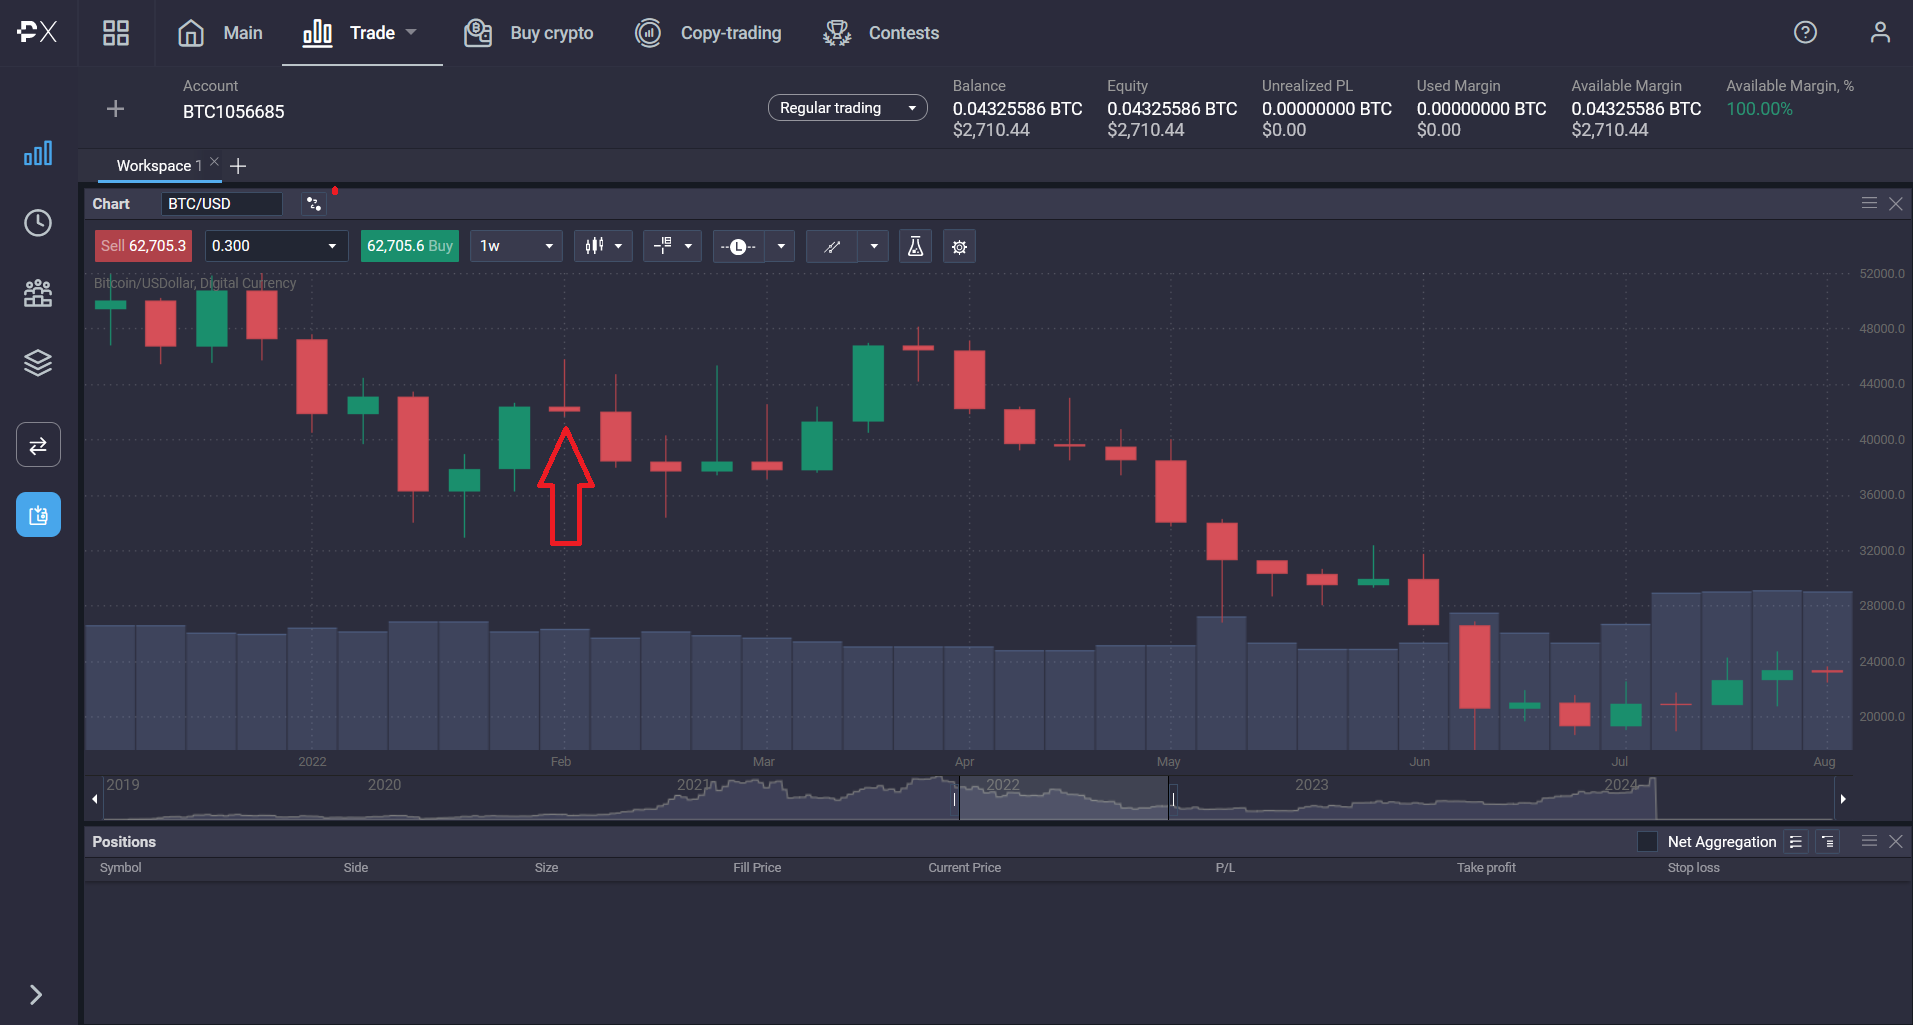
A shooting star candlestick is a pattern seen on price charts when an asset’s price initially rises after opening but then falls back near the opening price by the market close.
It consists of a small body with a long upper shadow indicating the price increase and a short or no lower shadow indicating the price drop. This pattern suggests the beginning of a downward market trend. Confirmation of a bearish trend reversal typically requires analysing the two or three consecutive candlestick patterns following a shooting star.
Anatomy of a shooting star
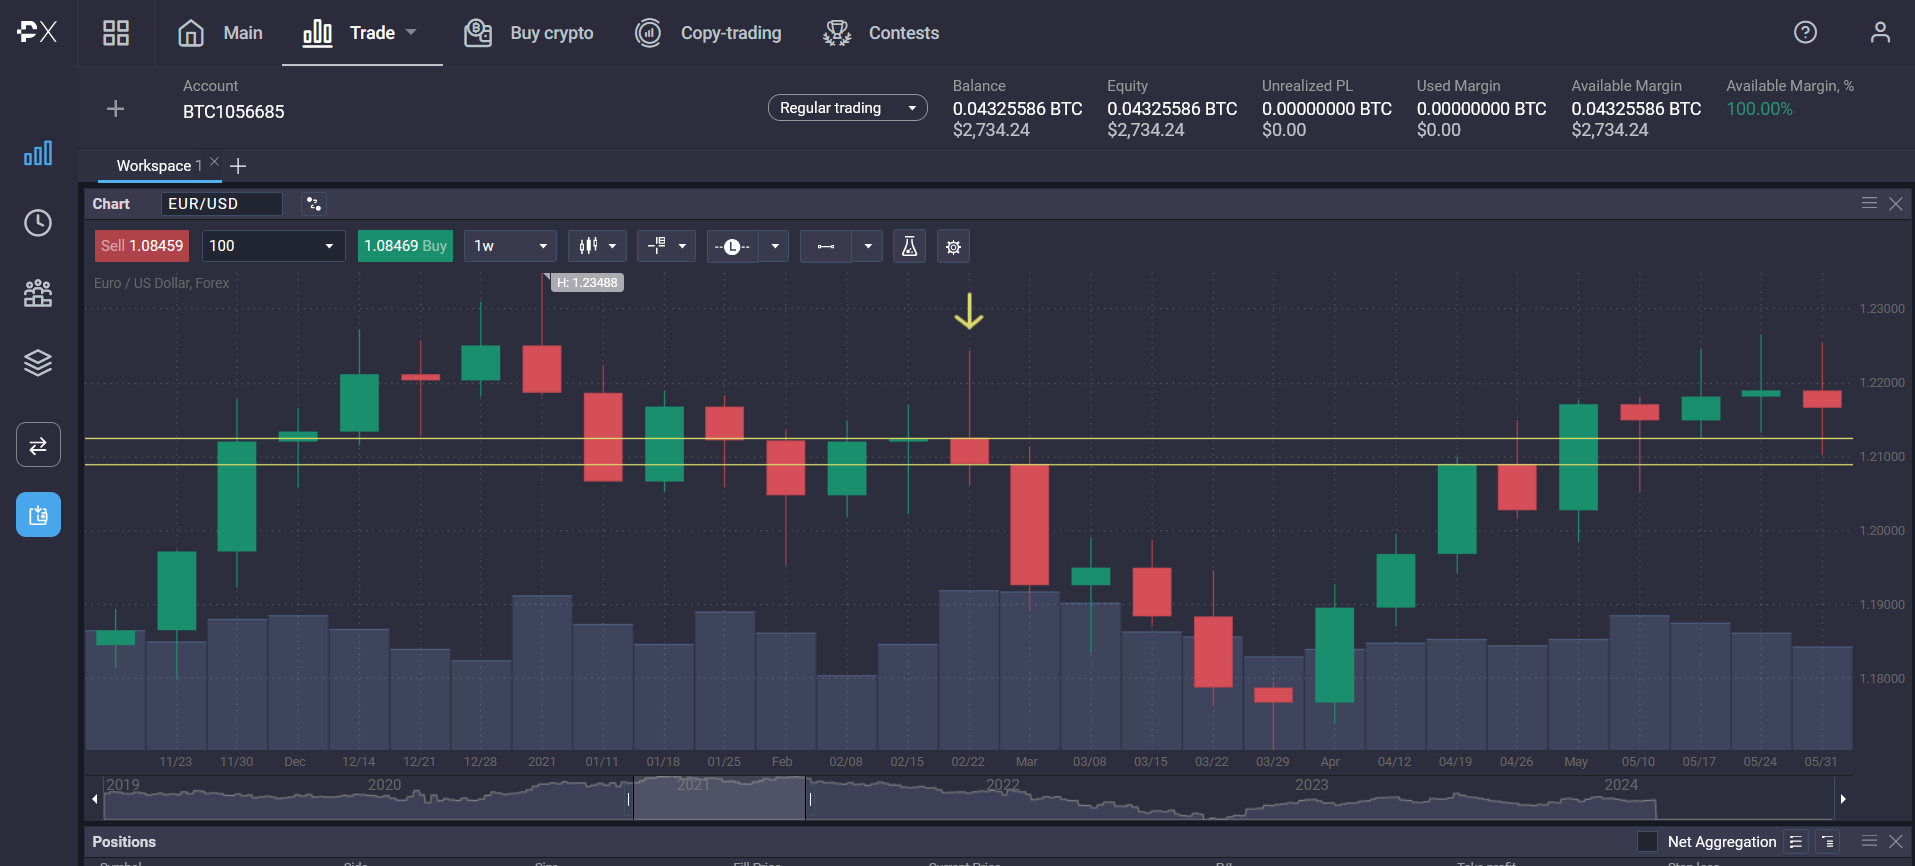
The shooting star candlestick is comprised of a small body, indicating a minimal difference between the opening and closing prices. Above this body is a long upper shadow, representing the highest price reached during the trading period.
Below the body; there is a short lower shadow or an absence of one, indicating the lowest price reached during the trading period.
Since the shooting star pattern is a bearish candlestick pattern, it’s easy to understand why the first candlestick pattern is red.
A red candlestick typically represents a period in which the closing price of a financial asset is lower than the opening price. This suggests that the sellers were more active during that period, leading to a decline in price. Red candlesticks are often associated with bearish sentiment in technical analysis, indicating potential downward trends or selling pressure in the market.
Interpreting the shooting star: signals and meanings
Shooting stars indicate a possible shift to lower prices, especially effective after 2-3 consecutive rising candles with higher highs. Initially, a shooting star opens strong, reflecting the buying pressure seen in recent sessions. However, by the session’s close, sellers drive the price back near the open, signaling a loss of buyer control and seller dominance.
The long upper shadow suggests buyers are losing ground as the price retreats to the open. The next candle gaps down and moves lower with significant volume, confirming the price reversal and suggesting further decline.
Confirming the reversal
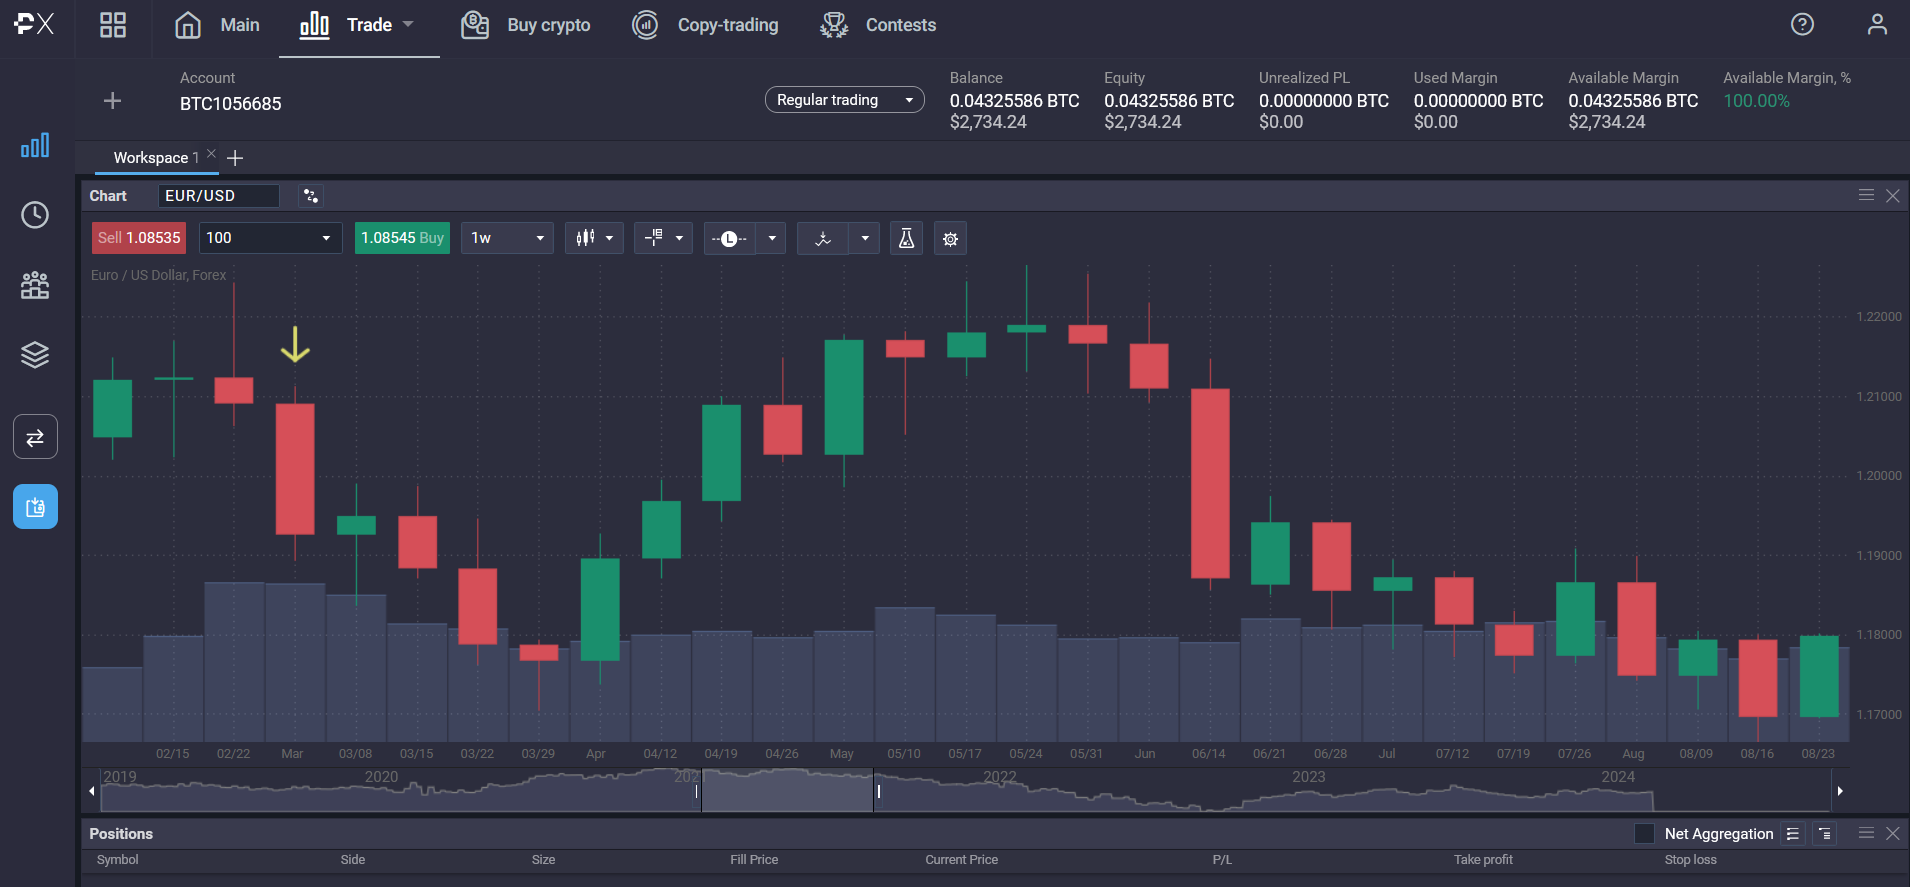
Confirming a shooting star pattern typically involves analysing the candlestick patterns that follow it. Traders often wait for the next one or two candlesticks after the shooting star to validate the pattern. Confirmation may come in the form of a downward movement in price in the subsequent candles, preferably accompanied by increased volume.
Traders may look for other technical indicators or signals that align with the bearish reversal the shooting star candlestick suggests, such as bearish divergences in momentum indicators or a break of key support levels. Overall, confirmation involves observing the price action behavior and other relevant factors to ensure that the shooting star pattern signals a potential downward reversal.
Trading strategies based on the shooting star pattern
The most straightforward way to trade a Shooting star candlestick pattern is to go short when you see the shooting star candlestick pattern confirmation candle, ensuring the trend reversal.
Here’s a few things to look out for you before you commit to the trade, though: make sure there’s an active bullish trend preceding the bearish reversal pattern.
Use a stop-loss limit order to ensure protection against an unforeseen upward price movement at the highest price point possible; it will help your trade stay open but protect you if it goes above a dangerous level.
Combining shooting stars with other technical indicators
Combining the shooting star candlestick pattern with other technical indicators can enhance its effectiveness in predicting market movements and confirming potential trend reversals. One common indicator used alongside the shooting star is the Relative Strength Index (RSI).
RSI helps you assess the overbought or oversold conditions of an asset, providing additional confirmation of a potential reversal when it diverges from the price action shown by the shooting star or inverted hammer.
Another popular indicator is the Moving Average Convergence Divergence (MACD). Using the MACD line and signal line crossover alongside the shooting star pattern or inverted hammer, you can identify momentum shifts and further confirm the bearish signal indicated by the shooting star.
Furthermore, incorporating support and resistance levels into the analysis can provide valuable insights. If a shooting star forms near a significant resistance level, it strengthens the bearish bias, whereas if it occurs near a support level, it may signal a potential bounce.
Additionally, volume analysis can complement the shooting star pattern. A high-volume shooting star is typically considered more reliable as it suggests increased participation behind the price reversal. Of course this is true of any trend, no matter the direction and signal.
By combining these indicators with the shooting star candlestick pattern, traders can make more informed decisions and increase the probability of successful trades.
Challenges and limitations of the shooting star pattern
The shooting star candlestick pattern, like any technical analysis tool, has challenges and limitations. One significant challenge is the potential for false signals. Not every shooting star pattern results in a considerable price reversal, and traders may experience losses if they rely solely on this pattern without confirmation from other indicators or analysis.
Another limitation is the need for confirmation. While the shooting star can warn you of a potential reversal, traders often wait for additional candlestick patterns or confirmation from other technical indicators before taking action. This delay in confirmation can sometimes result in missed trading opportunities or late entries into positions.
Additionally, market conditions and context play a crucial role in the effectiveness of the shooting star pattern. In strongly trending markets, shooting star patterns may be less reliable as they can be quickly overridden by the prevailing trend.
Moreover, in choppy or range-bound markets, the value of shooting star patterns may be diminished, making them harder to interpret accurately.
Furthermore, interpreting the size and shape of the candlestick and its shadows requires skill and experience. Novice traders may struggle to distinguish between genuine shooting star patterns and other candlestick formations or market noise.
Lastly, like all technical analysis tools, the shooting star pattern is not foolproof and should be used in conjunction with other forms of analysis and risk management strategies to mitigate potential losses.
Shooting star pattern examples
Waiting for confirmation/false signal
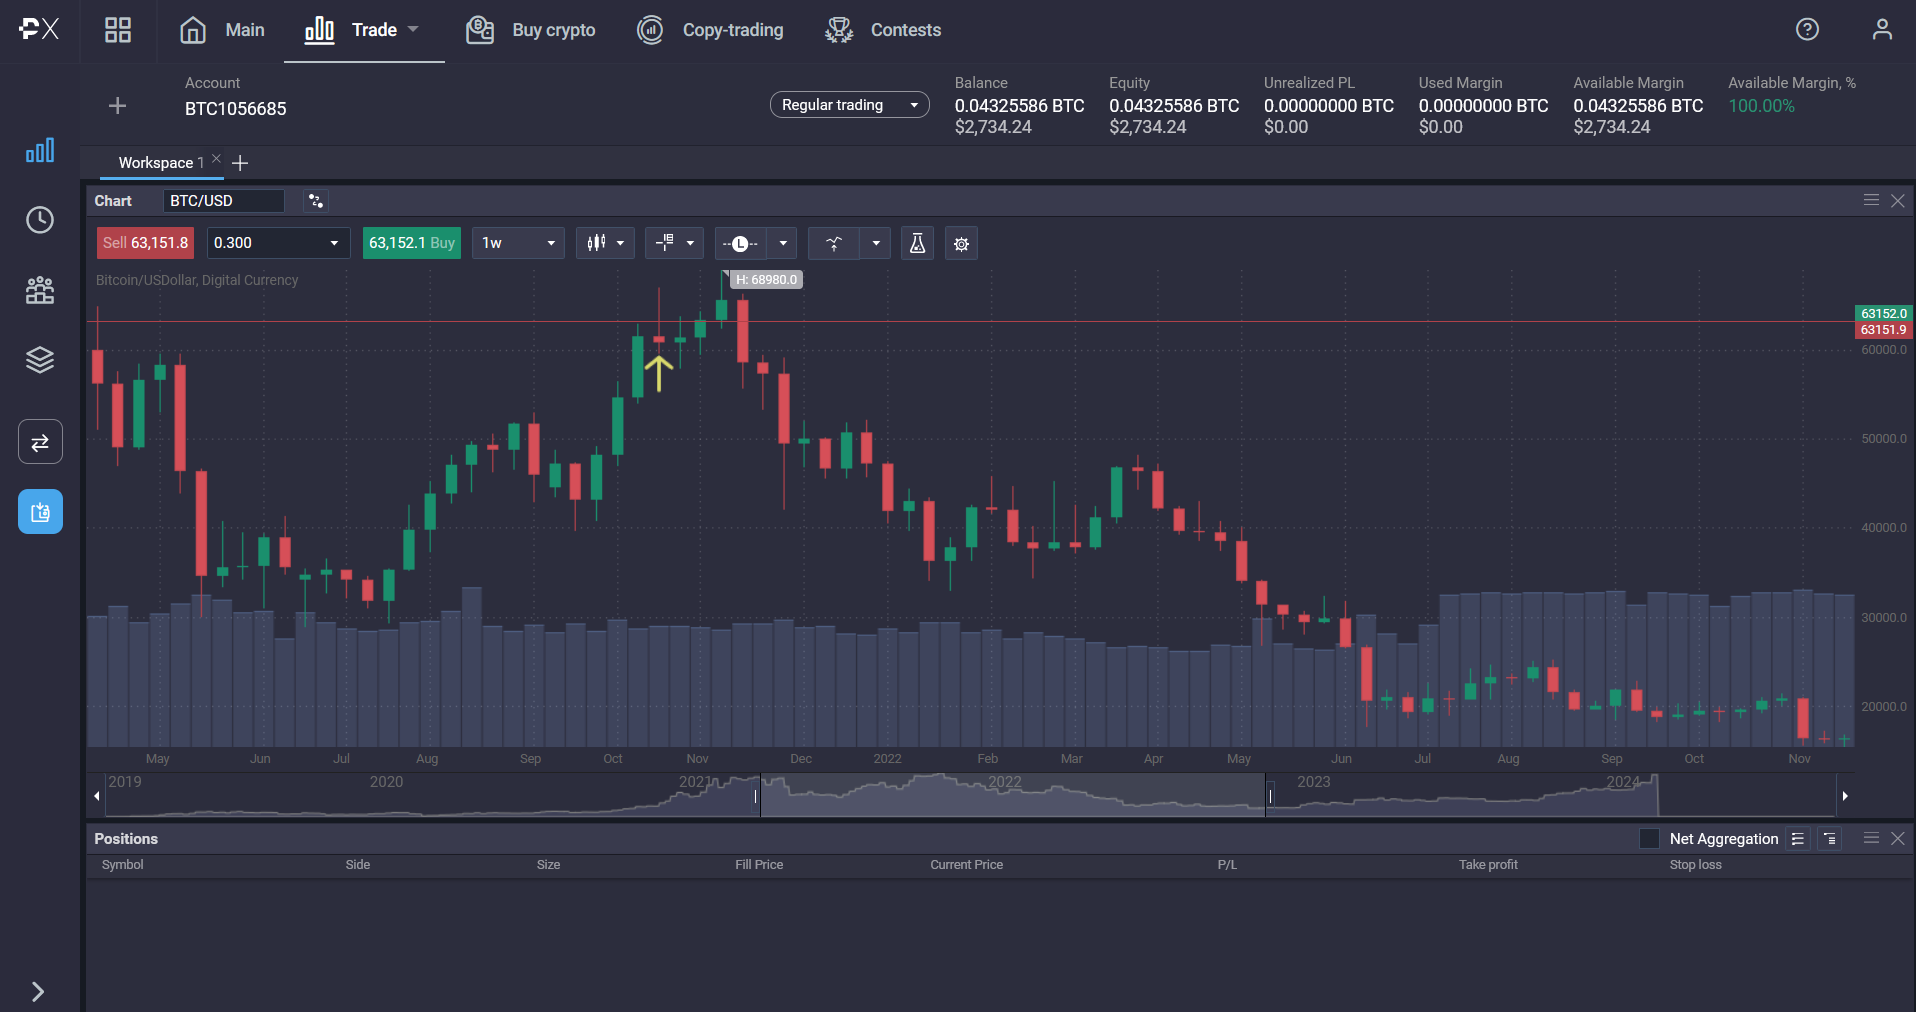
Waiting for confirmation candlesticks after a shooting star is crucial for several reasons. Firstly, the shooting star pattern alone may not provide sufficient evidence of a reversal.
By waiting for confirmation, traders reduce the risk of entering a trade based on a false signal, as confirmation candlesticks validate the potential reversal indicated by the shooting star.
Secondly, confirmation candlesticks provide additional insights into market sentiment and momentum. The behavior of subsequent candlesticks can help traders gauge the strength of the potential reversal suggested by the shooting star.
For example, a strong bearish candlestick following a shooting star on high volume adds weight to the bearish bias, while a weak or indecisive candlestick may indicate a lack of conviction among traders.
Furthermore, waiting for confirmation helps traders avoid entering trades prematurely. Rushing into a position based solely on the appearance of a shooting star without waiting for confirmation increases the risk of entering the market at an unfavorable price or during a temporary pullback rather than a genuine reversal.
Overall, waiting for confirmation candlesticks after a shooting star enhances the reliability of trading decisions, reduces the likelihood of false signals, and provides a more comprehensive understanding of market dynamics before taking action.
The next example is a very clear shooting star candlestick followed by a strong bearish candlestick pattern. But notice the length of the confirmation candlestick and how much shorter the length of the downtrend is as a result.
Clear shooting star candlestick followed by a downtrend
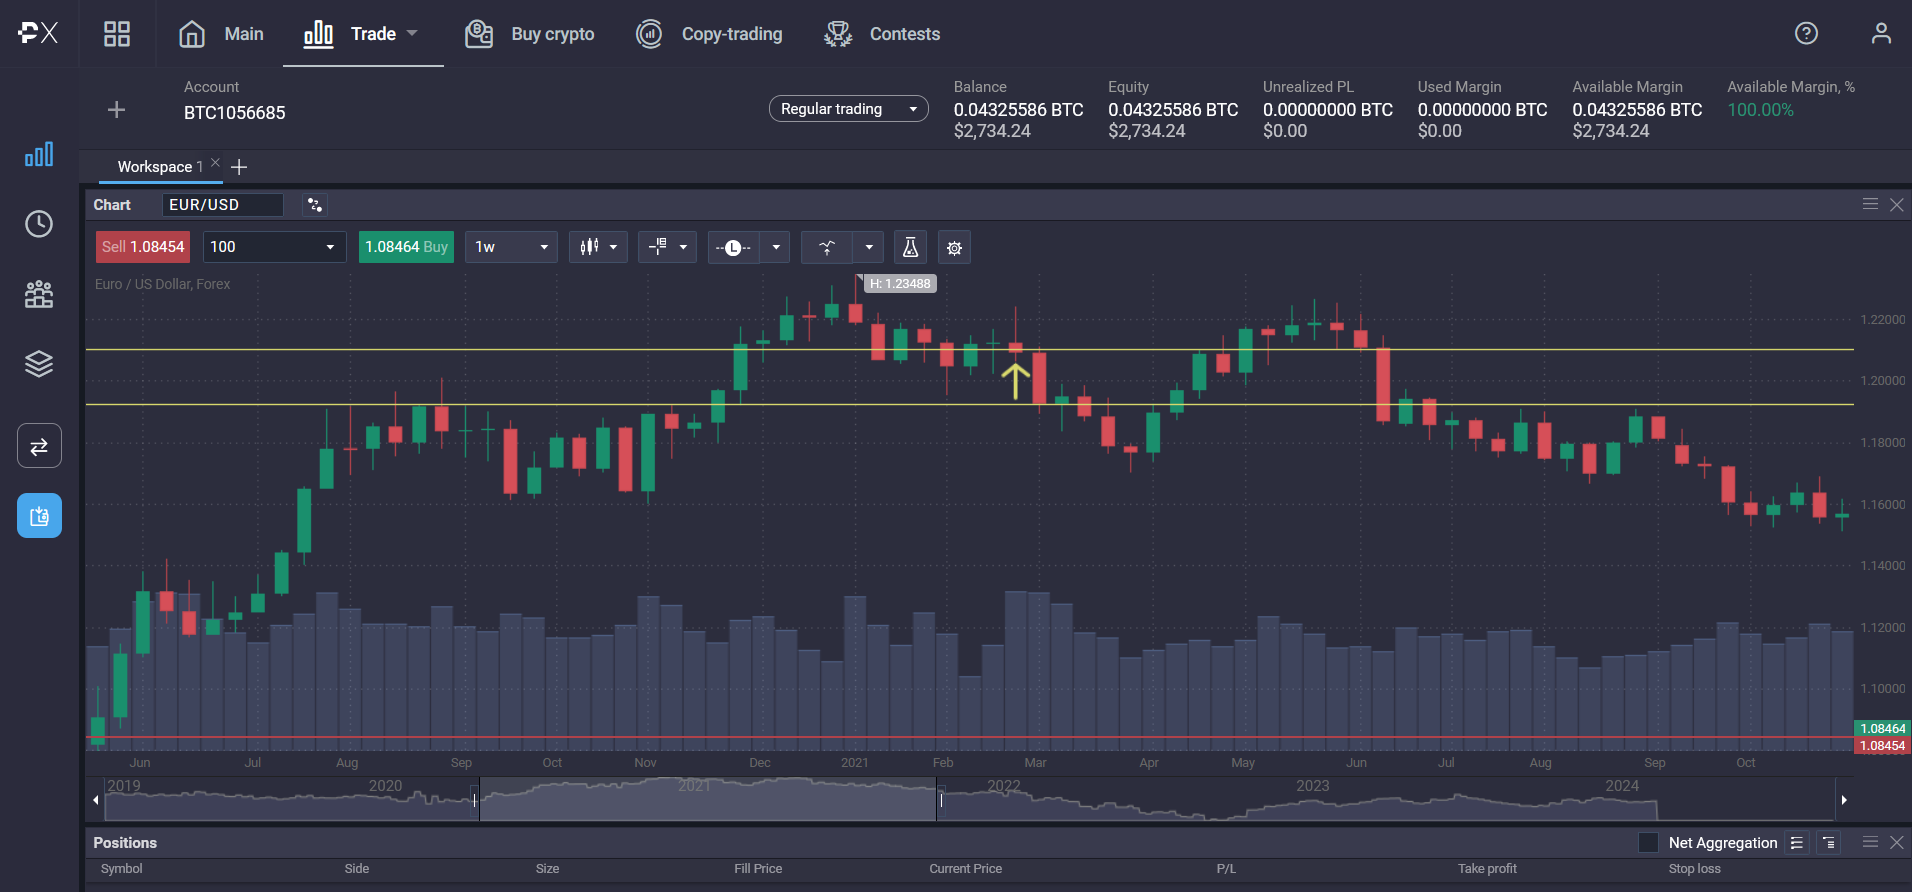
Even so if you entered at the top of the confirmation candle and exited at the first solid confirmation of the trend reversal, you’d still make a sizable profit.
Conclusion
The shooting star candlestick pattern (or the inverted hammer as it’s sometimes called) serves as a valuable tool for traders in technical analysis, particularly in forecasting bearish trends. By interpreting price declines as indications of seller dominance, traders can strategically enter trades, focusing on entry points, stop-loss strategies, and profit targets. However, waiting for confirmation from subsequent shooting star candlestick patterns is crucial to validate the price decline, mitigating the risk of false signals.
While shooting stars offer advantages such as easy recognition and trend identification, they come with limitations, including potential false signals and the need for confirmation from multiple indicators. Therefore, combining shooting stars with other technical indicators like RSI, MACD, and volume analysis can enhance trading decisions. Despite challenges like market conditions and interpretation complexities, waiting for confirmation candlesticks after a shooting star ensures more reliable trading decisions, reducing the risk of entering premature or misguided trades.
Through careful analysis and strategic implementation, traders can harness the predictive power of the shooting star pattern to navigate dynamic market environments and capitalise on profitable opportunities.
What is the pattern of a shooting star?
A shooting star candle is a candlestick with a long upper shadow, and a shooting star's body is at least half the size of its shadow. The opening price of the candle is close to the closing price of the previous candle. The shooting star occurs during an uptrend.
Is a shooting star candlestick bullish?
Yes the shooting star is considered a bearish candlestick pattern, even though the opening price can be lower. It is a reversal pattern so the shooting star occurs during an uptrend.
What is the difference between a hammer and a shooting star?
They are inverse to each other. Although you may see shooting star candle sometimes called an inverted hammer candlestick.
How do you trade shooting star candlesticks?
You trade the shooting star candle by entering when the downtrend is confirmed and exiting when the trend reverses.
The content provided here is for informational purposes only. It is not intended as personal investment advice and does not constitute a solicitation or invitation to engage in any financial transactions, investments, or related activities. Past performance is not a reliable indicator of future results.
The financial products offered by the Company are complex and come with a high risk of losing money rapidly due to leverage. These products may not be suitable for all investors. Before engaging, you should consider whether you understand how these leveraged products work and whether you can afford the high risk of losing your money.
The Company does not accept clients from the Restricted Jurisdictions as indicated in our website/ T&C. Some services or products may not be available in your jurisdiction.
The applicable legal entity and its respective products and services depend on the client’s country of residence and the entity with which the client has established a contractual relationship during registration.


