Bitcoin fell 3% last week, marking the second straight weekly decline. From a high of 67,300 at the start of last week, it fell to a low of 63,500 on Friday, its lowest level since mid-May. At the beginning of the new week, the price is falling further, dropping towards 62k. While the largest Cryptocurrency has lost almost 10% in just two weeks, it remains within the familiar 60k to 70k range, within which it has traded since the start of March.
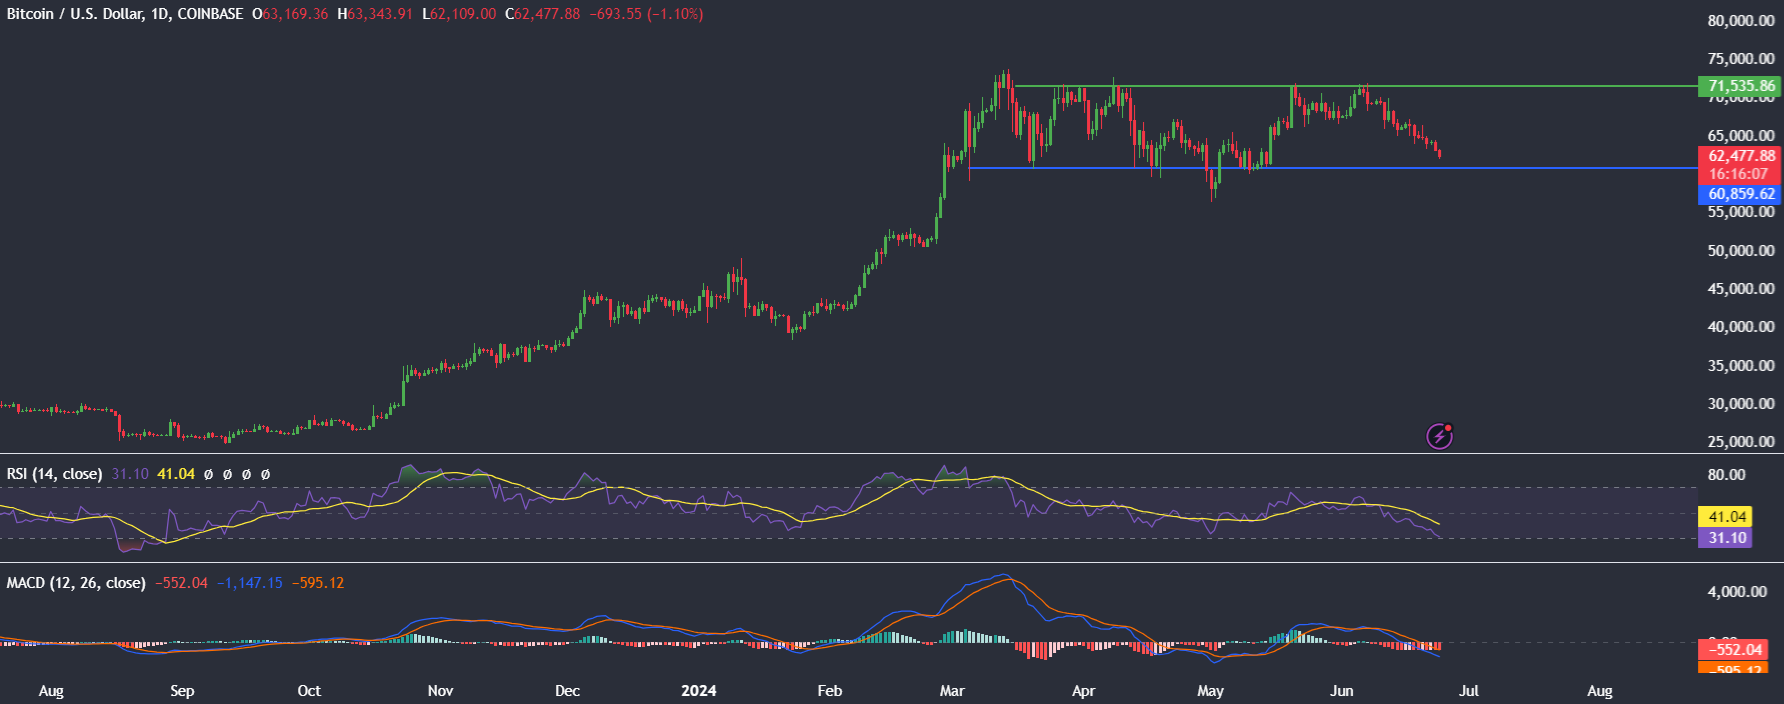
The selloff in Bitcoin bled through to the altcoin market, which was a sea of red across the week. Ether fell 3.6%, and BNB fell 3.3%, moving further from its record high reached at the start of the month. Meanwhile, Solana tumbled 11% and Shiba Inu 15%.

Bitcoin – stocks divergence
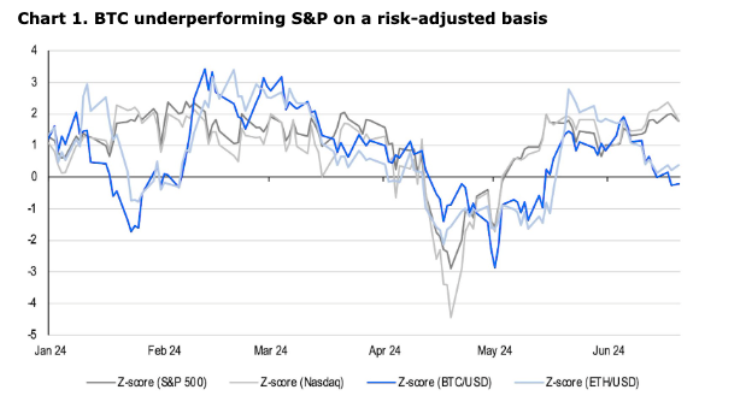
Interestingly, while Cryptocurrencies fell across the week, US equities rose, with the S&P500 and the Nasdaq pushing to fresh record highs. This has made the divergence between Bitcoin and equities starker. The S&P500 rose 0.6% last week, its third straight weekly rise.
The divergence could be explained by the flattening of the 2-year and 10-year US bond yields. Equity prices are often more sensitive to the longer-dated bond yield curve, which has been falling faster than the front-end yields. The 2-year yields are more sensitive to adjustments in expectations surrounding the Federal Reserve’s monetary policy and interest rate cuts.
USD gains vs BTC losses
This, along with other major central banks starting to cut rates, has also led to a continued rise in the USD. Last week’s US data was mixed, with retail sales coming in weaker than expected and jobless claims remaining near a 9-month high. However, service sector activity (PMI) was considerably stronger than expected. Meanwhile, Fed officials were consistent in their view that one rate cut this year looks appropriate, which aligns with the projections made at the June Fed meeting.
The SNB joined the BoC and the ECB cutting interest rates. The BoE also pointed to a possible rate cut as soon as August. This makes the Federal Reserve the least dovish of the major central banks, which favours the USD against most of its major peers.
While central bank expectations are a key driver, political factors also play their part. Election uncertainty is ramping up ahead of the first round of the French elections on June 30th and the UK elections on July 4th. Meanwhile, US elections are not until November, again favouring the USD.
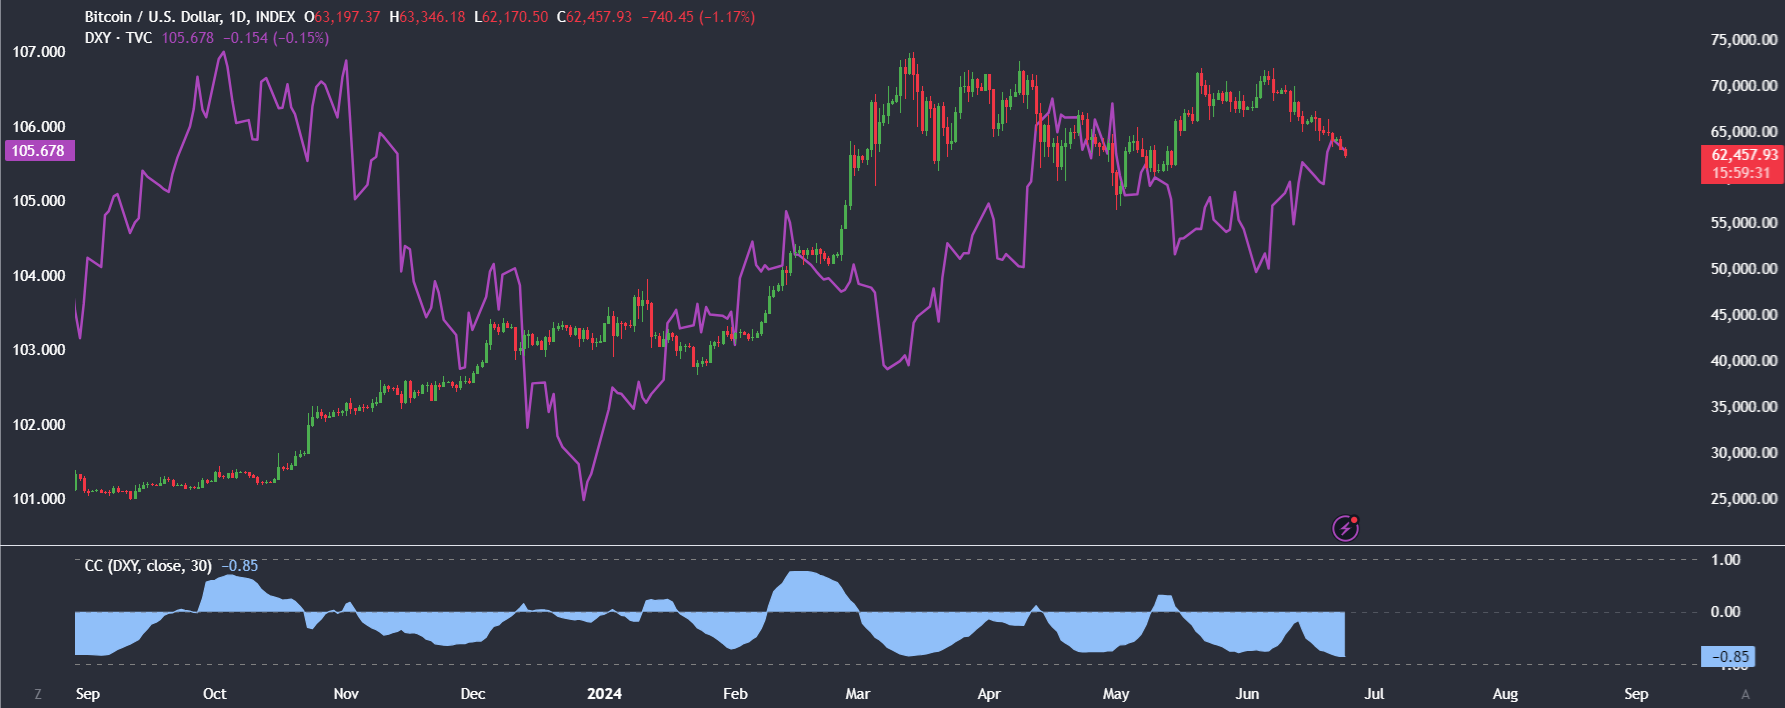
The rise in USD comes as the chart shows a strong negative correlation coefficient between USD and Bitcoin. Bitcoin and USD have a -0.85 correlation coefficient, the lowest since April 2023. A -1 correlation coefficient means a perfectly negative correlation. When the USD rises, Bitcoin falls.
AI gains as Bitcoin falls
The other point to note regarding the divergence between the US equities and Bitcoin is the sectors driving the gains. A disproportionate amount of the gains seen in the S&P500 are being driven by technology categories and, more specifically, AI. Nvidia briefly leapfrogged Microsoft as the world’s most valuable company. Apple rallied just shy of 10% following its World Wide Developers Conference, where the tech giant announced its AI strategy and integration with OpenAI.
Recently, Crypto has lacked similar catalysts. The SEC Ether Exchange Traded Fund approval in mid-May and the US House passage of the Financial Innovation and Technology for the 21st Century Act sparked a flurry of activity in the Crypto market. However, things have quietened since then, with the market waiting keenly for the launch of ETH ETFs, which could be in July.
Could Bitcoin fall to 60k amid BTC ETF outflows?
The selloff in Bitcoin has also come as most US-based Bitcoin ETFs have started to see considerable withdrawals. According to data from Farside, Bitcoin ETF outflows totalled $545 million in the past week, despite being a 4-day trading week due to the Juneteenth US mid-week holiday.

In fact, Bitcoin ETFs recorded six straight days of outflows from June 13 to 21. Interestingly, Fidelity’s FBTC has seen the most outflows, surpassing even Grayscale’s GBTC. However, BlackRock’s IBTC remained stable as it continued to Hodl.
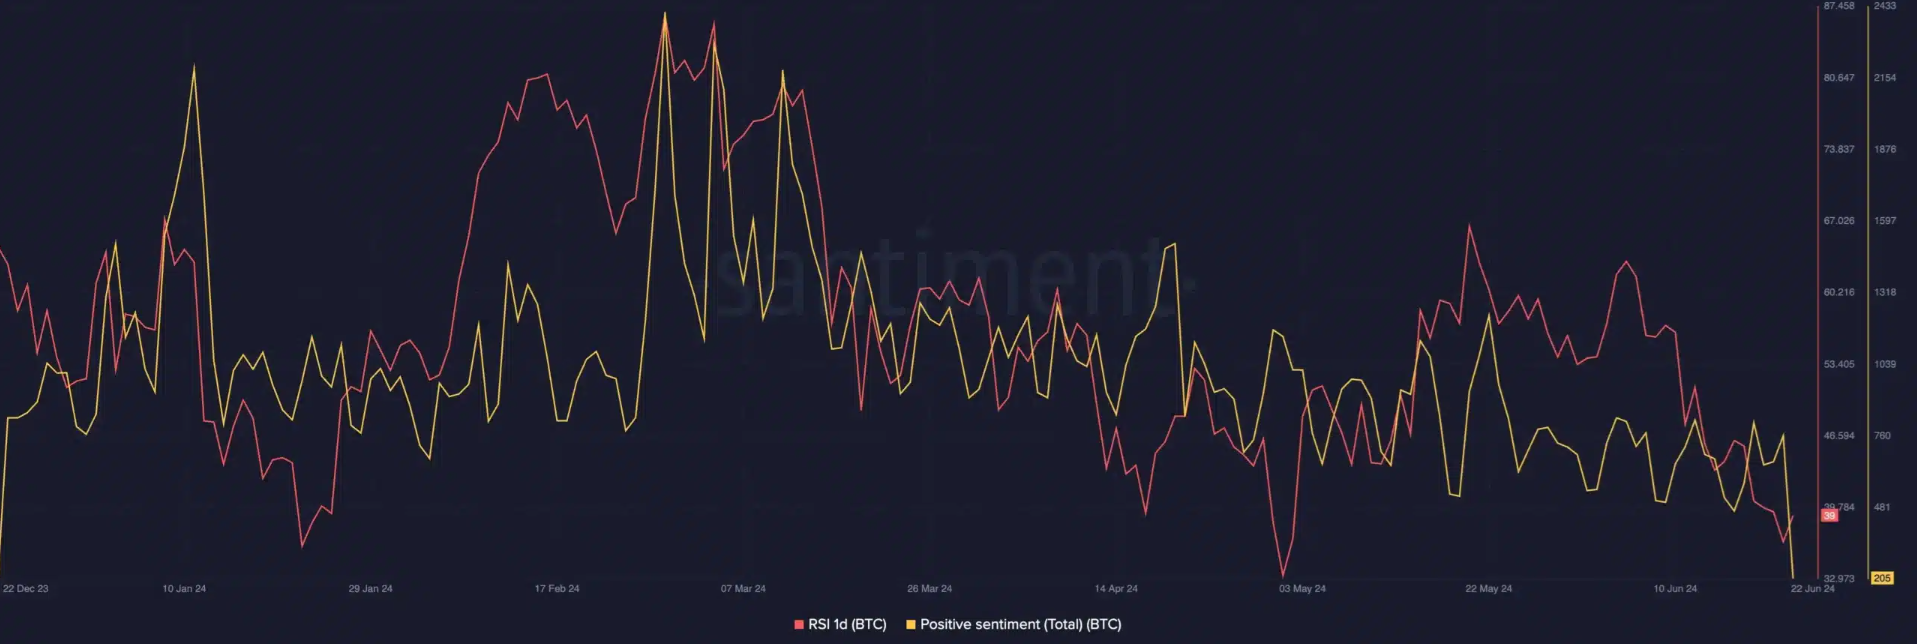
The spot Bitcoin ETF outflows reflect growing investor caution and have sparked concerns over Bitcoin’s near-term performance. The outflows highlight a prevailing bearish sentiment. They have come at a time when Bitcoin’s trading volume and price have shown weakness, adding to the uncertain near-term outlook and raising questions over whether Bitcoin could fall to test 60k again in the coming weeks. Santiment data shows that positive sentiment has dropped dramatically.
Or is it on the cusp of a mega rally?
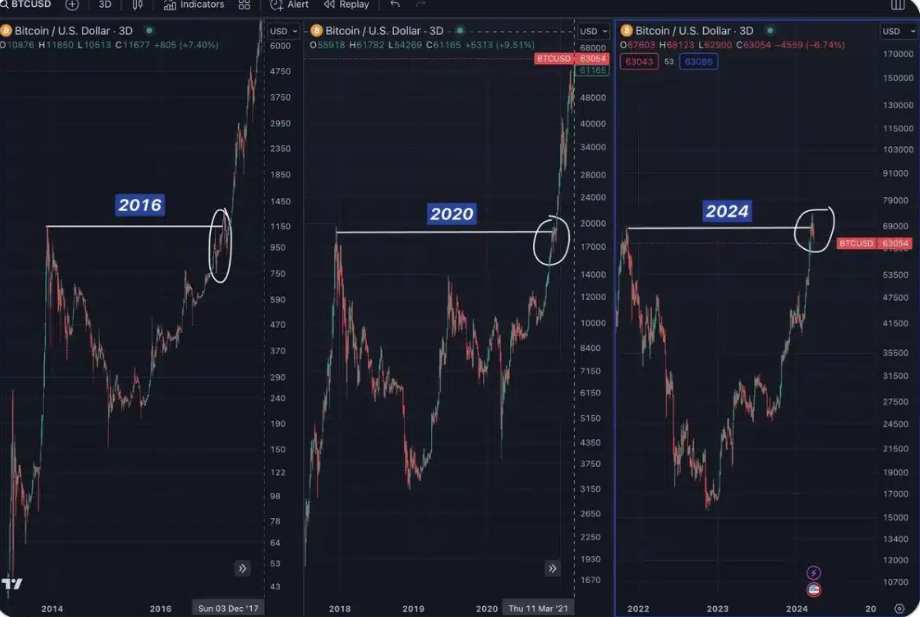
That said, not everyone is convinced that a retest of 60k is on the cards. Similarities could also be drawn in the charts between previous Bitcoin halving cycles. The current price action could mirror past patterns. If this is the case, then a bull run could be on the cards sometime soon.
Gold & Bitcoin
While US equities have achieved fresh all-time highs, Bitcoin is not alone with range-bound trading. Gold, which is also considered a store of value and hedge against inflation, often compared to Bitcoin, has also traded in a familiar range in recent months.

In a similar fashion to Bitcoin, Gold rose to a record high in Q1 of 2024 and has since seen choppy trade action in Q2. The prospect of the Fed keeping rates high for longer has weighed on the precious metal, even though central banks continue to buy up Gold. Meanwhile, safe haven flows have steadied as geopolitical tensions continue to simmer. Russian – Ukraine as well as Israel – Hamas wars continue without a clear end in sight.
A lack of fresh macro momentum, quiet Crypto news, and an internal Crypto narrative have resulted in falling volatility. Bitcoin annualised volatility has fallen to its lowest level since October last year.

That said, things could change in the second half of the year. Not only is there the US Presidential election but there is also the prospect of a Federal Reserve interest rate cut and cuts from other major central banks, which could improve liquidity and drive volatility.
Looking ahead
This week’s main focus will be inflation, with inflation data due from Canada and Australia, and the key release will be from the US on Friday. US core PCE is the Fed’s preferred measure for inflation, is expected to show that inflation cooled on a monthly basis but remained sticky at 2.8% on an annual basis.
The data comes as Federal Reserve officials have reiterated that they need more evidence that inflation is cooling before starting to cut rates. Signs of sticky inflation could push back rate-cut expectations, keeping liquidity tight which bodes poorly for Bitcoin and could pull the Cryptocurrency closer to 60k.
The content provided here is for informational purposes only. It is not intended as personal investment advice and does not constitute a solicitation or invitation to engage in any financial transactions, investments, or related activities. Past performance is not a reliable indicator of future results.
The financial products offered by the Company are complex and come with a high risk of losing money rapidly due to leverage. These products may not be suitable for all investors. Before engaging, you should consider whether you understand how these leveraged products work and whether you can afford the high risk of losing your money.
The Company does not accept clients from the Restricted Jurisdictions as indicated in our website/ T&C. Some services or products may not be available in your jurisdiction.
The applicable legal entity and its respective products and services depend on the client’s country of residence and the entity with which the client has established a contractual relationship during registration.


