
 8 min read
 Bitcoin coils under $87,374
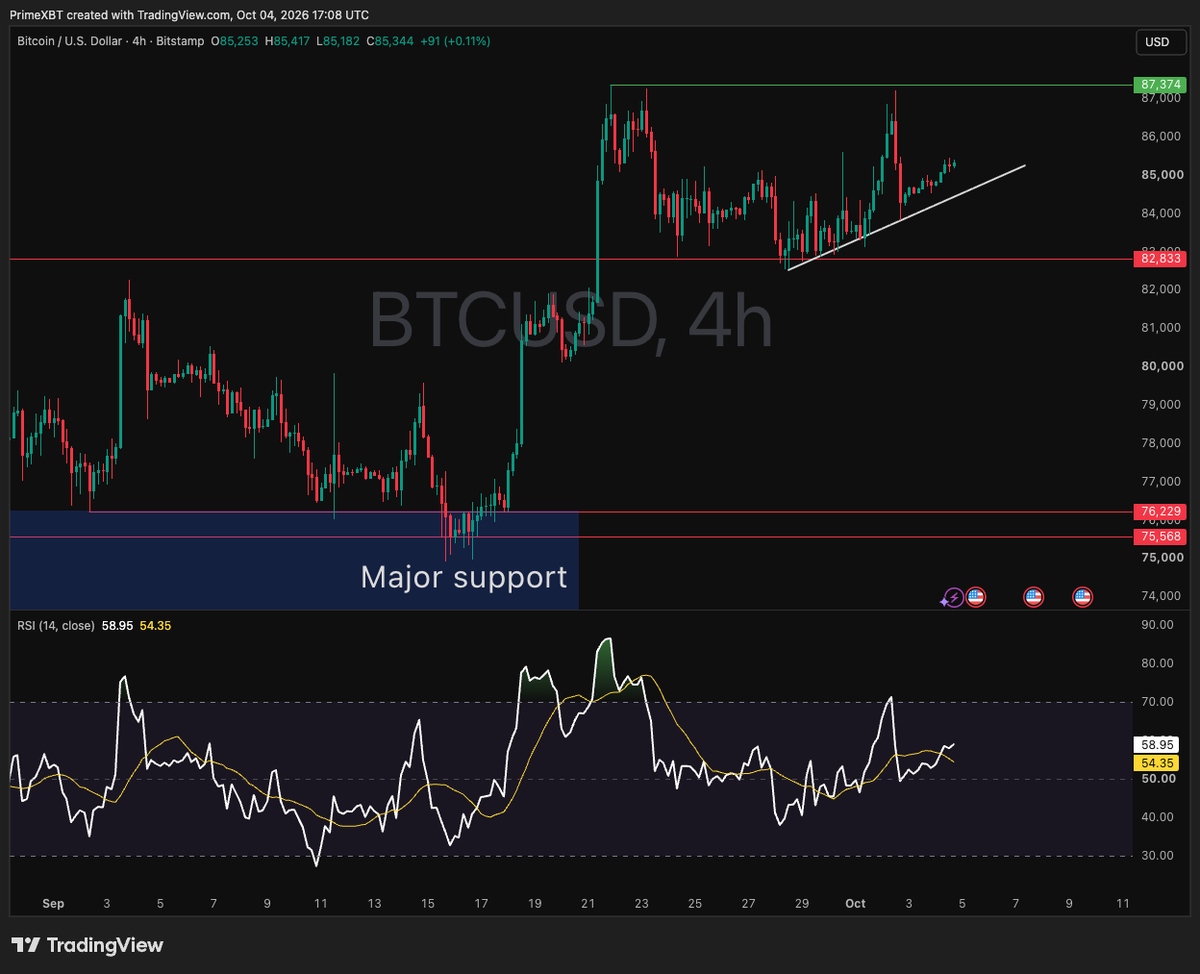
Bitcoin enters October after its strongest third quarter since 2017. Last week, the US payrolls miss (29,000 jobs against forecasts near 90,000) briefly lifted BTC to about $87,100 on October 2, but the move faded within hours. The reversal triggered roughly $433M in liquidations, about 74% of them longs, and price slipped to $84,600 before recovering.
Source: https://primexbt.com/price-chart/crypto/btc-usd
On the 4h chart, BTC trades at $85,344 above a rising trendline drawn from the September 28 low. Resistance at $87,374 has capped two rallies since September 22, and $82,833 is the horizontal floor. RSI reads 58.95, above its 54.35 average.
The first scenario is a sweep below the trendline toward $82,833 that flushes late longs, followed by a push higher; the liquidation map at the end of this report shows why that zone matters. The second is a direct break of $87,374 without a pullback. It looks less likely, but positioning already leans toward a dip, and crowded expectations are often where moves fail.
Crypto heatmap: ZEC and HYPE lag
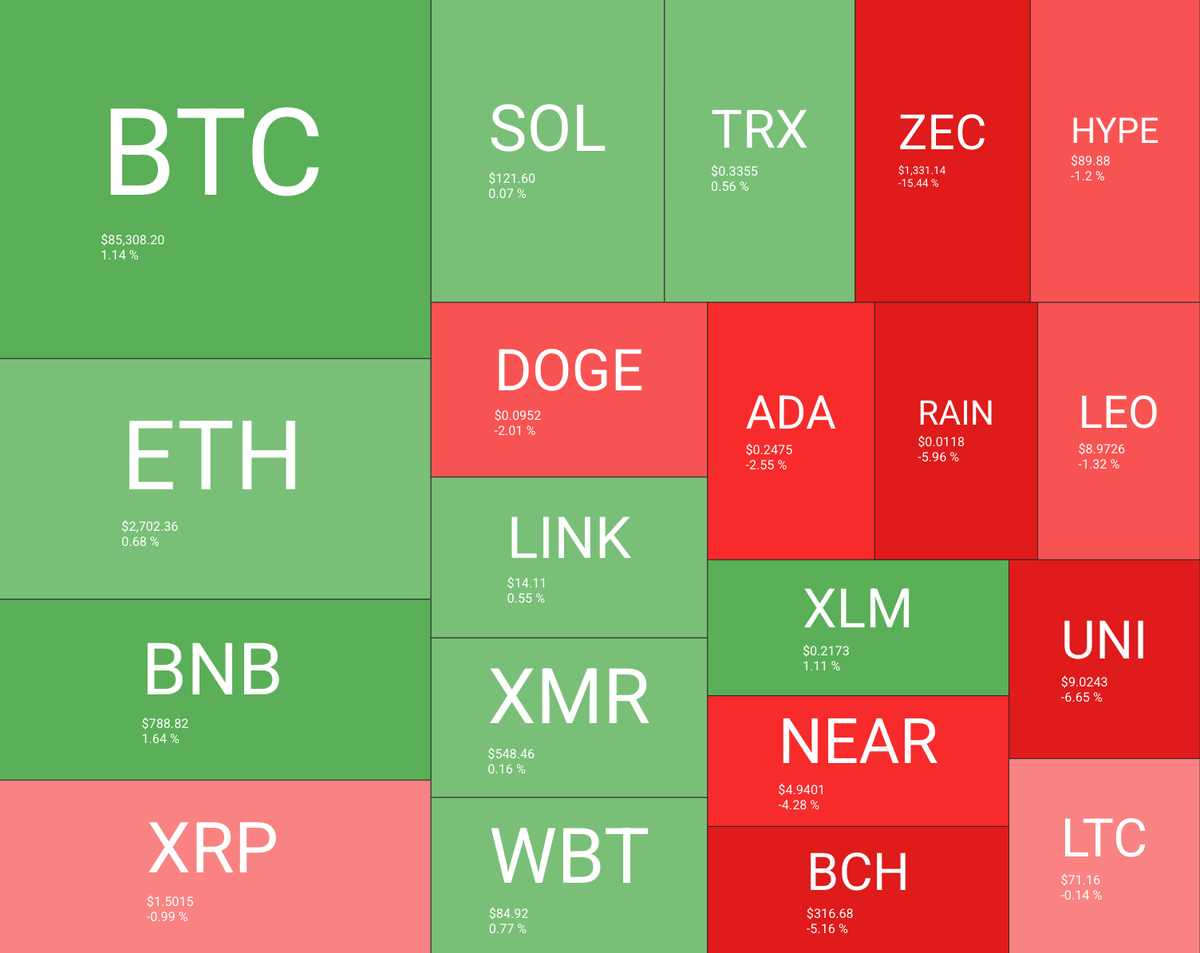
The heatmap is mixed. BNB (+1.64%), BTC (+1.14%) and XLM (+1.11%) lead, while ZEC (-15.44%), UNI (-6.65%), RAIN (-5.96%) and BCH (-5.16%) sit deepest in the red. ZEC is unwinding a rally that took it from under $500 in mid-August to nearly $1,700. It lost about 21% over the week, and Grayscale’s Zcash ETF recorded $93.56M of net outflows, its first negative week since late August.
Source: https://quantifycrypto.com/heatmaps
HYPE trades at $89.88 (-1.2%). It closed at $97.19 on September 22, just shy of $100, then sold off when Binance opened spot trading on September 24, sliding toward $89.89 the same day as traders used the new venue to exit. The listing section below puts that pattern in a wider context.
Altcoin Season Index eases to 68
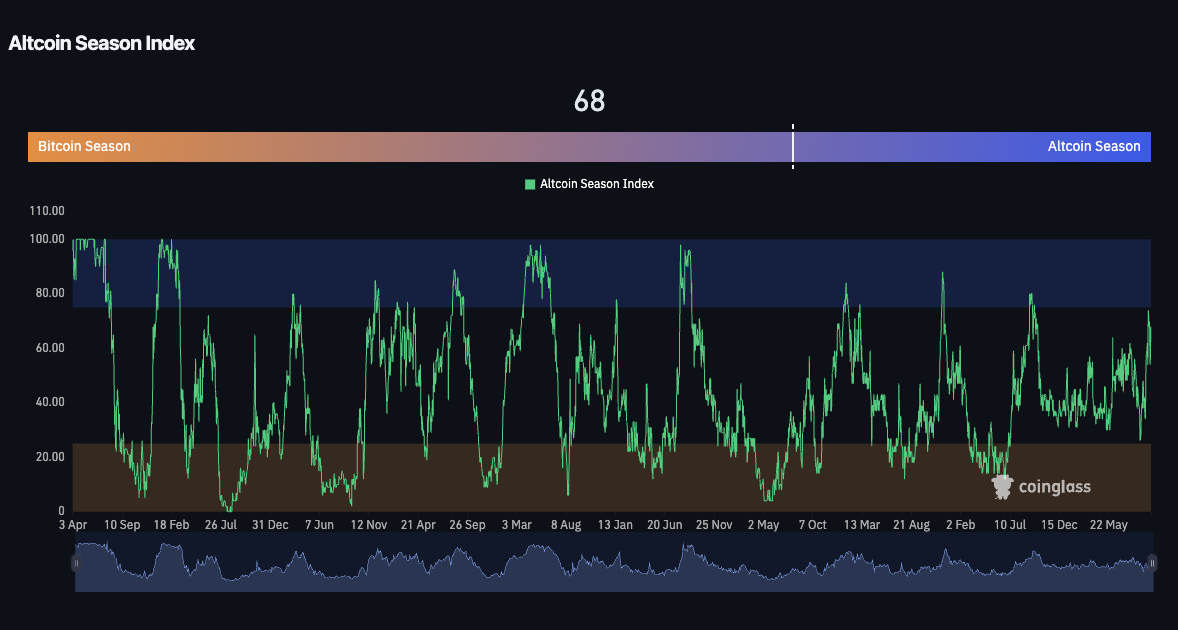
The Altcoin Season Index stands at 68 after touching the low 70s last week. That is below the 75 threshold for a confirmed altcoin season and well above the 25 line that marks Bitcoin season.
Source: https://www.coinglass.com/pro/i/alt-coin-season
Nothing decisive changed on the week. If BTC stays inside its $82,833 to $87,374 range, liquidity has room to rotate into altcoins, which would lift the index back toward 75, consistent with the OTHERS/BTC setup discussed below.
Fear and Greed Index holds in Greed
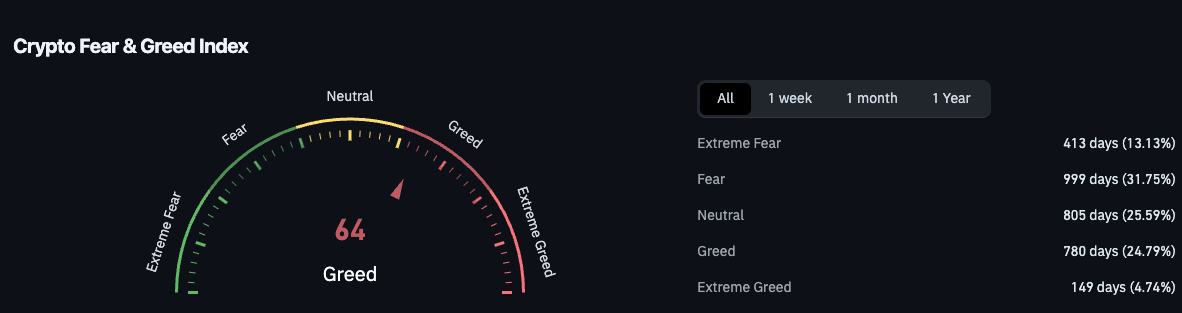
The Crypto Fear and Greed Index reads 64, inside the Greed zone but off its late-September peak near 79. Across its full history, the index has spent 24.79% of days in Greed and only 4.74% in Extreme Greed.
Source: https://www.coinglass.com/pro/i/FearGreedIndex
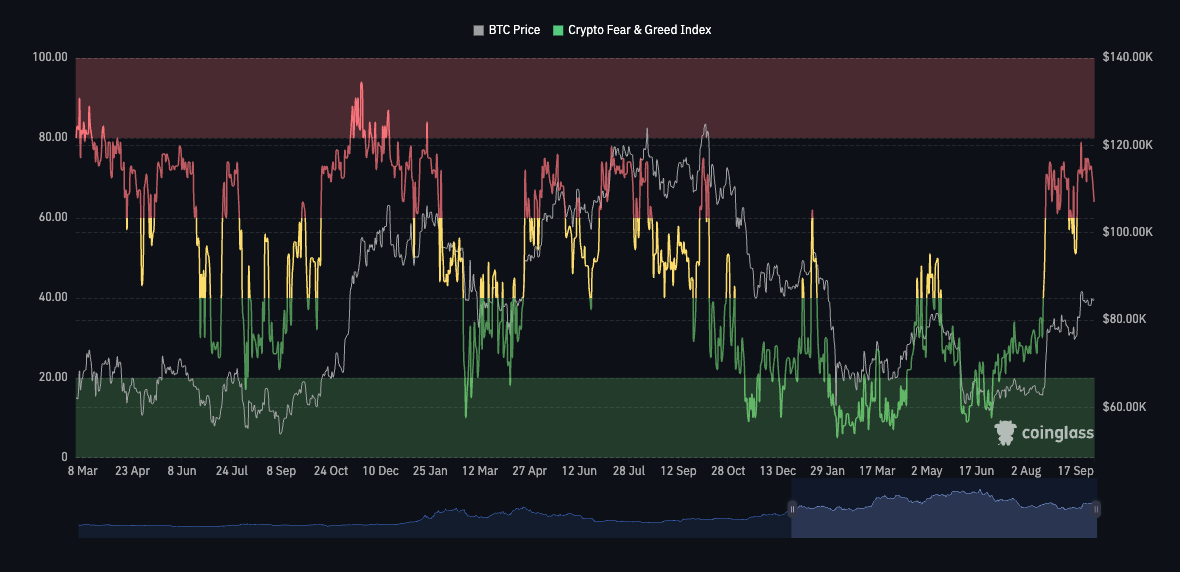
The history chart shows sentiment cooling faster than price: the index is about 15 points off its peak while BTC holds near $85,000. A slide toward the yellow Neutral band (40 to 60) would reset sentiment without breaking structure. In past cycles, resets into that band have come before fresh pushes toward the red Extreme Greed block.
What happens to tokens after a Binance listing
The chart tracks Binance listings from the past six months. The median token traded at 47.9 after 90 days, a 52% loss from its listing-day price, while BTC over the same windows ended at 92.6, a 7% decline. Even the middle 50% of listings finished the window between roughly 32 and 69.
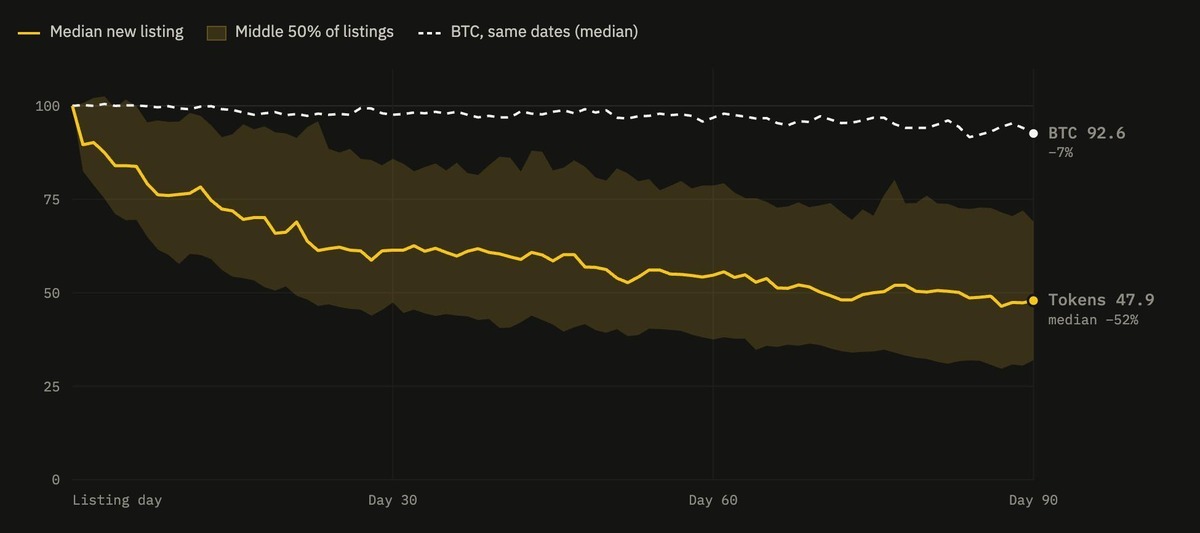
New listings lost more than seven times as much as BTC over their first quarter. The pattern is not new: by one count, 24 of 27 tokens Binance listed in 2025 posted negative returns, with an average loss of 44%. HYPE joined Binance spot only on September 24, so the 90-day window this chart measures has barely started for it.
OTHERS/BTC tests its 2025 ceiling
OTHERS/BTC, the market cap of altcoins outside the top 10 priced in Bitcoin, posted its highest monthly close since January 2025. On the weekly chart, the ratio is pressing the horizontal ceiling near 0.147 that has capped it since early 2025, while lows have risen since late 2025. That shape is an ascending triangle. This week’s candle poked to 0.152625 but trades back at 0.143349, down 4.11%.
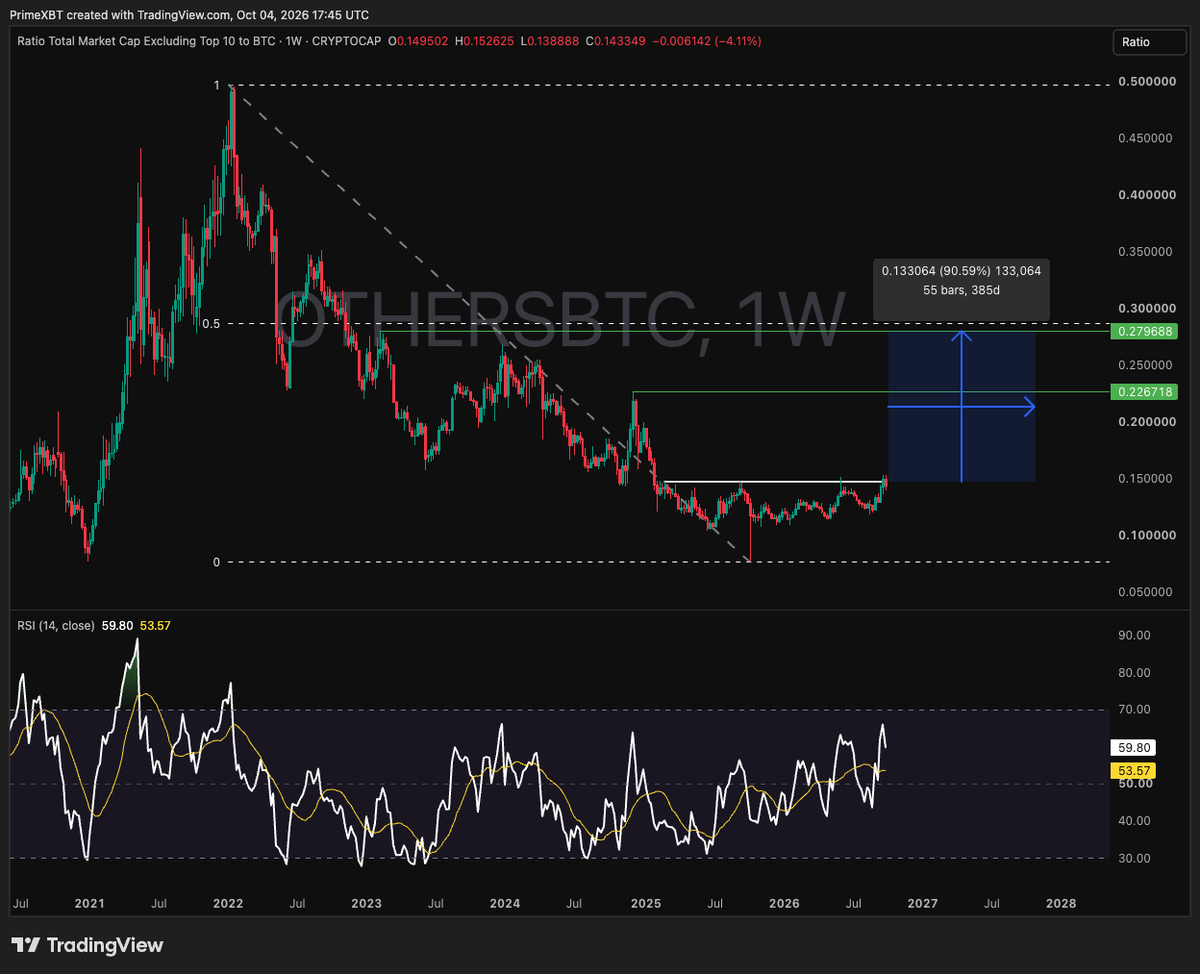
A weekly close above the ceiling would complete the triangle. The next reference is 0.226718, the December 2024 high. The 0.5 retracement of the entire decline from the 2022 peak sits at 0.279688, about 90.59% above the breakout zone. A breakout would not guarantee an altcoin season, but it would favor many coins outperforming BTC. RSI at 59.80, above its 53.57 average, leaves room before overbought.
OTHERS monthly MACD turns positive
On the monthly chart, OTHERS (total crypto market cap excluding the top 10) sits at $246.16B after a strong September candle. The MACD histogram has turned positive at 1.03B for the first time since early 2025, with the MACD line (-4.48B) crossing above its signal (-5.5B).
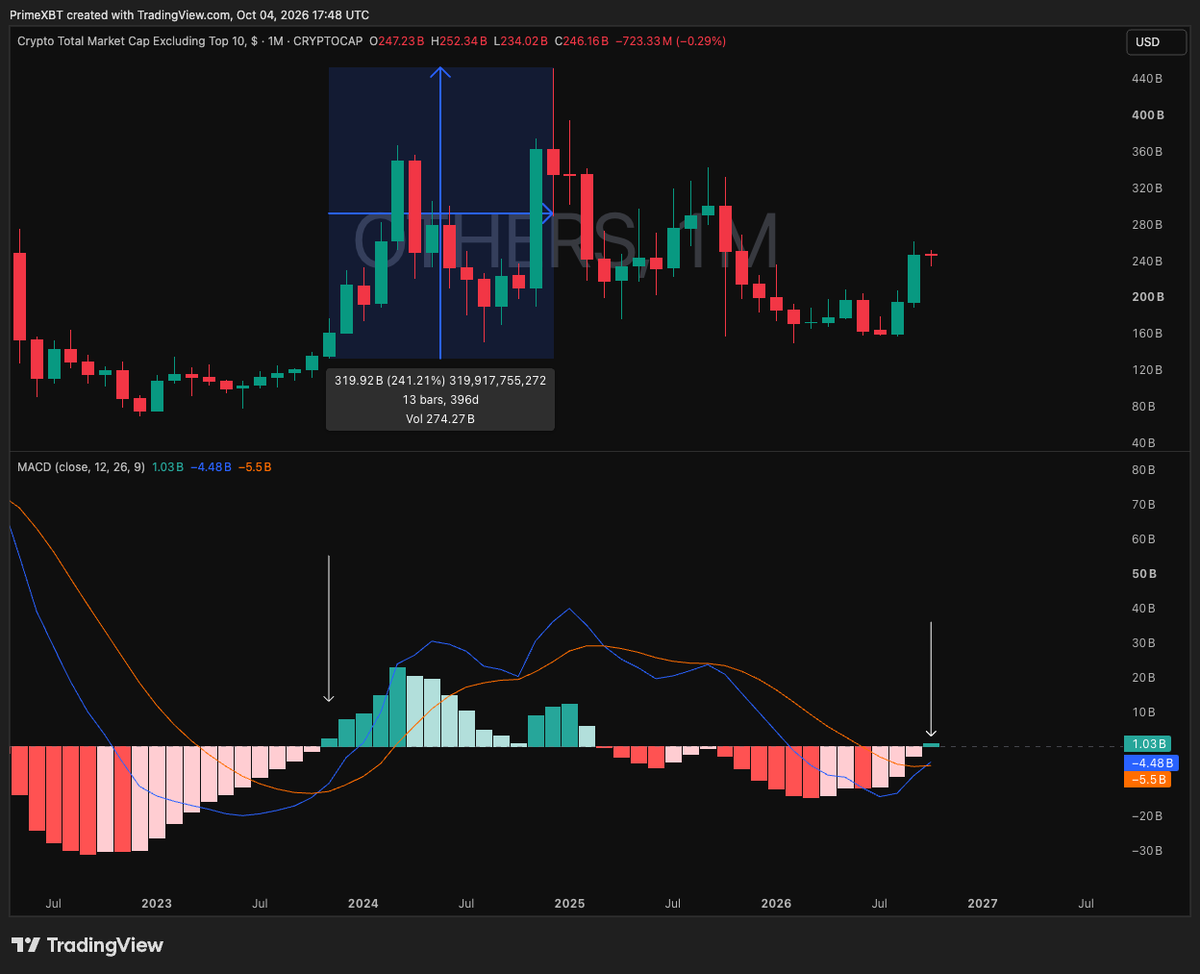
The last time the monthly histogram turned green, in late 2023, OTHERS rallied 241.21% over the following 13 months. One cross is not a cycle signal on its own, and both lines still sit below zero. As long as the histogram keeps expanding, the bullish read holds; a flip back to red would cancel it.
Bitcoin liquidation map
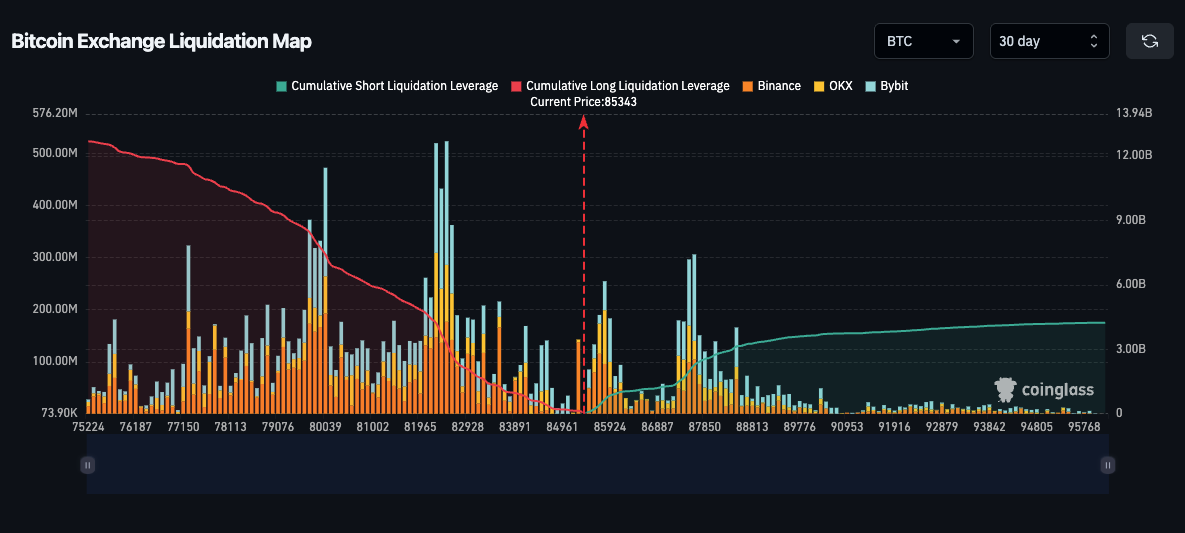
Leverage is skewed long. On the 30-day map, cumulative long liquidation leverage down to $75,224 totals about $12.3B, against roughly $4.3B of short leverage up to $96,000. The largest long clusters sit at $82,000 to $82,400 and near $80,000, with single bars of $470M to $520M. The main short cluster sits around $87,500.
Source: https://www.coinglass.com/pro/futures/LiquidationMap
Those clusters line up with the technical levels above: the $82,833 floor guards the long pocket, and the $87,374 ceiling sits just under the short pocket. A dip into $82,000 would flush a large share of crowded longs and reset leverage. If price then holds that zone, cleaner positioning would leave less forced selling in the way of another test of $87,374.
Conclusion
Bitcoin enters October in a tight $82,833 to $87,374 range after its best third quarter since 2017. Altcoin breadth is improving, with OTHERS/BTC at its 2025 ceiling and the OTHERS monthly MACD turning positive, while sentiment has cooled from near 79 to 64 and leverage remains long-heavy. That mix can support a broader bull phase if those ceilings break, but it also invites a shakeout first, and HYPE shows how quickly gains can fade. The practical approach is measured position sizes, taking profits into strength rather than chasing it, and letting the levels set the pace.
Trading involves risk.
Author



 Risk Disclaimer
The content provided here is for informational purposes only. It is not intended as personal investment advice and does not constitute a solicitation or invitation to engage in any financial transactions, investments, or related activities. Past performance is not a reliable indicator of future results.
The financial products offered by the Company are complex and come with a high risk of losing money rapidly due to leverage. These products may not be suitable for all investors. Before engaging, you should consider whether you understand how these leveraged products work and whether you can afford the high risk of losing your money.
The Company does not accept clients from the Restricted Jurisdictions as indicated in our website/ T&C. Some services or products may not be available in your jurisdiction.
The applicable legal entity and its respective products and services depend on the client’s country of residence and the entity with which the client has established a contractual relationship during registration.








