8 min read
 Technical picture
Bitcoin trades at $79,078.2 on the daily chart, up 1.15% on the session after a two week run that took price from roughly $62,000 to an intraday high of $81,455 on August 27. The move left a large imbalance on the chart between roughly $66,000 and $76,000, and price is now consolidating just above it. The rally was built on a Treasury announcement to at least double long bond buybacks to $4 billion per operation starting September 9, a softer dollar, and $1.92 billion of weekly spot ETF inflows, the strongest since October 2025.
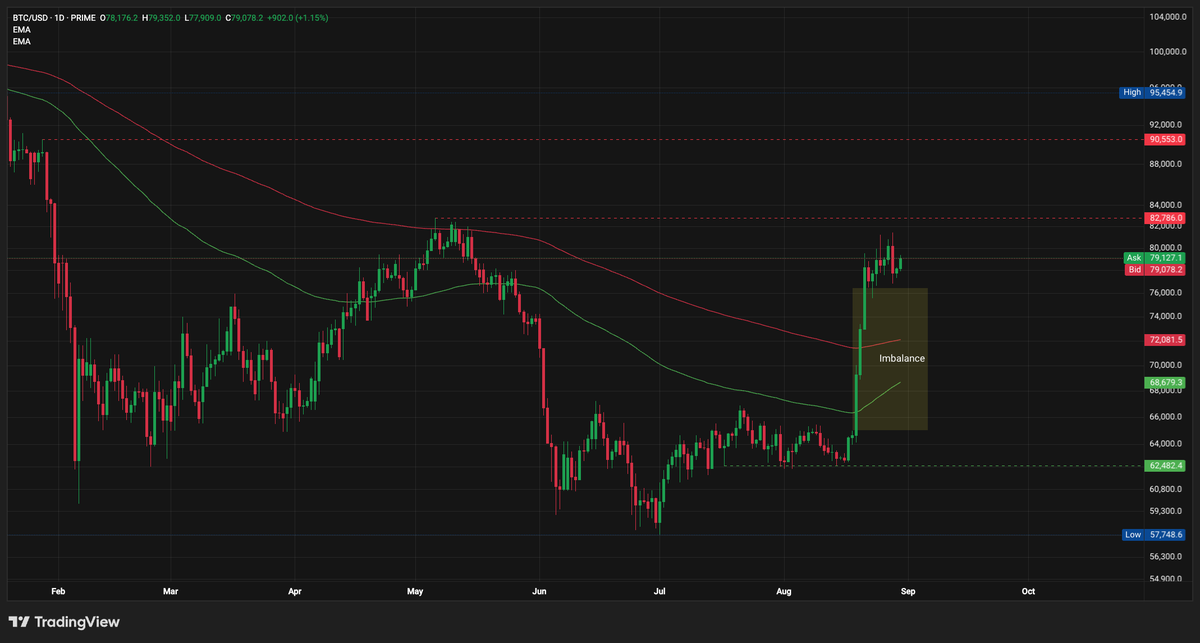
The breakout stalled on August 28 when Fed Chair Kevin Warsh used his first Jackson Hole keynote to warn that inflation, running at 3.7% on the PCE gauge, is still above the Fed’s 2% target. Bitcoin fell from the $81,455 high to as low as $76,877 within hours, and September rate hike odds jumped from roughly 34% to above 56%. Weekend short covering has since pushed price back to $79,078, holding above both moving averages, the faster one at $68,679.3 and the slower one at $72,081.5. A close back above the $82,786 supply zone would open the path toward $90,553 above it, while losing the $72,081 average would put the base of the imbalance back in play.
Crypto heatmap
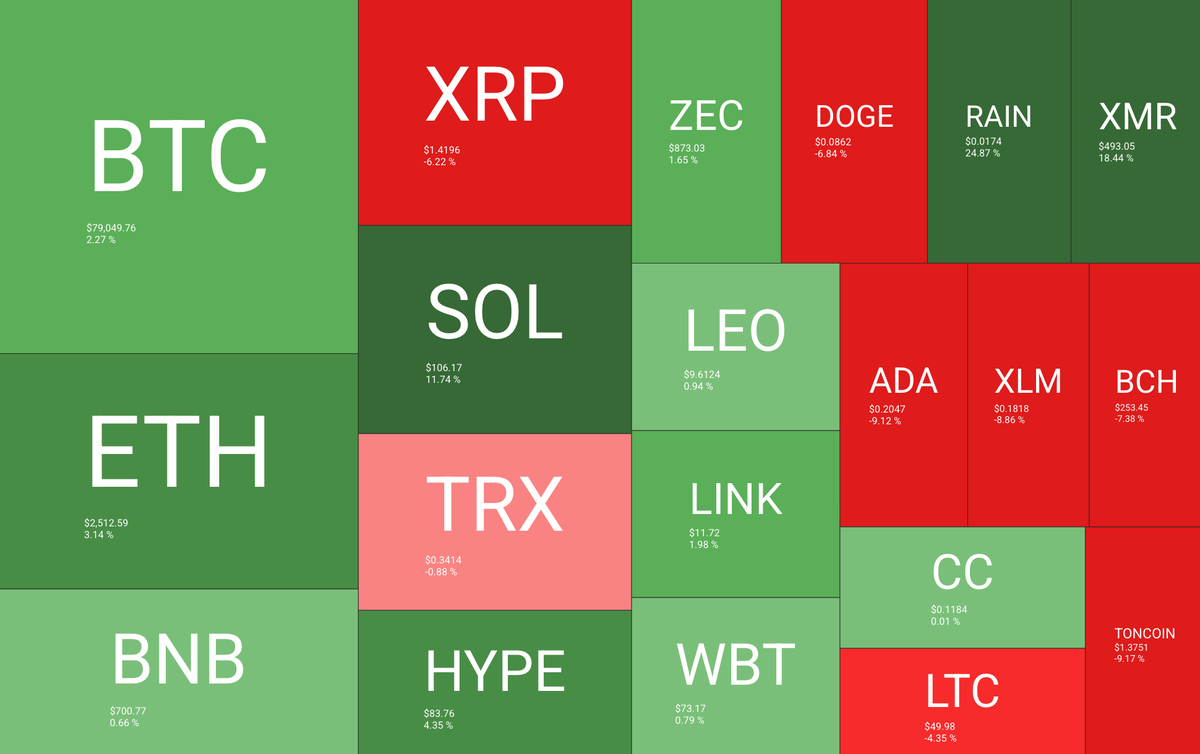
The heatmap turned mixed rather than uniformly green this week, with the majors holding up better than most altcoins. Bitcoin gained 2.27% to $79,049.76, Ethereum rose 3.14% to $2,512.59, and BNB added 0.66% to $700.77, all outperforming a broader complex still absorbing Friday’s hawkish shock.
Source: https://quantifycrypto.com/heatmaps
The two standout gainers had their own stories. Rain, a prediction market protocol on Arbitrum, jumped 24.87% to $0.0174 after a permanent burn of 7.42 billion tokens, about 1% of supply, plus a fresh Hyperliquid listing. Monero rose 18.44% to $493.05 as its Cuprate node client and Serai DEX releases extended a breakout toward the $450 to $500 zone. On the losing side, Cardano fell 9.12% to $0.2047 after Grayscale withdrew its spot ETF filing on August 7 and the Cardano Foundation’s chief technology officer announced his exit, while XRP dropped 6.22% to $1.4196, giving back part of an earlier rally that had run as high as 70% in a week. Toncoin, Stellar, Bitcoin Cash and Litecoin all fell 4% to 9%, in line with the leverage flush that followed Warsh’s remarks.
Altcoin Season Index
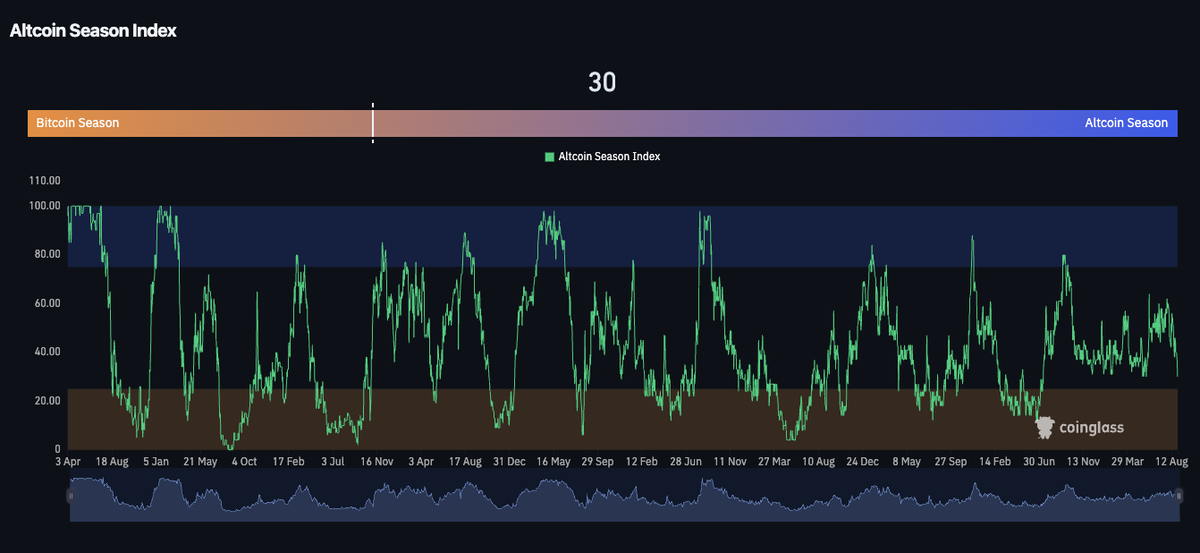
The Altcoin Season Index reads 30, down from 46 a week earlier and still on the Bitcoin Season side of the neutral band.
Source: https://www.coinglass.com/pro/i/alt-coin-season
That drop is consistent with the heatmap above, where Bitcoin and Ethereum outperformed most of the altcoin field this week. A reading this low argues for favoring market leaders over the broader altcoin basket until the index turns back toward neutral.
Fear and Greed Index
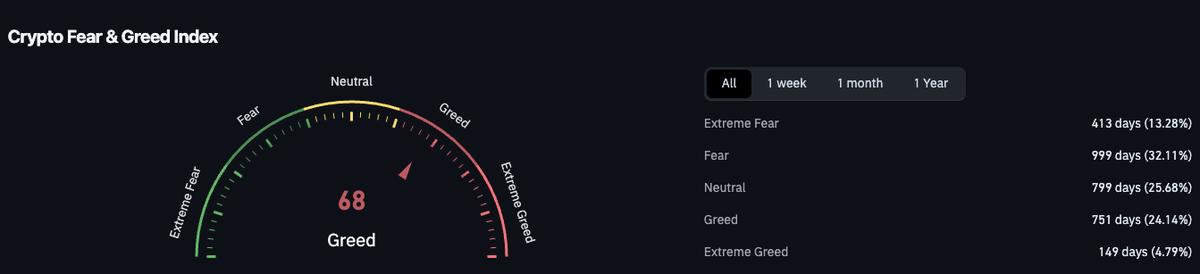
The Crypto Fear and Greed Index sits at 68, in Greed territory and little changed from last week. Across its full history the index has spent 24.14% of days in Greed and just 4.79% in Extreme Greed, so the current reading is elevated but not yet stretched to an extreme.
Source: https://www.coinglass.com/pro/i/FearGreedIndex
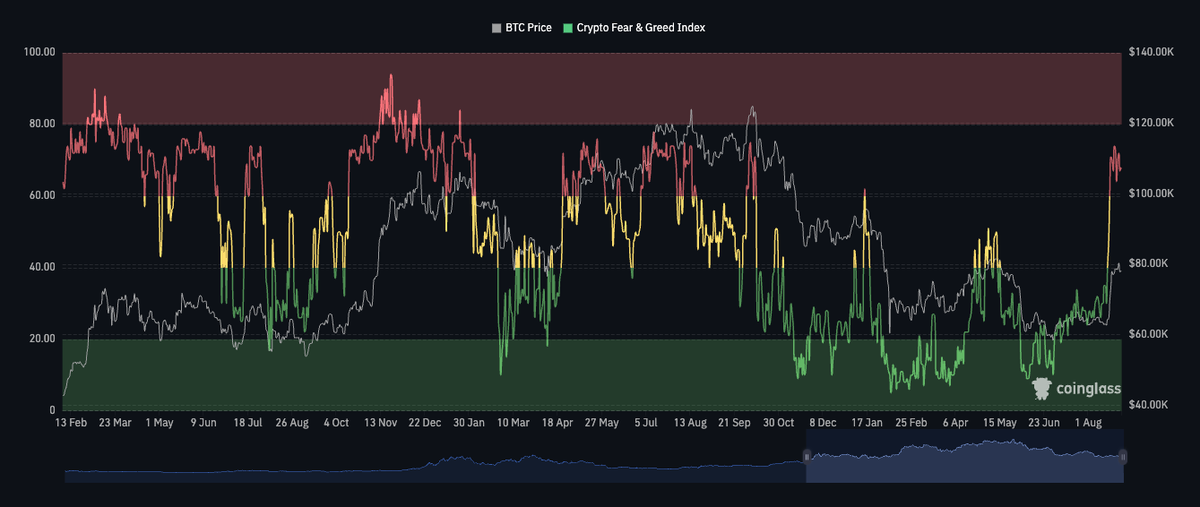
Plotted against price, sentiment has tracked the rebound from the Extreme Fear readings seen earlier this year, though it has not returned to the Extreme Greed zone that capped the index during prior local tops. The outlook here is unchanged from last week’s report.
Realized price of short term holders
Bitcoin’s short term holder Realized Price, the average cost basis of coins that moved in the last 155 days, has been reclaimed by spot price during this rally, a pattern that has historically lined up with bull phases. History offers one clear exception. The only instance where a bullish breakout above this metric near the start of a new cycle fully round tripped came in the summer of 2015, when price broke above the descending 50 week moving average in early July before being rejected at it, erasing the entire rally from $220 to $317.
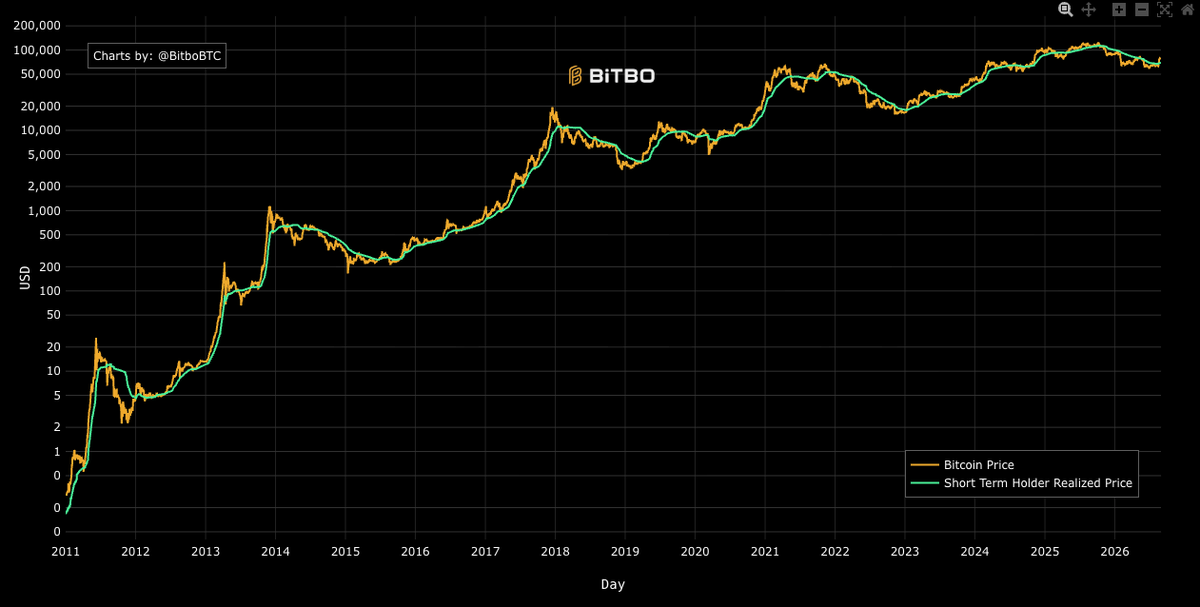
The zoomed view below shows that round trip in detail.
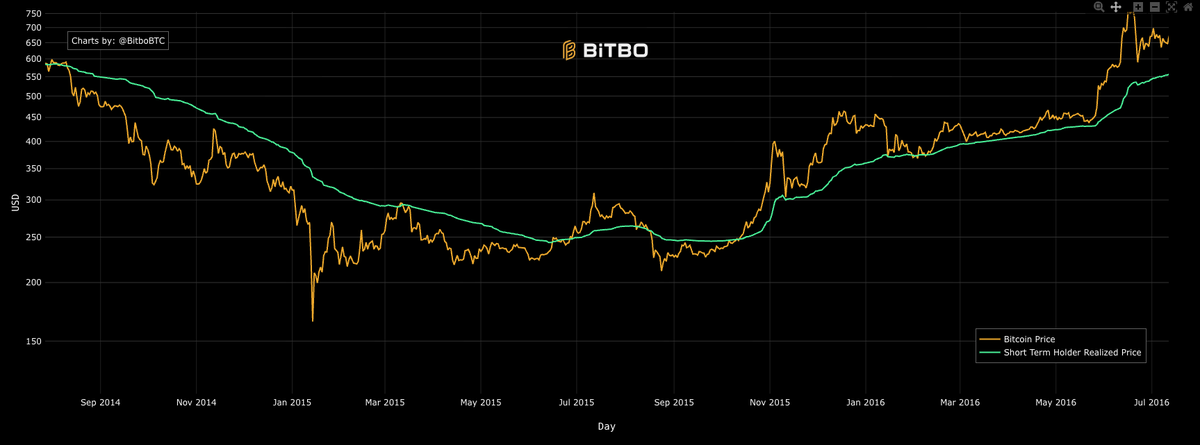
The August 19, 2015 Bitfinex flash crash accelerated the reversal, briefly pricing bitcoin as low as $179.35 on that exchange against a broader index low of $214.36, before the metric was reclaimed for good in October. This is not a claim that 2026 repeats 2015. The market was far smaller and thinner then, and this year’s breakout is backed by ETF flows and a Treasury driven liquidity story that did not exist a decade ago. Still, the 50 week moving average is the level worth watching if the current move is tested.
Solana accelerates higher
Solana has accelerated over the past two weeks, clearing $100 for the first time in 2026 and trading at $105.99, up 0.52% on the day. The move took price back above both moving averages on the daily chart, the faster one at $82.31 and the slower one at $90.00, and back above the $97.53 resistance that had capped two prior attempts this year, in March and May.
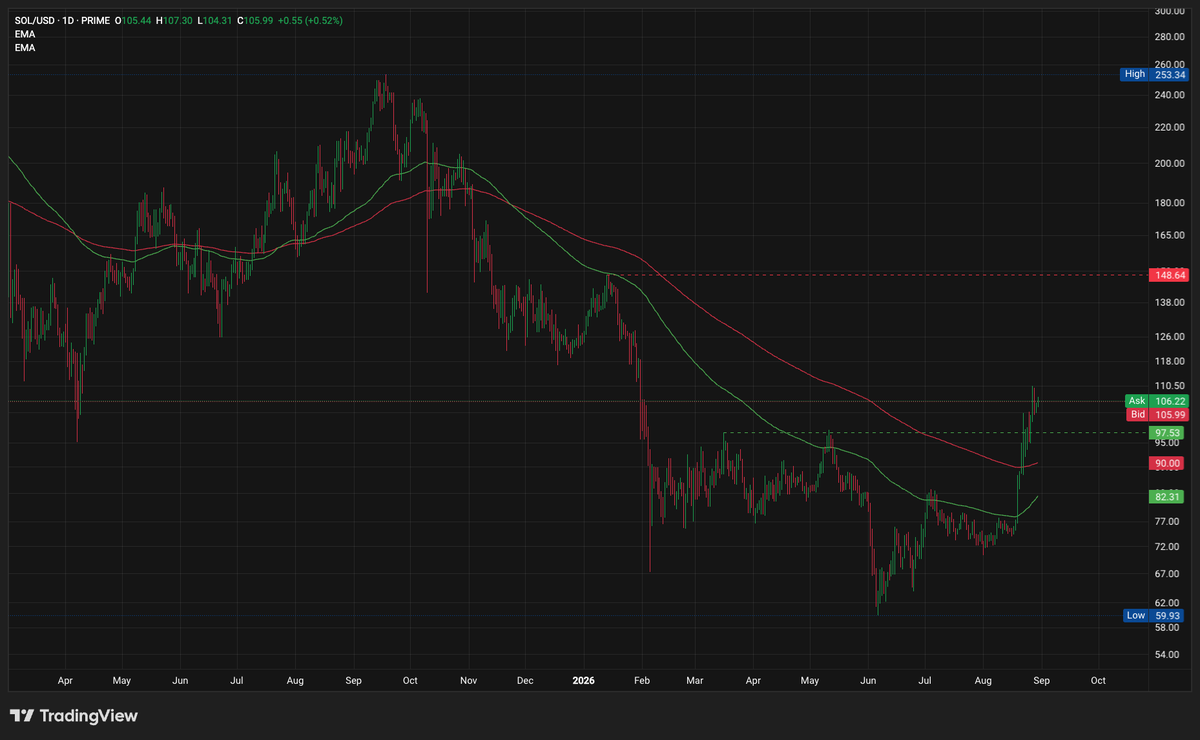
If SOL holds above the reclaimed $97.53 zone, the setup opens room toward the older $148.64 resistance that has capped every rally since last October. Losing $97.53 again would put the token back inside the range that has held since February.
Bitcoin liquidation map
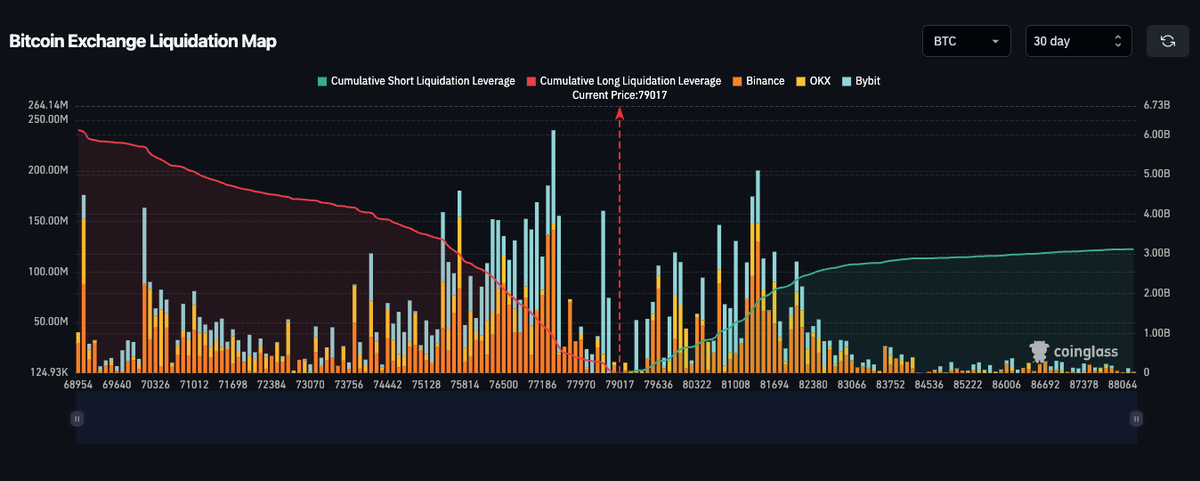
With price at $79,017, the liquidation map splits around the current level. Below price, cumulative long liquidation leverage reaches roughly $100 million by the $76,000 area and climbs to about $235 million by the low $69,000s, the bottom of the chart’s 30 day range. Above price, cumulative short liquidation leverage is thinner, reaching only about $117 million by the $88,000 top of the range.
Source: https://www.coinglass.com/pro/futures/LiquidationMap
That asymmetry means a drop back toward $76,000 would clear meaningfully more leveraged long exposure than a rally to the top of the range would clear on the short side, the kind of setup that can pull price toward the heavier side before a fresh move can extend.
Conclusion
The setup into the final months of the year is constructive but not clean. September has averaged a loss of roughly 2% to 4% over the past decade, the only reliably weak month on the calendar, while October and November have historically been among Bitcoin’s strongest. The November 3 midterm elections add a political variable, since a clear result would remove uncertainty around the pending Clarity Act, and the Trump administration has repeatedly pointed to market performance as a measure of success.
None of this rules out further chop. Friday’s hawkish surprise from Warsh showed how quickly a rally can give back gains when leverage is stretched, and the liquidation map above shows real risk on both sides of price. If the imbalance in the technical picture holds and the short term holder Realized Price stays reclaimed, the broader structure favors buyers into year end. If not, the 2015 analog above is a reminder that breakouts near this metric are not automatic.
Trading involves risk.
Author



 Risk Disclaimer
The content provided here is for informational purposes only. It is not intended as personal investment advice and does not constitute a solicitation or invitation to engage in any financial transactions, investments, or related activities. Past performance is not a reliable indicator of future results.
The financial products offered by the Company are complex and come with a high risk of losing money rapidly due to leverage. These products may not be suitable for all investors. Before engaging, you should consider whether you understand how these leveraged products work and whether you can afford the high risk of losing your money.
The Company does not accept clients from the Restricted Jurisdictions as indicated in our website/ T&C. Some services or products may not be available in your jurisdiction.
The applicable legal entity and its respective products and services depend on the client’s country of residence and the entity with which the client has established a contractual relationship during registration.