7 min read
 Technical picture
Bitcoin trades near $65,200, up about 2.6% over the past week. The price climbed back above a support zone it had tested earlier in the month and pushed toward the top of its recent trading range. Even so, the bigger weekly trend still looks cautious: price remains well below its longer-term moving average, a sign the broader bias has not flipped bullish yet.
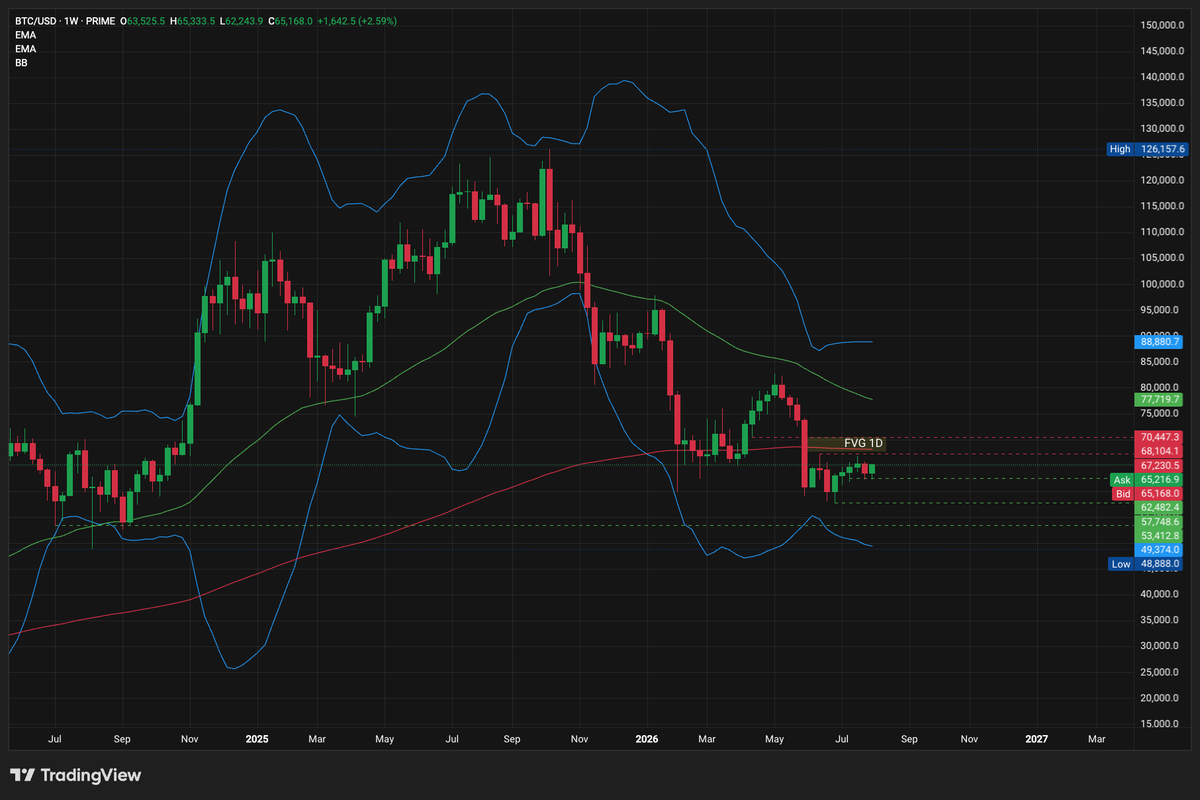
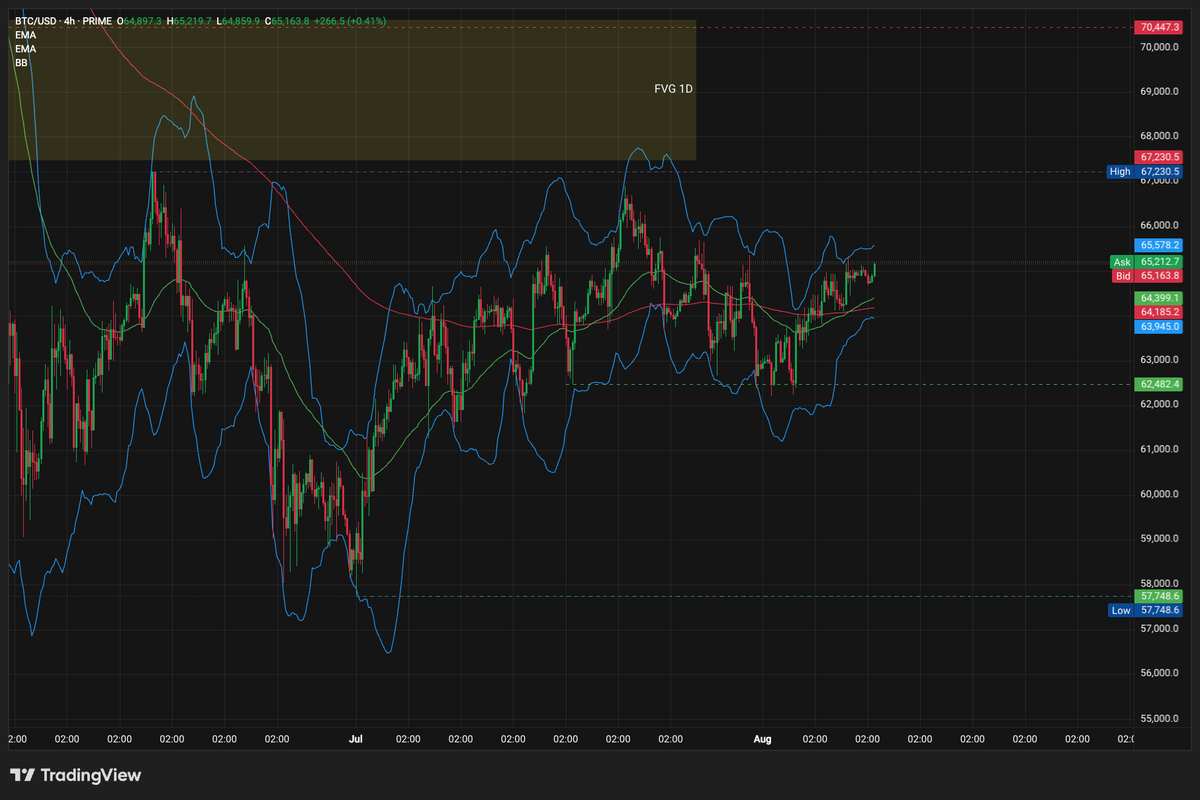
The shorter-term chart tells a calmer story. Bitcoin has spent the past several weeks squeezed inside a tight band between roughly $64,000 and $65,600, with volatility compressed to some of its lowest levels this year. A gap in past trading between $68,100 and $70,450 remains unfilled above; a move into that zone would be the next real test for buyers, as the cost basis section below explains further.
Crypto heatmap
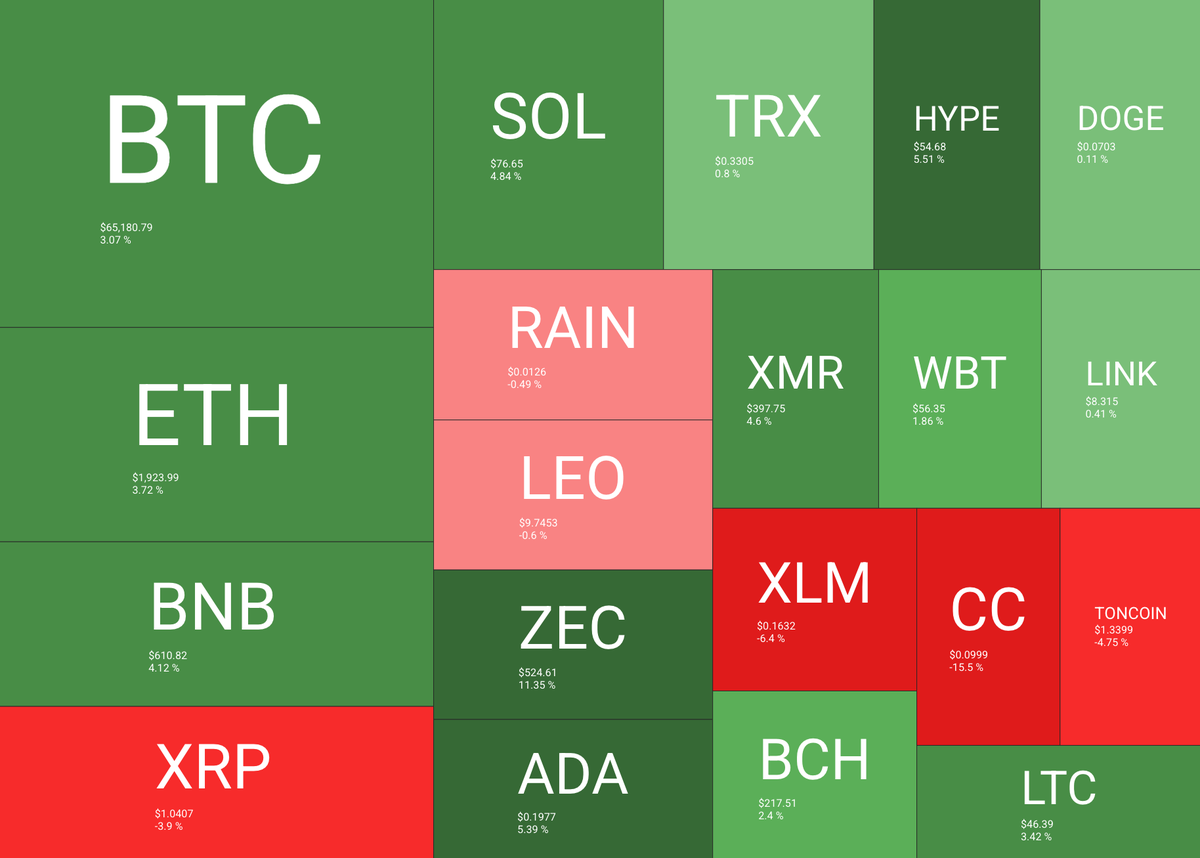
Most major coins traded green over the past day, with Bitcoin, Ethereum, and BNB all up more than 3%. Zcash was the standout gainer, up over 11%, while a small group of tokens including XRP and Stellar lagged behind, down between 4% and 6%. The broad green tone lines up with the steady ETF buying discussed later in this report.
Source: https://quantifycrypto.com/heatmaps
Altcoin Season Index
The Altcoin Season Index reads 44, still on the Bitcoin side of the scale that runs from 0 to 100. A reading below 50 means most of the top 50 coins have underperformed Bitcoin over the past three months, even in weeks when individual altcoins post double-digit gains, as several did on the heatmap above. The index has swung between the 20s and the 90s over the past two years, so a mid-40s reading sits closer to neutral than either extreme.
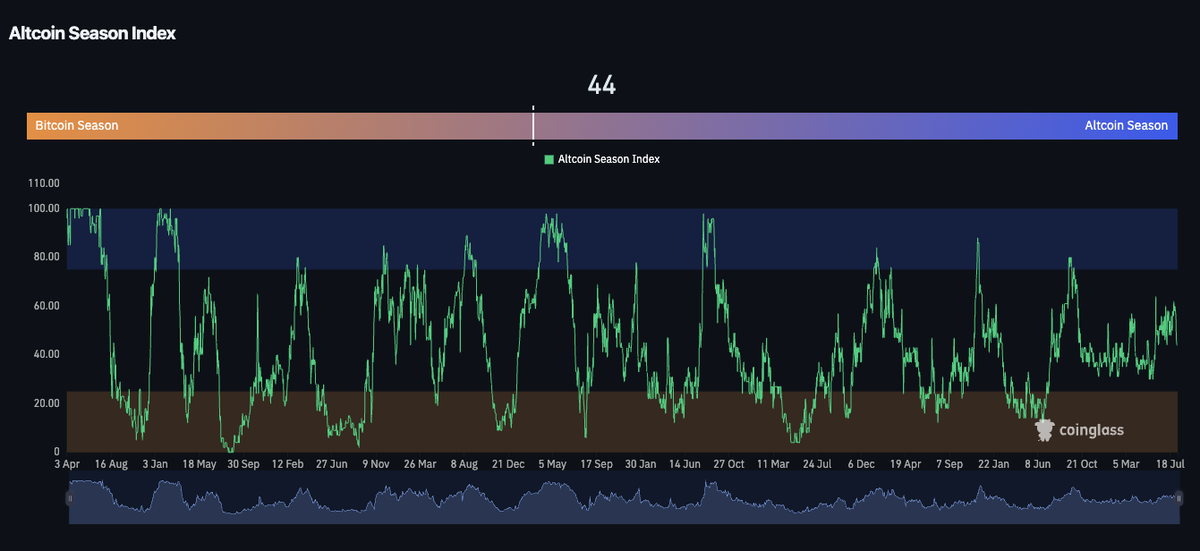
Source: https://www.coinglass.com/pro/i/alt-coin-season
Fear and Greed Index
The Crypto Fear and Greed Index sits at 32, still labeled Fear but an improvement from the deeper fear readings seen through most of July. Over its full history the index has spent close to half its days somewhere in Fear or Extreme Fear, so a reading in the low 30s sits within its normal range rather than standing out as unusual.
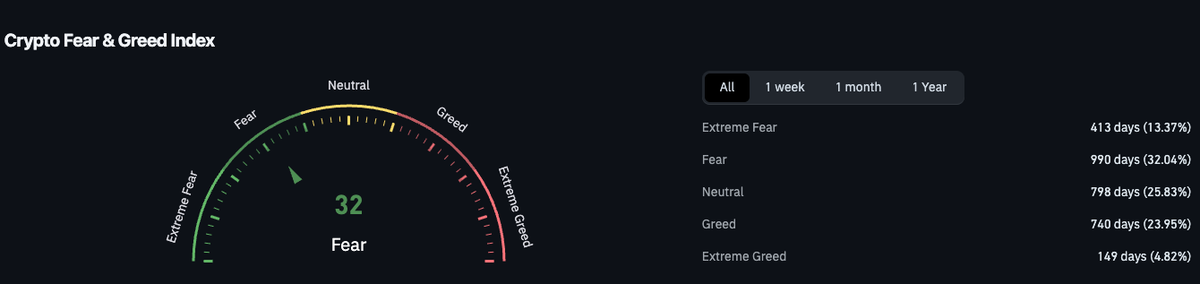
Source: https://www.coinglass.com/pro/i/FearGreedIndex
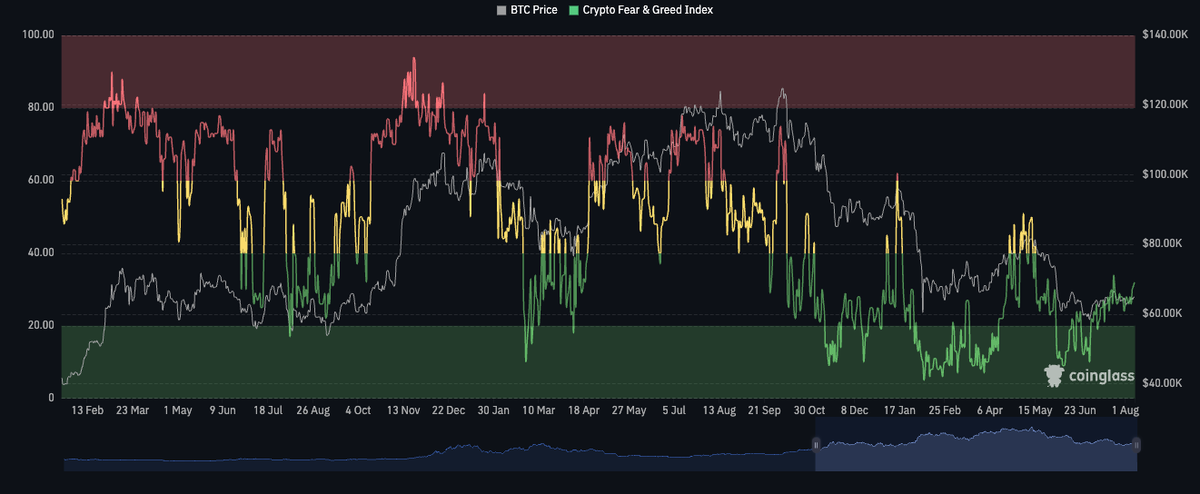
The longer chart shows sentiment lagging price for most of the past year. Bitcoin has recovered some ground since its 2026 low, but the index has stayed mostly in Fear or Neutral territory rather than confirming genuine optimism. That gap between price and sentiment is worth watching as the market waits for a clearer catalyst, whether that is the jobs data below or a resolution of the technical squeeze described above.
July payrolls miss expectations
The US jobs report for July, released last Friday, surprised to the downside. Nonfarm payrolls fell by 23,000, the first negative headline print of the current cycle, though the weakness was concentrated in a 53,000 drop in government jobs, while private payrolls still added 30,000. The unemployment rate ticked down to 4.1%, but for the wrong reason: a shrinking workforce rather than stronger hiring. Annual wage growth also slowed to 3.2%, the softest pace since May 2021.
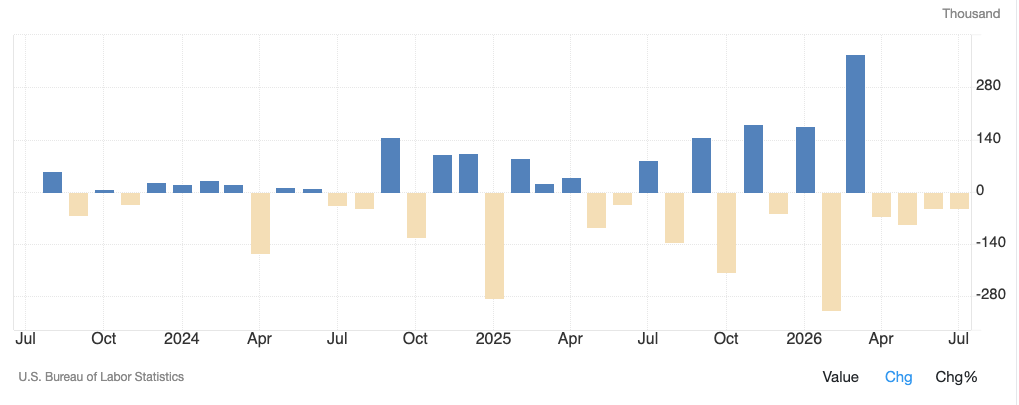
Source: https://tradingeconomics.com/united-states/non-farm-payrolls
Markets read the report as the clearest case yet for a September rate cut, pushing the odds of one above 70%. A softer dollar and lower rate expectations are typically supportive for Bitcoin, consistent with the steady ETF demand covered later in this report.
Cost basis resistance near $67K and $72K
On-chain data shows what recent buyers paid for their coins, grouped by how long they have held. Investors who bought Bitcoin one to three months ago paid an average of about $67,000, while those who bought three to six months ago paid closer to $72,000. With spot price near $65,000, both groups are sitting on paper losses.
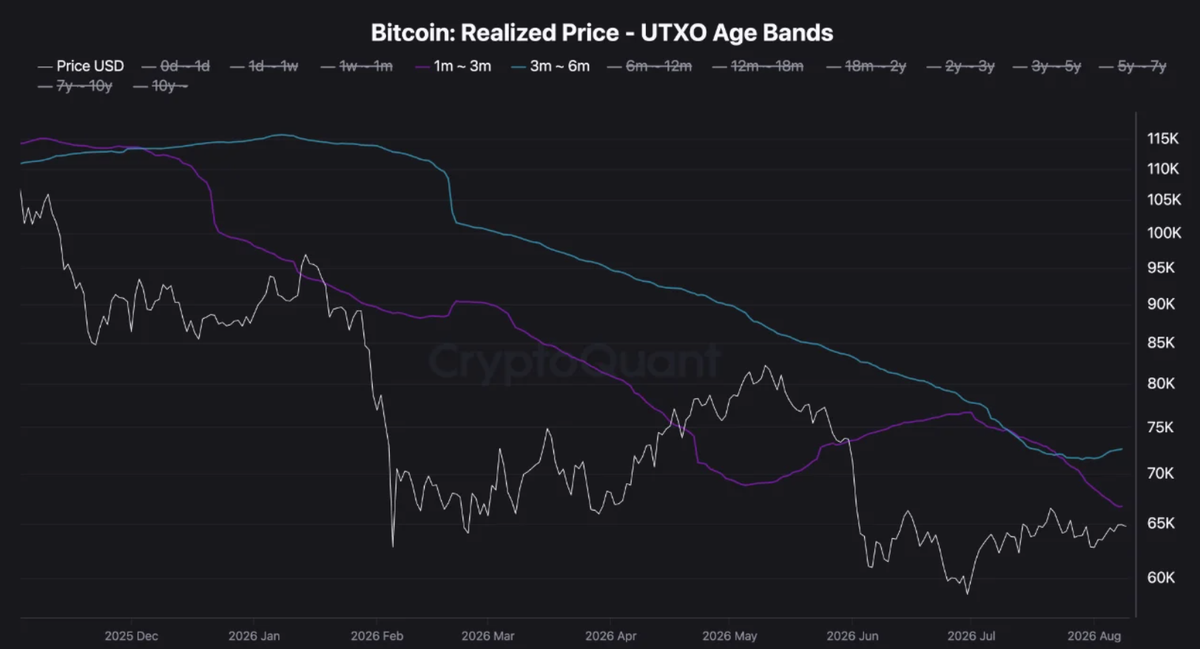
That matters because investors often sell once they get back to even, so those price levels could act as a lid on the rally described in the technical section above if Bitcoin trades back up toward them.
IBIT leads a five day ETF inflow streak
Bitcoin ETFs pulled in $853.5 million over five straight trading days between August 3 and August 7, reversing a small outflow the week before. BlackRock’s IBIT did most of the buying, accounting for about $693 million of that total, or roughly 81 cents of every dollar. Total inflows into US spot Bitcoin ETFs since launch have now passed $52 billion.
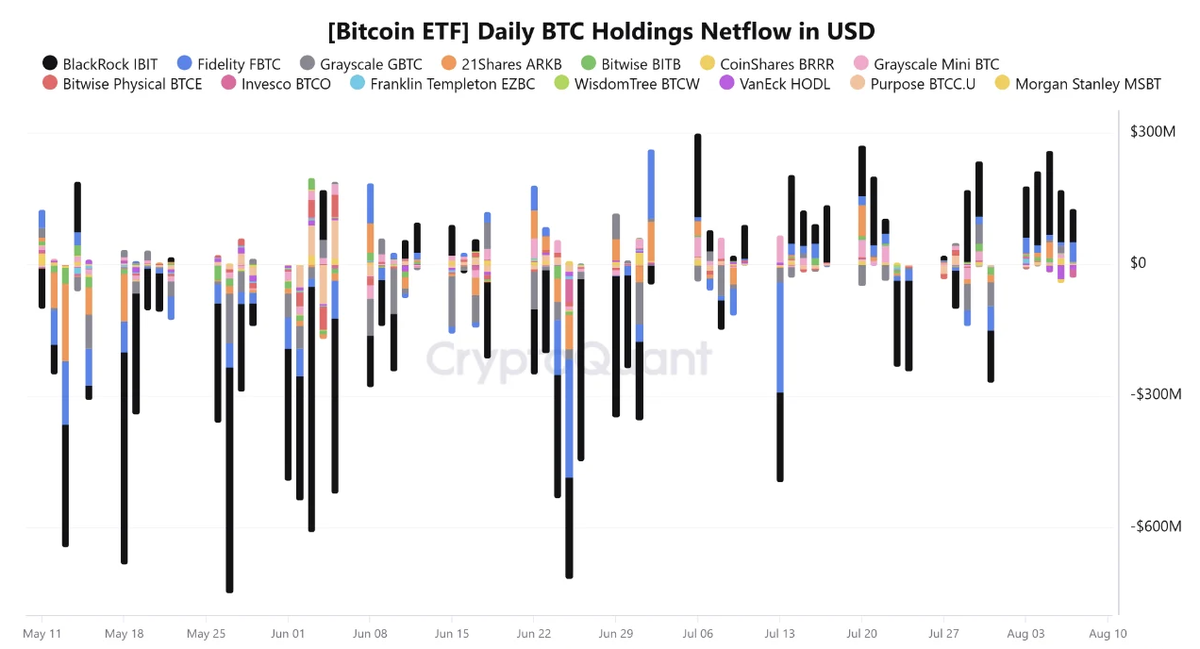
Steady ETF demand like this lines up with the broadly green heatmap above and helps explain why price has held up despite the cautious weekly trend.
Bitcoin liquidation map
The liquidation map shows where leveraged trader positions are clustered around the current price of $65,156. Below price, a meaningful pool of long positions sits between roughly $61,000 and $63,000 and would be forced to sell if price fell that far. Above price, an even larger pool of short positions sits between about $65,700 and $66,700, with another cluster higher up near $71,000 to $72,000.
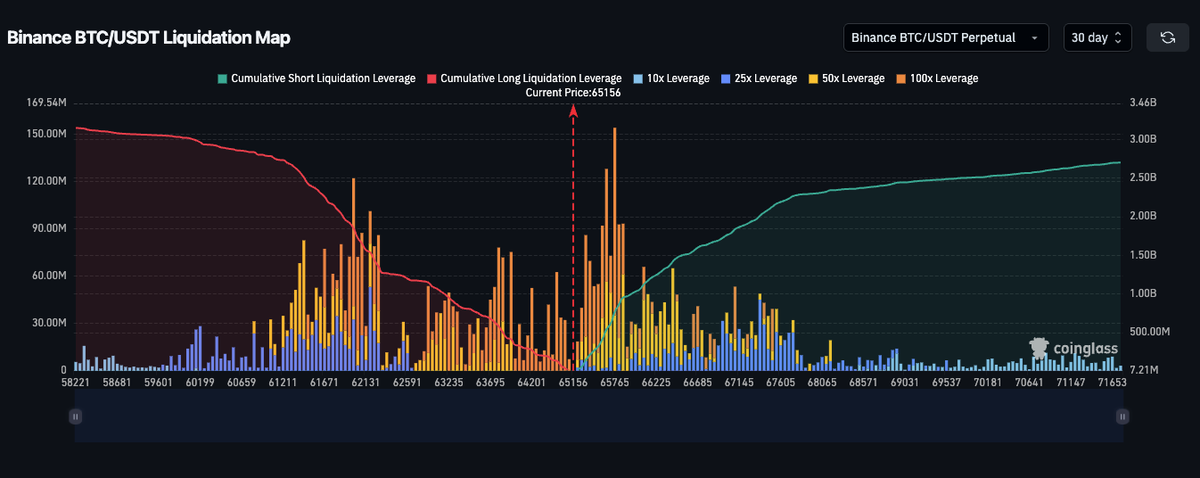
Markets often gravitate toward these pools of forced selling or buying; a move that clears one side and then reverses toward the other would not be unusual, and would fit the tight, low-volatility range described in the technical section above.
Conclusion
Putting the pieces together, Bitcoin remains without a clear direction. The weekly trend still looks cautious below its longer-term average, even as the shorter-term chart compresses into one of its tightest ranges of the year, the kind of setup that has historically preceded a larger move either way.
A weak jobs report has strengthened the case for a September rate cut, and steady ETF inflows point to real demand, but a wall of underwater buyers near $67,000 to $72,000 and a market still reading Fear rather than Greed suggest sentiment has not fully turned. Leveraged traders in particular should stay cautious. Liquidation clusters sit on both sides of the current price, and a squeeze this tight often resolves with a volatility spike; waiting for that move to clear and for a level to hold before adding leveraged risk looks like the more disciplined approach.
Trading involves risk.
Author



 Risk Disclaimer
The content provided here is for informational purposes only. It is not intended as personal investment advice and does not constitute a solicitation or invitation to engage in any financial transactions, investments, or related activities. Past performance is not a reliable indicator of future results.
The financial products offered by the Company are complex and come with a high risk of losing money rapidly due to leverage. These products may not be suitable for all investors. Before engaging, you should consider whether you understand how these leveraged products work and whether you can afford the high risk of losing your money.
The Company does not accept clients from the Restricted Jurisdictions as indicated in our website/ T&C. Some services or products may not be available in your jurisdiction.
The applicable legal entity and its respective products and services depend on the client’s country of residence and the entity with which the client has established a contractual relationship during registration.