
 7 min read
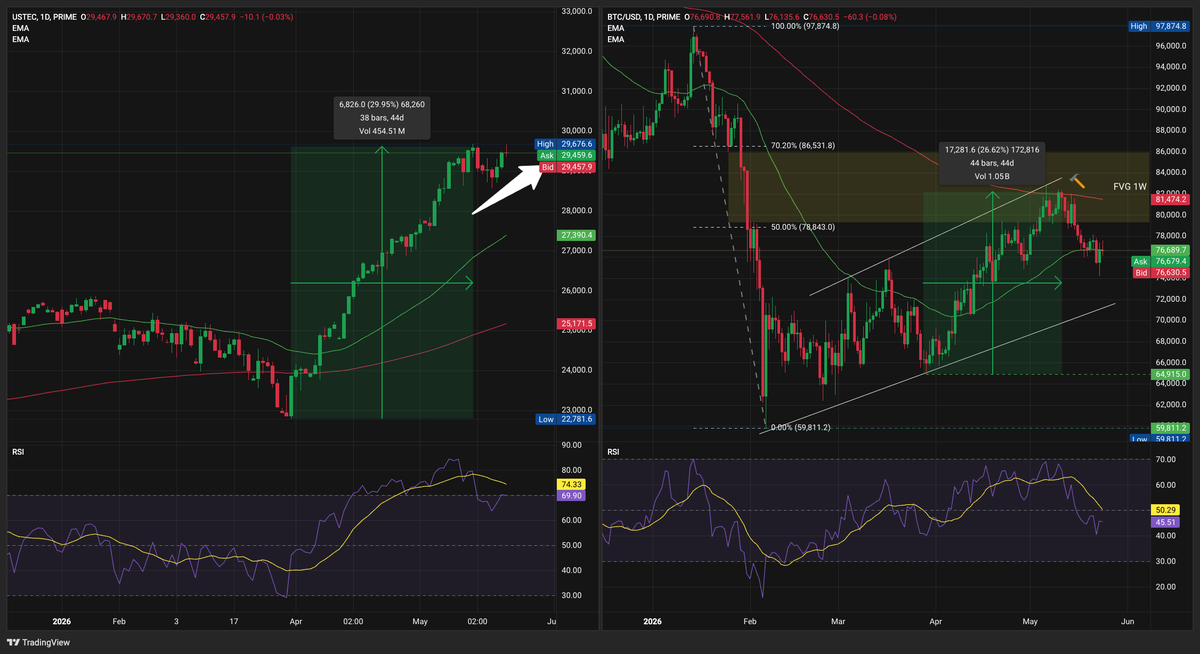
 Bitcoin trades near $76,600 after slipping below the 20-day EMA (green line), a technical sign of weakness. Price is moving inside a bearish channel and was rejected from the 200-day EMA (red line) near $81,600, which reinforces the bearish setup. BTC will likely test the lower channel boundary next, but a full bearish continuation needs a clean break of that boundary at the 71,000 level.
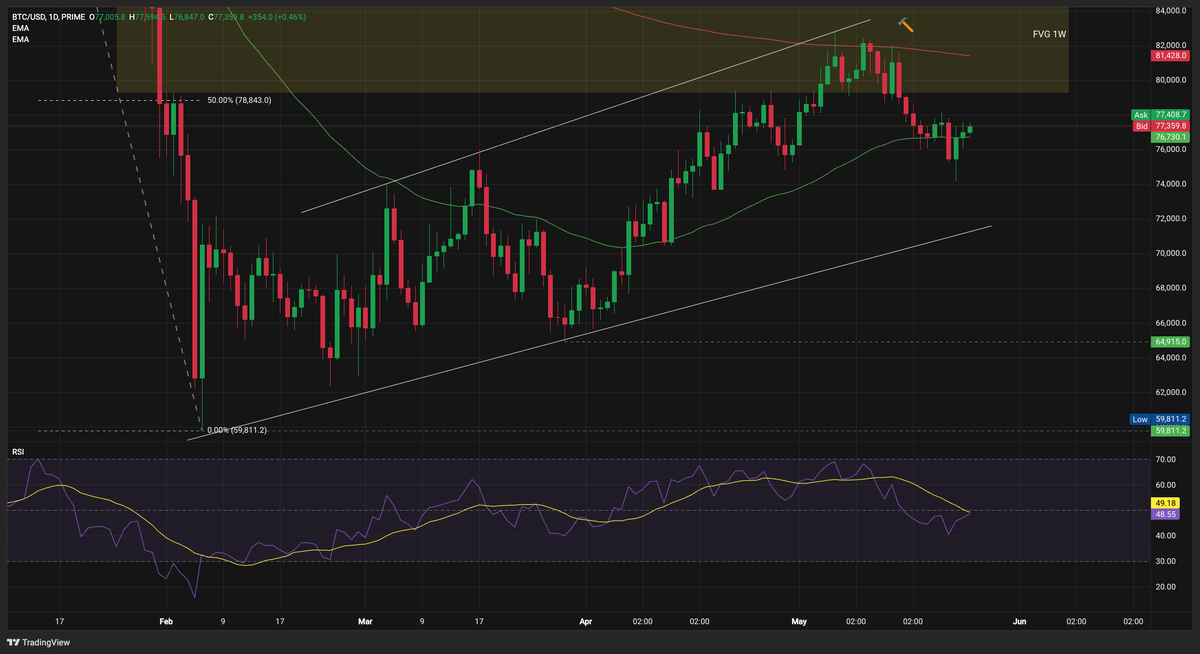
Below the channel, the next reference is the green support at $64,915, with the recent swing low at $59,811 as the deeper level if selling accelerates. Bulls need to reclaim the 20-day EMA to neutralize this structure.
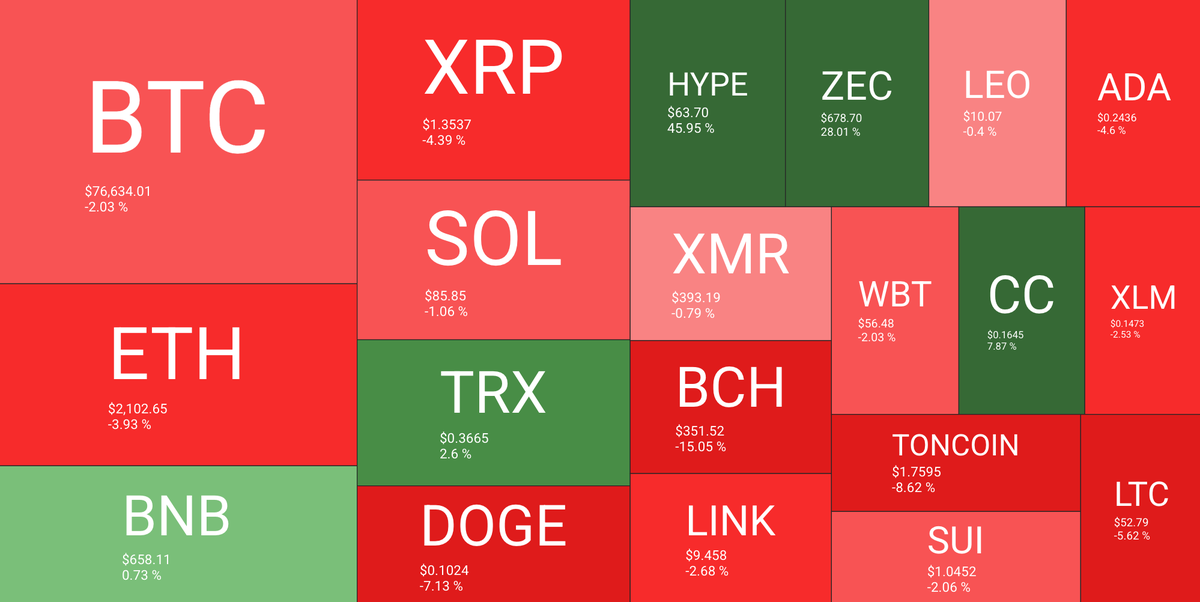
The weekly heatmap is mostly red. Bitcoin is down 2.03% to $76,634 and Ethereum down 3.93% to $2,102. The sharpest drop came from Bitcoin Cash, off 15.05%, after it lost a key support level and printed a surge in futures volume with a deeply oversold RSI as the market-wide risk-off accelerated.
Source: https://quantifycrypto.com/heatmaps
On the upside, Hyperliquid (HYPE) led with a 45.95% gain to $63.70 and set a fresh all-time high above $62 on May 21, helped by the launch of two US-listed HYPE ETFs (21Shares THYP on Nasdaq, Bitwise BHYP on NYSE) that drew about $54M in their first week of trading. Zcash (ZEC) also stood out, up 28.01% to $678.70 on a run to a new 2026 high, supported by the SEC closing its Zcash Foundation probe and disclosed accumulation from Multicoin Capital.
Altcoin demand remains low
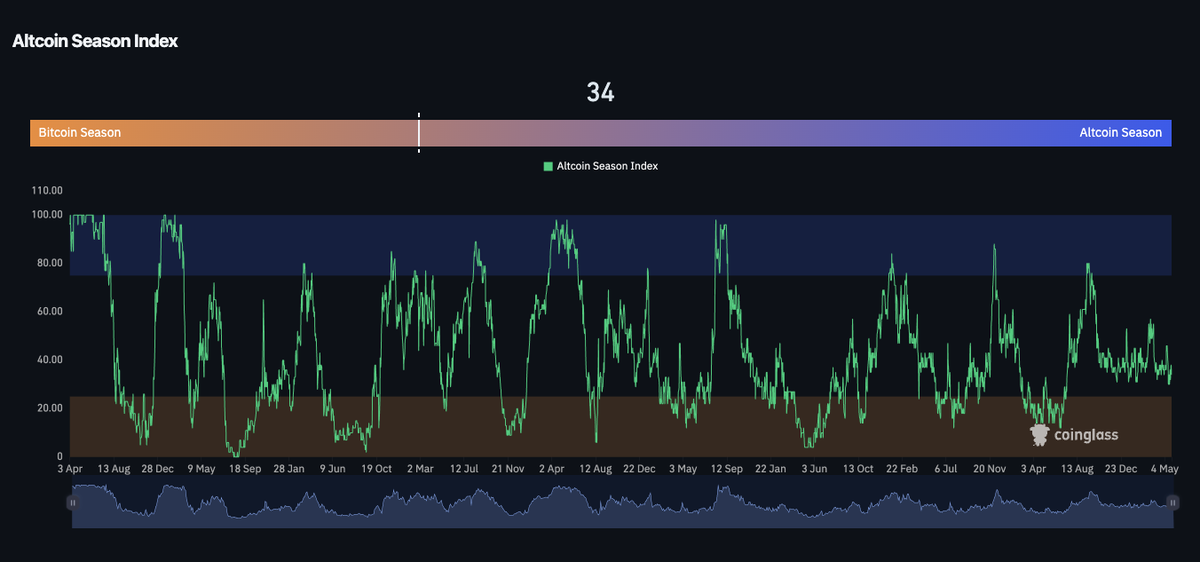
The Altcoin Season Index sits at 34, unchanged from last week and firmly in Bitcoin Season territory. Capital is concentrating in Bitcoin and a few single-name stories like HYPE and ZEC rather than rotating broadly into alts. Until the index pushes back above the 50 to 75 zone, breadth stays weak and most altcoins remain tied to Bitcoin’s direction.
Source: https://www.coinglass.com/pro/i/alt-coin-season
The sentiment is good for bulls
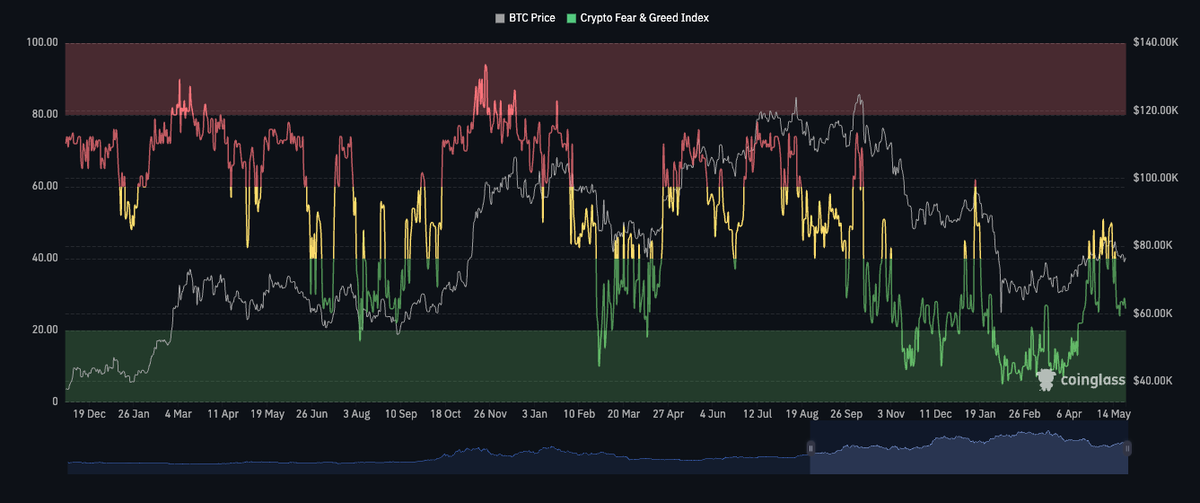
The Crypto Fear & Greed Index reads 26, in the Fear zone and unchanged from last week. The reading reflects the price drop below $77K, heavy liquidations, and rising bond yields rather than any single shock, so the gauge simply stayed pinned in fear as conditions held.
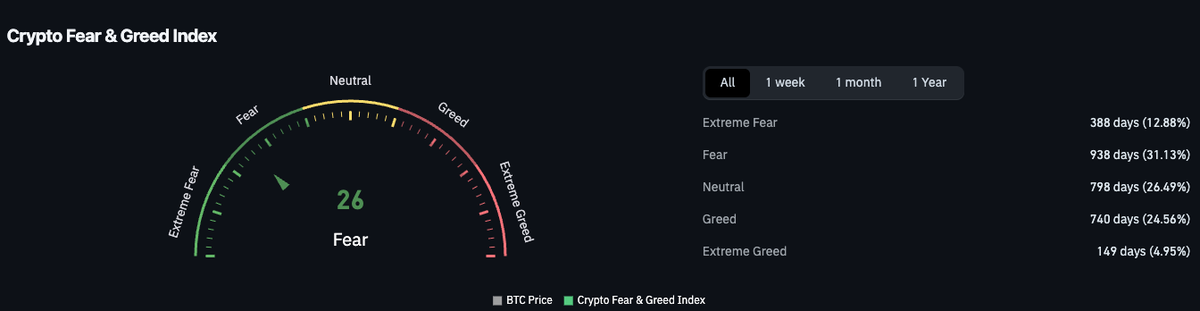
From a contrarian angle, sustained fear has historically marked zones where downside is partly priced in. Fear alone is not a bottom signal, but combined with record-pace ETF outflows it points to stressed positioning rather than complacency.
Source: https://www.coinglass.com/pro/i/FearGreedIndex
Macro backdrop: FOMC minutes and the rate path
The key macro event of the week was the FOMC minutes released May 20, covering the April 28 to 29 meeting. The Committee held the federal funds target range at 3.50% to 3.75% and flagged that inflation remains elevated, partly on rising global energy prices tied to the Middle East. A majority of officials signaled that rate increases could become necessary if the Iran war keeps pushing inflation higher, and the meeting carried four dissents, the most since 1992.
Source: https://www.cmegroup.com/markets/interest-rates/cme-fedwatch-tool.html
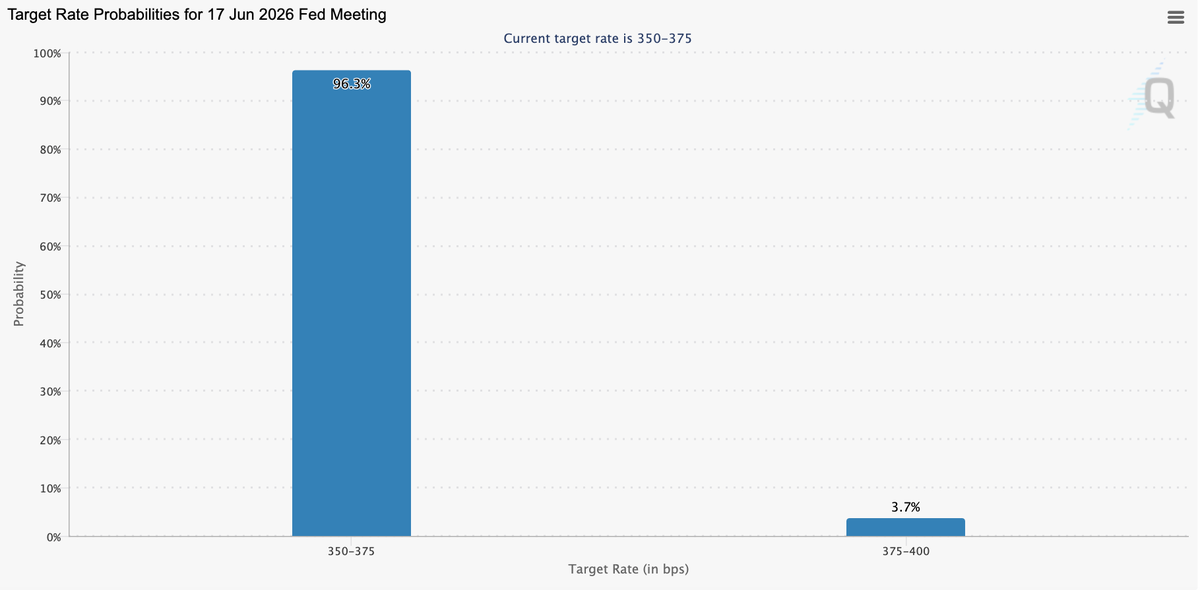
On the path ahead, the CME FedWatch tool prices a 96.3% chance the Fed holds at 3.50% to 3.75% at the June 17 meeting, with just 3.7% odds of a hike to 3.75% to 4.00%. With no cut priced in and a hawkish tilt in the minutes, monetary policy stays a headwind for risk assets, which is why this release matters for crypto.
NASDAQ, the USD, and crypto’s beta
Bitcoin continues to track the Nasdaq closely, and the chart shows BTC climbing alongside the index through the rally. The difference is amplitude: as the Nasdaq slowed, Bitcoin gave back about 30% of its advance while the index saw only a shallow correction. That sensitivity cuts both ways, so the first serious Nasdaq drawdown could translate into a 30% or larger move in crypto, a clear risk for bulls.
This week equities started soft, with the S&P 500 and Nasdaq slipping on inflation fears as the 10-year Treasury yield hit a one-year high. The Dollar Index firmed to about 99.3, near one-month highs, and Brent crude topped $110 before easing after Washington signaled it would hold off on a strike on Iran. A stronger dollar and higher yields are the macro pressure behind crypto’s soft tone.
Capitals flows into exchanges during BTC rally
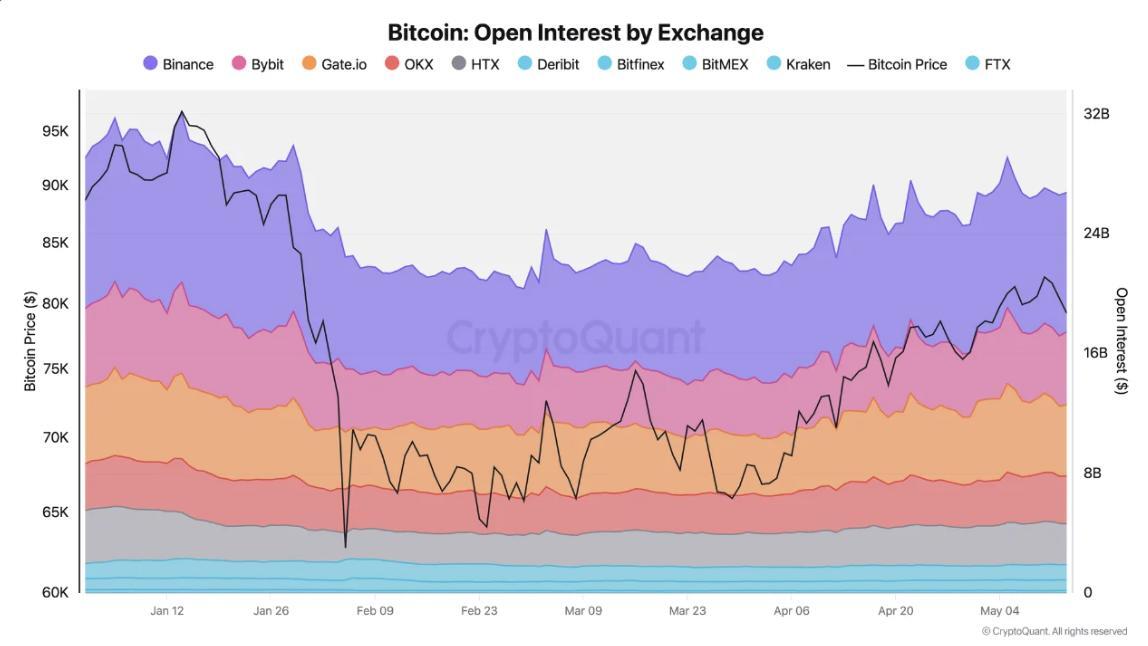
Capital flowed aggressively into crypto exchanges during Bitcoin’s rally toward $80K, driving the fastest growth in Bitcoin perpetual futures open interest so far in 2026. The Bitcoin open interest climbed to the highest level since January as traders increased long positioning amid bullish market expectations.
Binance captured most of the new capital entering Bitcoin derivatives markets, significantly outpacing other exchanges in open interest growth.
Exchange liquidity improved during the rally, with stablecoin reserves increasing across centralized exchanges. Binance continued to dominate exchange-held USDT liquidity.
Altcoin activity also accelerated, with Binance attracting the highest number of altcoin deposit transactions among major exchanges, signaling renewed speculative activity across crypto markets.
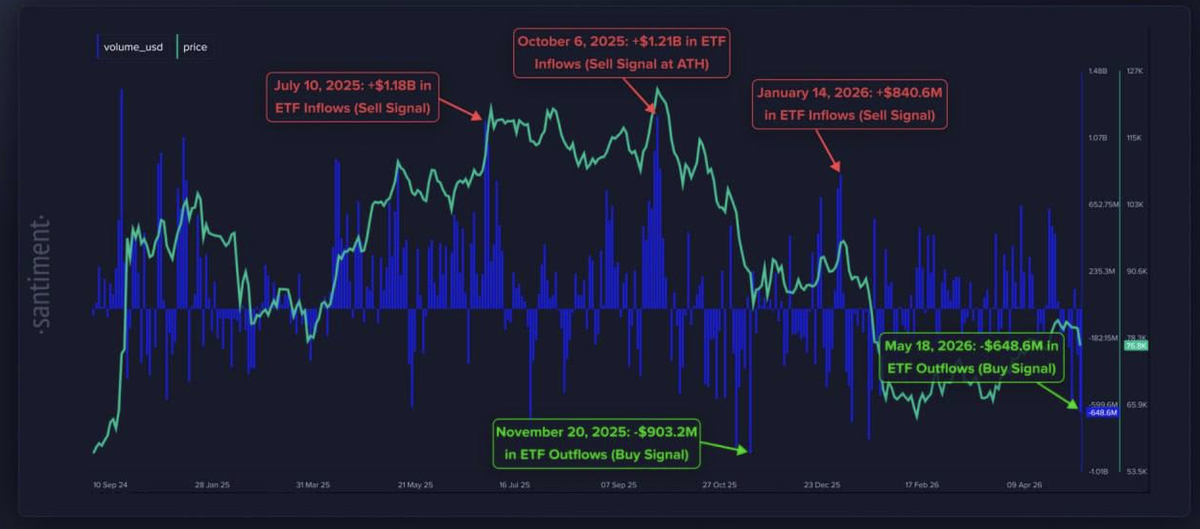
On the contrary, BTC ETFs see the highest outflows since January
Spot Bitcoin ETFs are bleeding capital at the fastest pace since January. The chart marks a $648.6M outflow on May 18, the largest single-day redemption in months. Santiment frames this as a bullish signal: the scale of the move looks like genuine investor capitulation, the kind of forced selling that tends to cluster near local bottoms rather than tops.
Conclusion
The bear case holds the short term. Bitcoin is below its 20-day EMA inside a bearish channel, sentiment sits in fear, the macro backdrop is hawkish with the Fed signaling possible hikes, and Bitcoin’s high beta to a softening Nasdaq leaves it exposed. A clean break of the $71,000 channel boundary would open the path toward $64,915 and potentially the $59,811 low.
The bull case rests on the contrarian signals: fear at 26, record-pace ETF outflows that Santiment reads as capitulation, and rising open interest showing traders are still engaged. For the regime to flip, BTC needs to reclaim the 20-day EMA and then the 200-day EMA near $81,600, ideally alongside a cooler inflation print or a de-escalation in the Iran conflict that lifts risk appetite.
Until then, the balance of evidence leans bearish.
Trading involves risk.
Author



 Risk Disclaimer
The content provided here is for informational purposes only. It is not intended as personal investment advice and does not constitute a solicitation or invitation to engage in any financial transactions, investments, or related activities. Past performance is not a reliable indicator of future results.
The financial products offered by the Company are complex and come with a high risk of losing money rapidly due to leverage. These products may not be suitable for all investors. Before engaging, you should consider whether you understand how these leveraged products work and whether you can afford the high risk of losing your money.
The Company does not accept clients from the Restricted Jurisdictions as indicated in our website/ T&C. Some services or products may not be available in your jurisdiction.
The applicable legal entity and its respective products and services depend on the client’s country of residence and the entity with which the client has established a contractual relationship during registration.








