7 min read
 Key takeaways
- Gold is holding its major support zone and carving a potential higher low even as the Middle East conflict re-escalates, a reminder that a geopolitical shock does not automatically translate into a safe-haven bid for the metal.
- The bid is flowing to the dollar and Treasury yields instead. The escalation has pushed oil higher, revived inflation fears, and hardened the Fed’s higher-for-longer stance, lifting real yields and capping gold.
- A divided Fed and firm data keep at least one 2026 hike in play, the main headwind, while steady central-bank buying and a soft June jobs print sit underneath as support.
- Technically, buyers are defending the 4,000 reload zone. A reclaim of the daily 20 EMA near 4,200 would potentially confirm a local break of structure and open the 4,300-4,400 resistance zone, while a loss of the 4,000 area would weaken the recovery case.
A geopolitical shock that is lifting the dollar, not gold
Gold is defending a major support zone even as the Middle East conflict roars back to life, and the reason it is holding rather than surging tells you a lot about where the market is putting its money. The classic safe-haven playbook would have gold rallying into a fresh flare-up. Instead, the haven bid is going to the US dollar and Treasuries, leaving the metal to grind against a stiff headwind.
The escalation itself has been rapid. Iran struck three commercial vessels in the Strait of Hormuz, the US responded with strikes on Iran, and Iran has vowed retaliation against US bases in the region. Speaking at the NATO summit in Ankara, President Trump declared the interim peace agreement “over” and warned of further action, while Washington revoked the licence that had allowed Iran to sell its oil on the global market. The market’s read was immediate: oil surged more than 5%.
That oil move is the key to gold’s muted response. Higher energy prices revive inflation fears, and those fears harden the Federal Reserve’s higher-for-longer stance under chair Kevin Warsh. With the 10-year Treasury yield pushing toward 4.6% and the dollar firmer above 101 on the DXY, the opportunity cost of holding a non-yielding asset like gold rises, which caps the upside even as geopolitical risk climbs.
The Fed’s own signals are pulling the same way. Minutes from the June meeting revealed a divided committee over whether a further hike is needed this year, with inflation forecasts revised higher, and markets now price at least one more rate rise by year-end with the policy rate already at 3.50-3.75%. A soft June jobs report, just 57,000 payrolls with downward revisions to the prior two months, briefly eased that pressure, but the relief has faded as the inflation story has reasserted itself.
Underneath it all, the structural bid has not blinked. Central banks are still accumulating, with the People’s Bank of China extending its buying streak to a 20th straight month and logging its biggest monthly addition in more than two and a half years. That steady official-sector demand is a large part of why gold is holding its floor rather than breaking it, even with the dollar and yields working against it.
The near-term path now hinges on two data points that will decide whether the higher-for-longer narrative tightens or loosens: June CPI on 14 July and the FOMC decision on 28-29 July. Until then, gold sits in a hold-or-break test at major support, with the technicals doing the talking.
The daily chart: a bullish divergence playing out
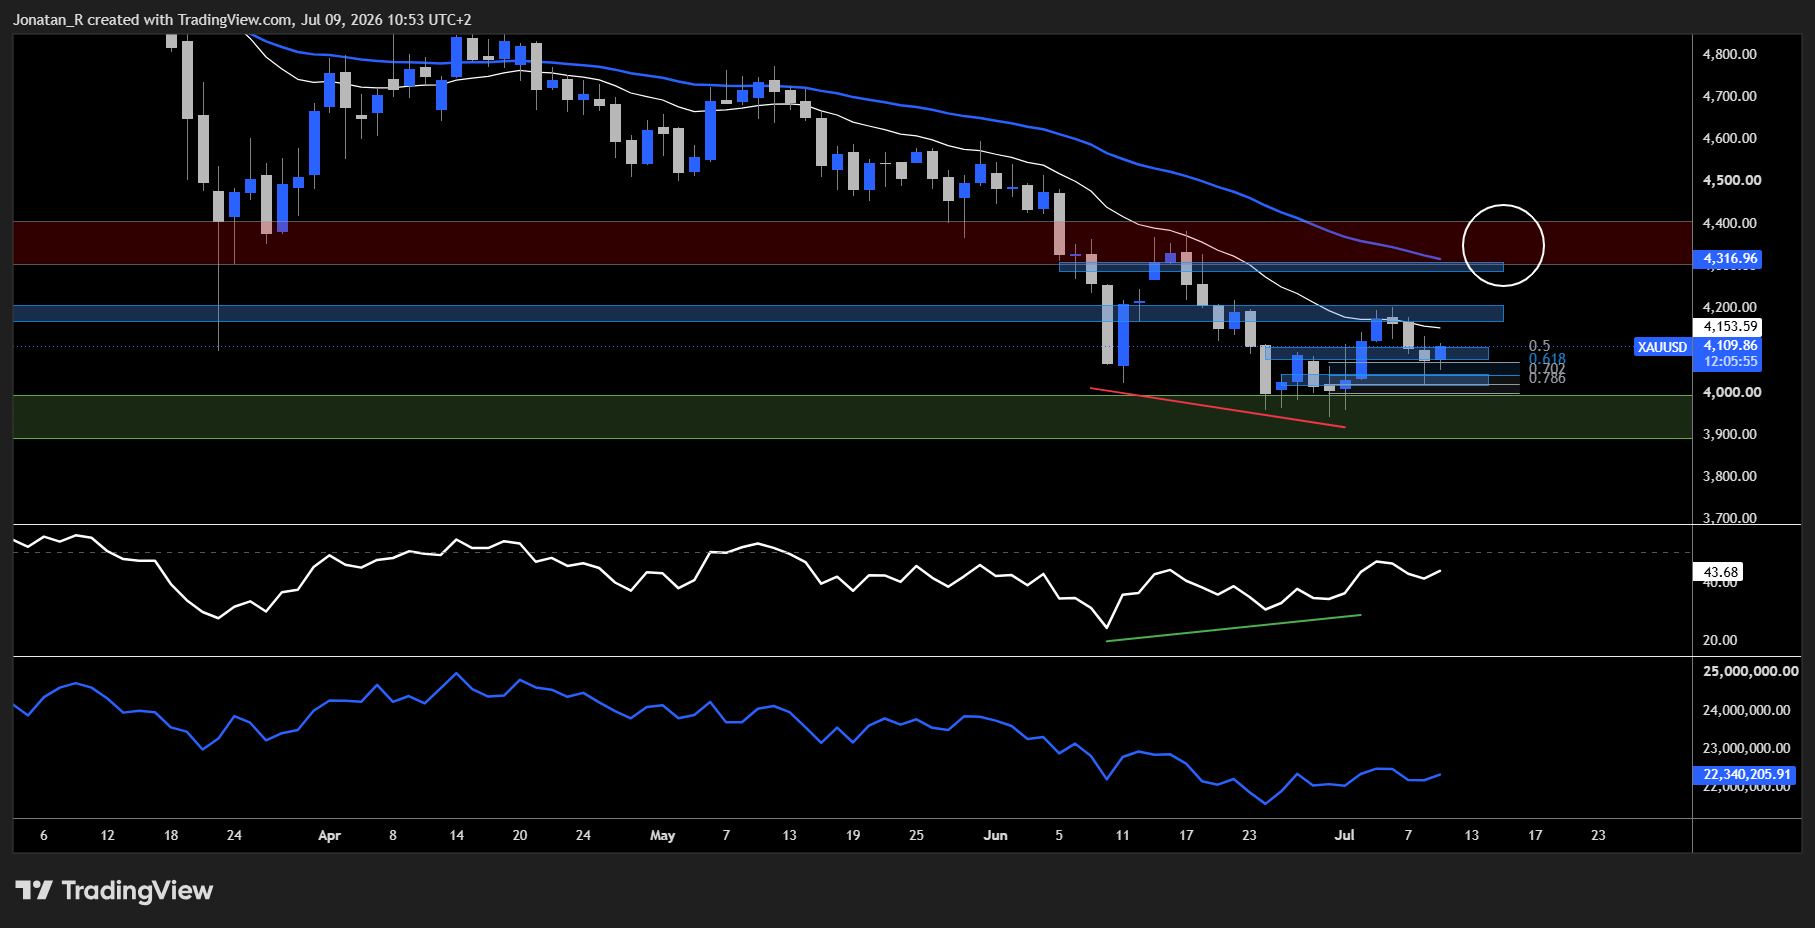
On the daily, the bullish divergence between price and RSI that we highlighted in our previous gold analysis is now playing out. Price is carving a potential higher low, holding the bounds of the reload zone around 4,000, while the accumulation/distribution line at the bottom of the chart is potentially breaking structure to the upside, a sign that buyers may be stepping back in.
For now, price is respecting the white daily 20 EMA as resistance. A reclaim of that level, around 4,200, would potentially confirm a local break of structure. If the current setup resolves higher from there, the 4,300-4,400 resistance zone could come back into play as the next major hurdle.
The 4-hour chart: buyers regaining dominance
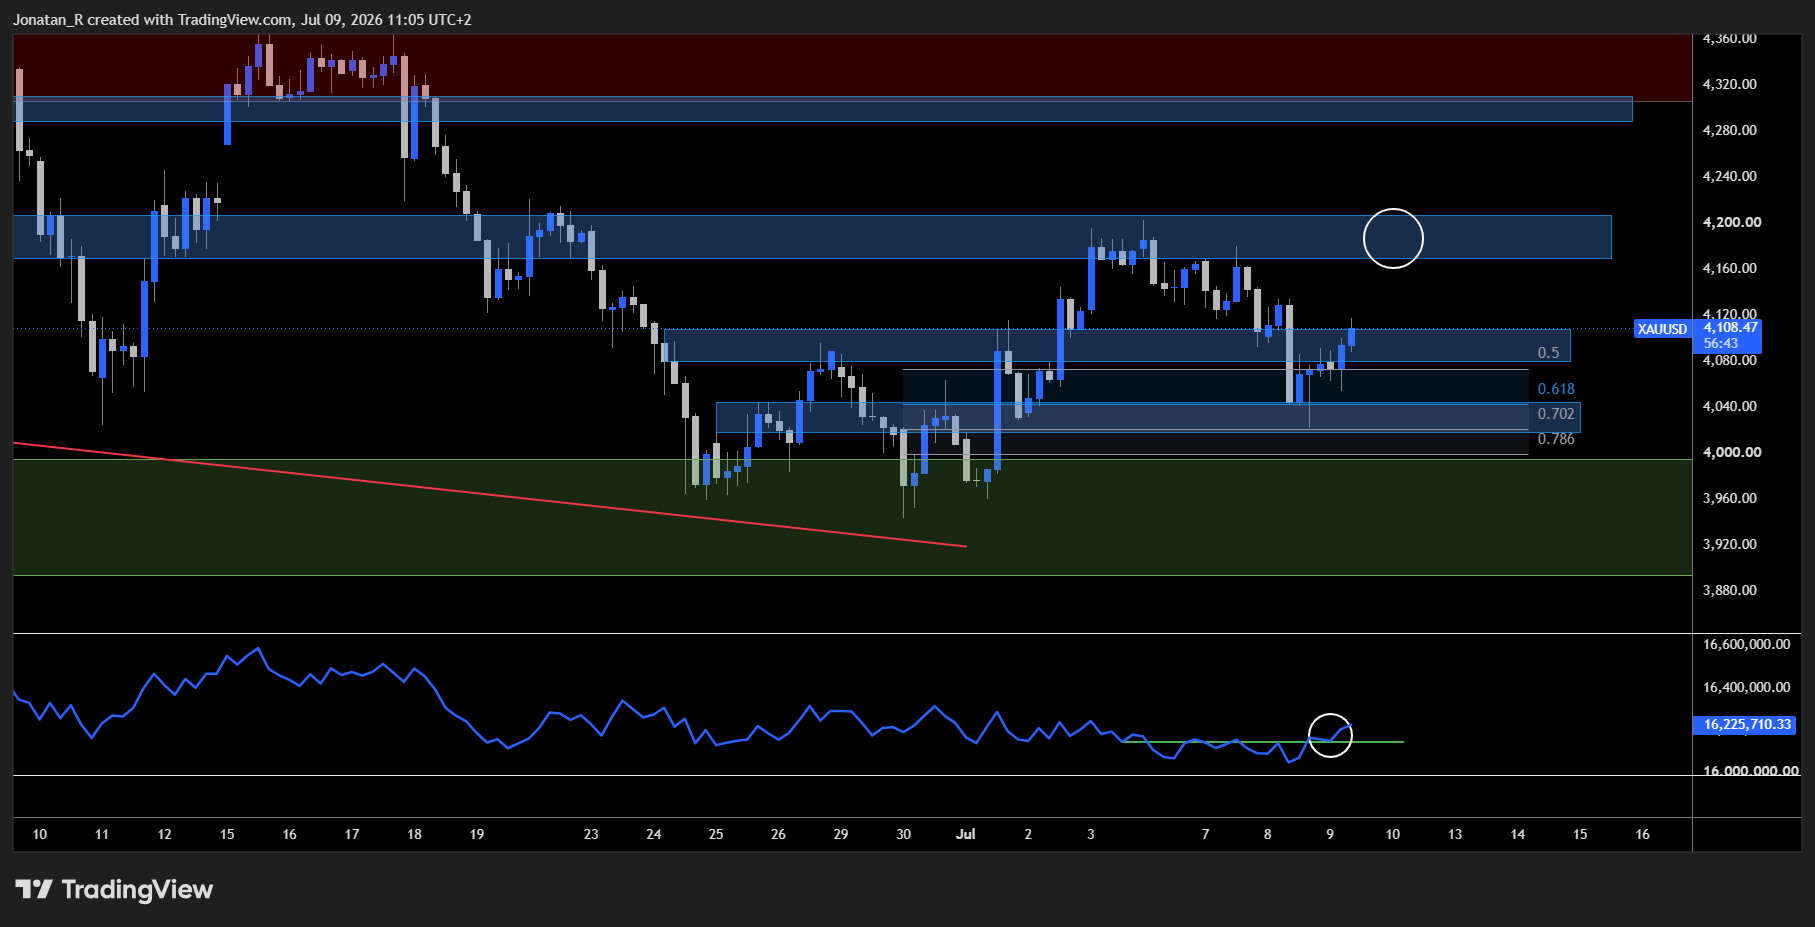
Zooming in, the 4H shows price bouncing within the long reload zone, the area between the 0.618 and 0.786 retracement levels around 4,040. The accumulation/distribution indicator has broken its own structure here too, signalling that buyers are regaining dominance on this higher low.
The next immediate resistance above begins around 4,170. That is the zone price could look to revisit first if the recovery finds continuation to the upside.
Key levels to watch
- 4,000: daily reload zone and potential higher low, the major support bulls need to defend
- 4,040: 4H long reload zone (0.618 to 0.786), where price has bounced
- 4,170: first 4H resistance on any continuation higher
- 4,200: daily 20 EMA, a reclaim would potentially confirm a local break of structure
- 4,300-4,400: major daily resistance zone if the upside resolves
Trade Now
Trading involves risk.
Author



 Risk Disclaimer
The content provided here is for informational purposes only. It is not intended as personal investment advice and does not constitute a solicitation or invitation to engage in any financial transactions, investments, or related activities. Past performance is not a reliable indicator of future results.
The financial products offered by the Company are complex and come with a high risk of losing money rapidly due to leverage. These products may not be suitable for all investors. Before engaging, you should consider whether you understand how these leveraged products work and whether you can afford the high risk of losing your money.
The Company does not accept clients from the Restricted Jurisdictions as indicated in our website/ T&C. Some services or products may not be available in your jurisdiction.
The applicable legal entity and its respective products and services depend on the client’s country of residence and the entity with which the client has established a contractual relationship during registration.