11 min read
 Price falls toward a level it bounced off twice before. A cluster of buy orders is already sitting there, left by traders who made money at that price and want back in, by traders who missed it the first time, and by an exchange’s own resting bids. Price slows, stalls, turns. Nothing mystical happened. The orders were real, and the chart remembered where they were.
Support and resistance are the price zones where that memory lives. Support is a zone where buying has repeatedly been strong enough to stop a fall; resistance is a zone where selling has repeatedly capped a rise. They’re not exact lines, and treating them as lines is why most traders decide they don’t work.
Get the concept right and support and resistance is one of the few pieces of technical analysis with real evidence behind it. Get it wrong and it’s a series of stopped-out trades and a level you delete in frustration.
What support and resistance actually are
Start with the words. A “level” is just a price, or a narrow band of prices, that the market has reacted to before. Support sits below the current price, a floor where demand has shown up. Resistance sits above it, a ceiling where supply has shown up. Flip one and you get the other, which is why they’re always discussed as a pair.
The reason they exist is order flow plus memory, not chart geometry. Picture price dropping back to an area where buyers stepped in a month ago. Three groups reach for the buy button at once. The traders who bought there last time and were right add to their positions. The traders who watched that bounce and missed it treat the return as a second chance. And the traders who sold near that zone, then regretted it as price ran, buy to close. Three motives, one direction: demand concentrates, and the fall stalls. Run the same story with sellers above the market and you get resistance.
That’s the whole mechanism. A level is strong when a lot of orders sit on it and weak when few do. Everything else in this article is about finding where the orders are and reading whether they’re still there.
Why the levels actually work
This is the part that separates support and resistance from most of technical analysis: someone checked, with data, and it held up.
Carol Osler, then at the Federal Reserve Bank of New York, took the support and resistance levels that six major currency-trading firms published to clients and tested them against 10,000 randomly generated sets of levels. The published levels predicted intraday trend interruptions far better than random chance. The edge wasn’t uniform, it varied by firm and by currency pair, but it was there, which is more than most indicators can claim.
Her later work in the Journal of Finance explained why. Digging into the order book of a currency dealing bank, Osler found that take-profit and stop-loss orders pile up at round numbers, and that 96% of the resistance levels the analysts handed out ended in zero. The two order types do different jobs. Take-profit orders lean against the current move, so they produce the bounces. Stop-loss orders fire in cascades once price pushes through, so they produce the breakouts. The level works because the orders resting on it are real money, not a line someone liked the look of.
How to draw support and resistance: zones, not lines
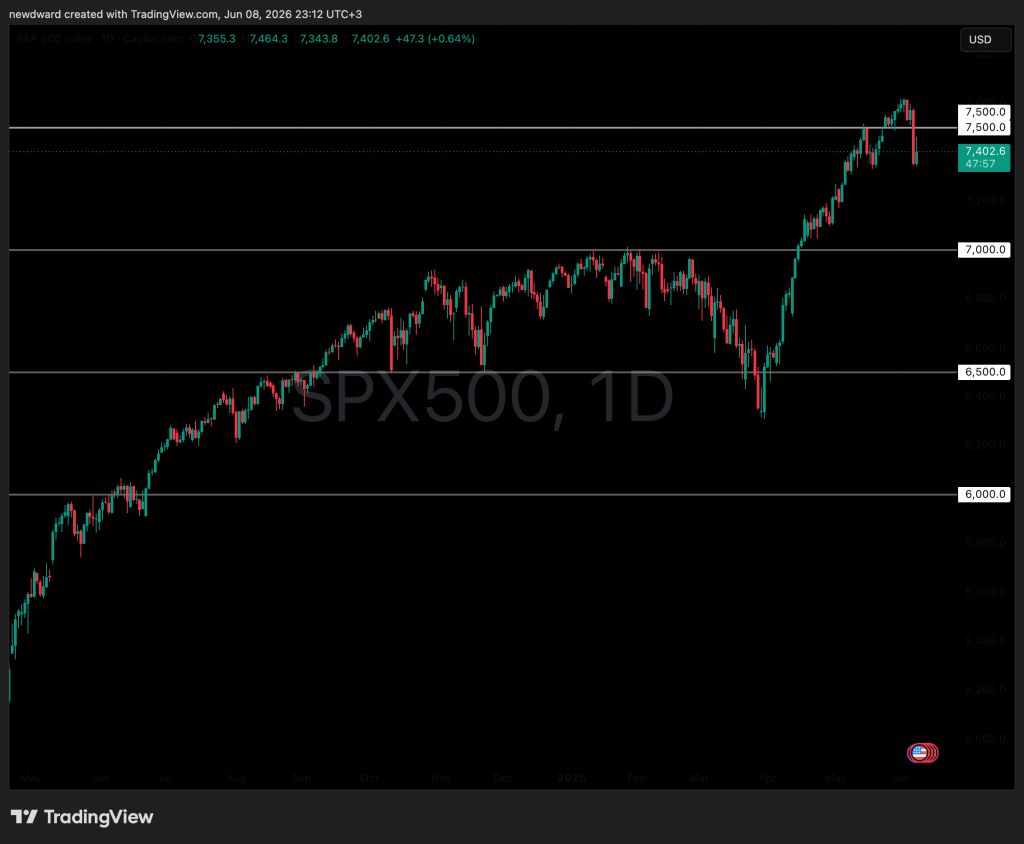
If a level is a concentration of orders rather than a single price, drawing it as a one-pixel line is the original mistake. Thomas Bulkowski put it well: support and resistance behave like thick bands of molasses that slow price down, not tripwires it snaps at a precise point. A 2012 study of US stocks by Zapranis and Tsinaslanidis tested this and found that treating levels as zones works better than treating them as exact prices.
Three habits turn that into a level you can actually draw.
Anchor to candle bodies, not wicks. A wick is a price the market rejected, often a single sweep for liquidity that lasted seconds. A candle body shows where trading actually settled and closed. Draw the zone around the cluster of bodies and let the wicks mark its outer edge.
Wait for two to three touches. One reaction is noise, price bumped something and moved on. A zone earns respect only once the market has honored it more than once. The same US stock study found levels with more prior bounces were more likely to bounce again, which is memory accumulating in front of you.
Weight by timeframe, and mind the clock. A level on the weekly chart is stronger than one on the five-minute, because more participants see it and act on it. But levels also decay: the same research documented predictive power fading over time as the orders behind a level get filled or cancelled. A zone respected for two years and a zone drawn yesterday are not the same zone.
Trading a level: entry, stop, and target
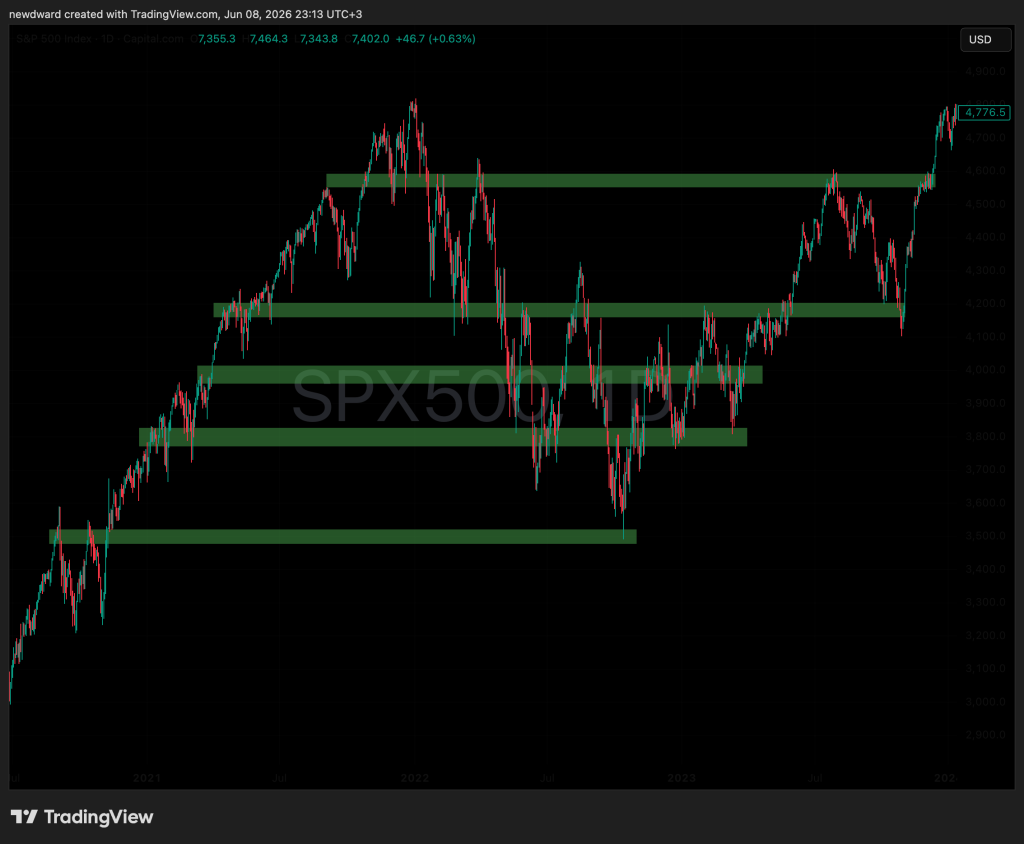
A zone is only useful if it turns into three numbers: where you get in, where you’re wrong, and where you take profit.
Entry. Price arriving at the zone is not the signal. The reaction is. Wait for evidence that orders are actually there: a long wick rejecting the zone, a bullish engulfing candle, a visible stall in downward momentum. Entering the moment price touches a line you drew is a guess. Entering on the reaction is a response to what the order flow just showed you.
Stop loss. Put it beyond the far edge of the zone, not a tick under a single price. Because the level is a band, a stop parked right under one line gets picked off by ordinary noise. The thesis only fails when price closes decisively through the whole band, so that’s where the stop belongs.
Take profit. The logical target is the next opposing zone: from support, the nearest resistance above. This is also the reality check. If the distance to your stop is bigger than the distance to that next zone, the trade pays less than it risks, and it isn’t worth taking however clean the level looks.
Role reversal: when support becomes resistance
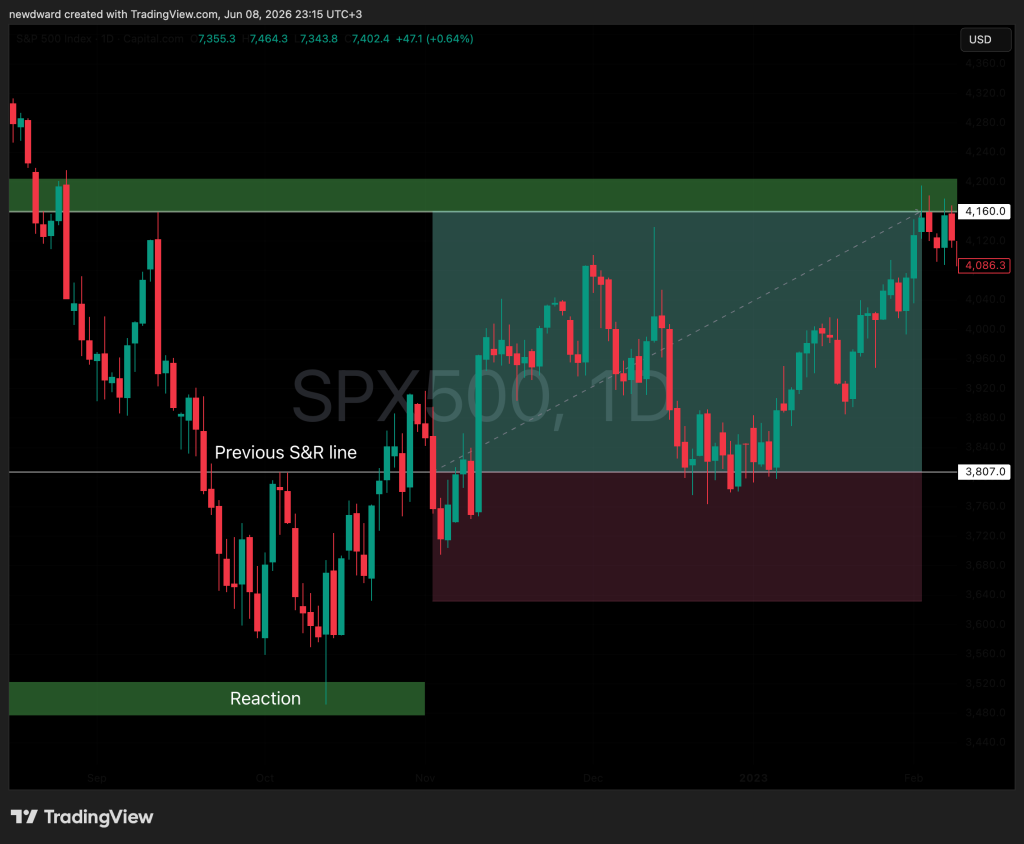
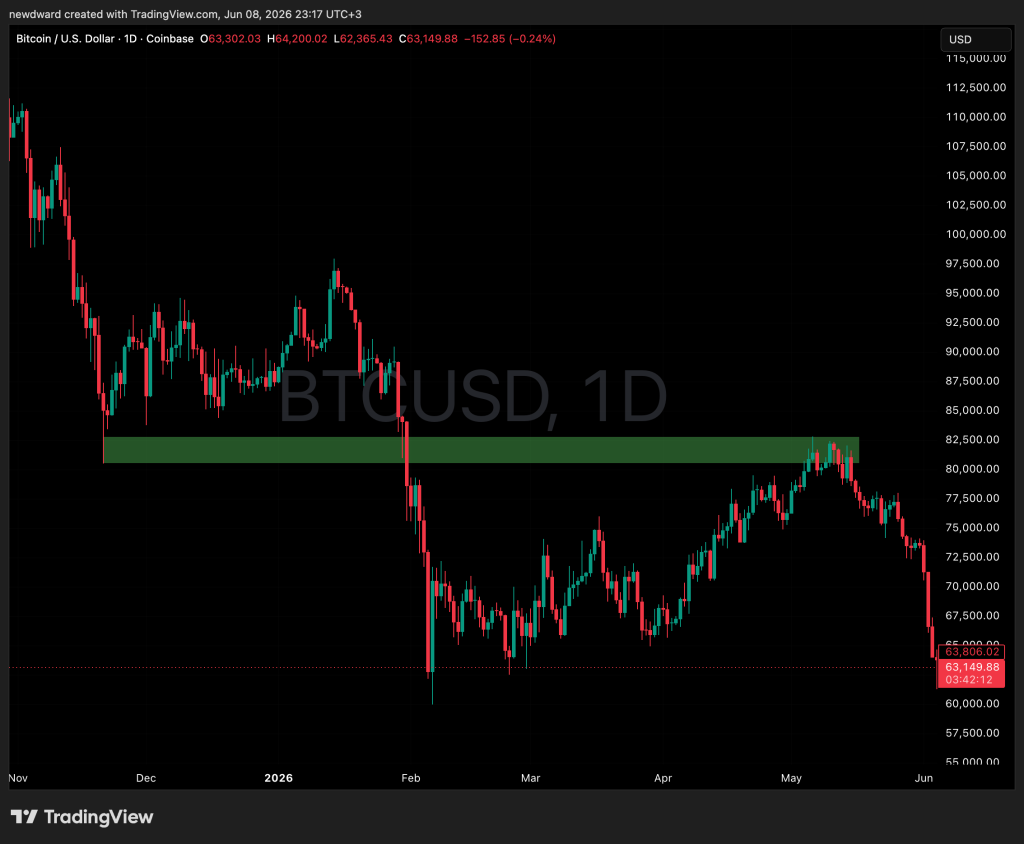
The most useful thing a level does happens after it breaks. Drop decisively through support and that old floor tends to become a ceiling on the next rally. Once again it’s about who got trapped.
Say Bitcoin holds 80,000 as support across several tests. Buyers accumulate there, confident the floor is solid. Then price breaks and slides. Those buyers are now underwater, and a good number of them quietly decide to get out at breakeven if price ever climbs back to 80,000. That decision is a wall of sell orders waiting above the market. When price does return, it hits that latent supply and stalls. The old support is now resistance. The level didn’t vanish when it broke; its polarity flipped, because the orders behind it flipped from demand to supply.
Tools that find the levels for you
Drawing zones by hand builds the intuition, and it’s worth doing. But two indicators automate part of the job and strip out some of the guesswork, which matters because hand-drawn levels are unavoidably subjective.
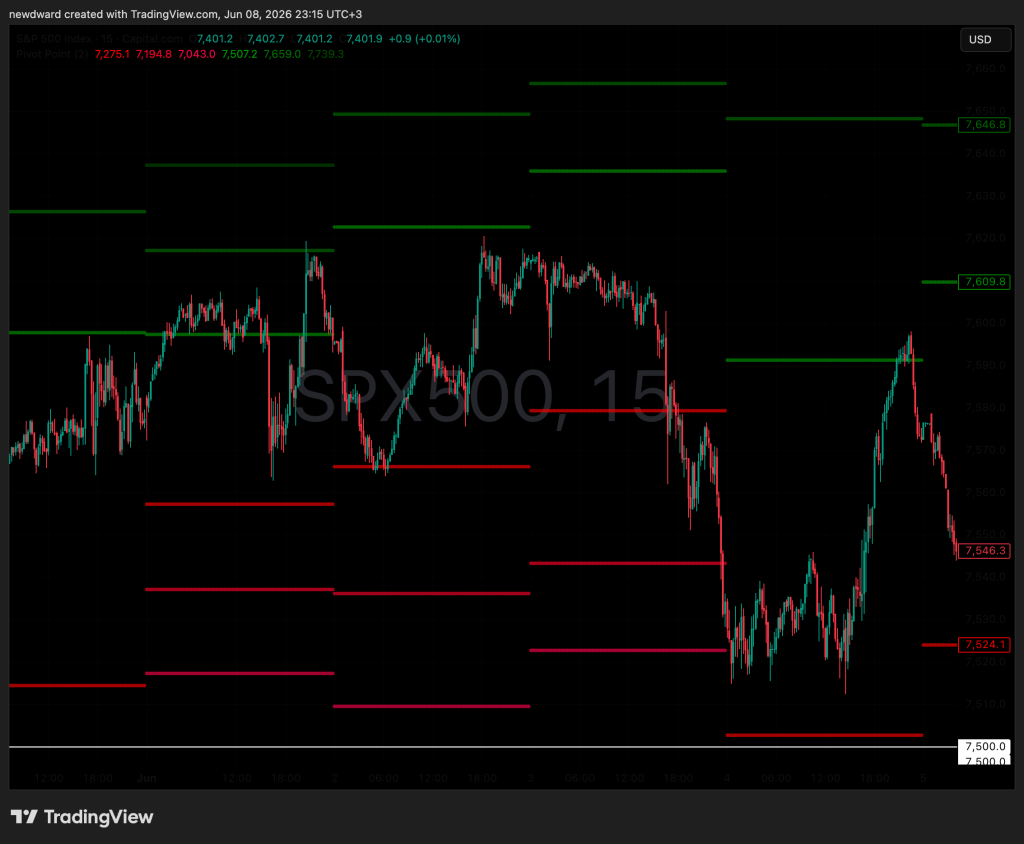
Pivot points calculate support and resistance from the prior period’s high, low, and close. They’re formula-driven and fixed, so every trader using them sees the same levels, which is why intraday traders lean on them for reference points before a session opens. On most charting platforms they apply in a click.
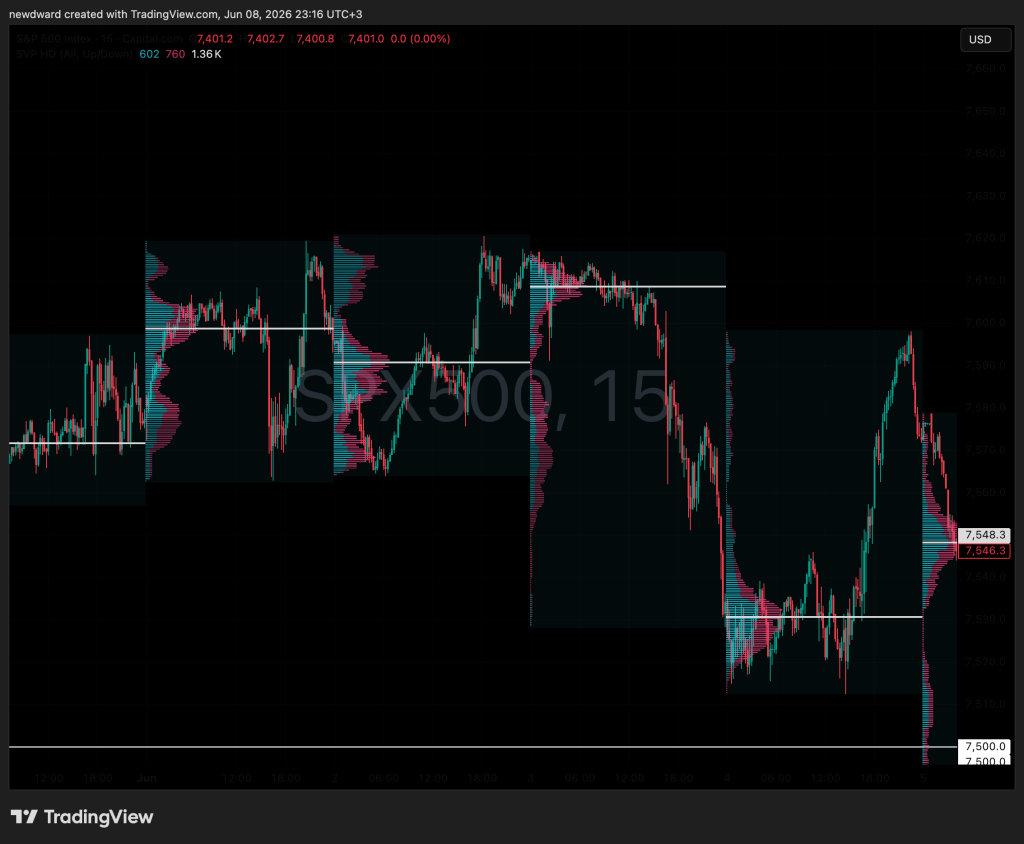
Volume profile comes at it from another angle. Instead of plotting volume over time, it plots how much traded at each price. The high-volume nodes mark the prices where the most business changed hands, and those tend to act as support and resistance for exactly the reason Osler found: volume shows where the orders are. Both tools only nominate candidate zones. Whether a zone still holds is confirmed by price behavior, not by the indicator drawing it.
When support and resistance works, and when it doesn’t
The tool is real, but it isn’t a system, and honesty about the edges is what keeps it useful.
The case for it is measured, not just asserted. Beyond Osler’s work, a 2022 machine-learning study found that feeding engineered support and resistance features into a model lifted its aggregate profitability by 65% across eight currency pairs, versus the same model without them, evidence the information isn’t already baked into price. The tool is also plain to see, every participant is looking at roughly the same chart, and that shared attention makes it partly self-fulfilling.
The case against it is just as concrete. Osler’s own results were uneven across firms and pairs, so the edge is real on average but never guaranteed on the level in front of you. Brock, Lakonishok and LeBaron showed back in 1992 that breakouts from trading ranges helped predict Dow Jones moves from 1897 to 1986, then cautioned that the profits might not survive transaction costs. And drawing levels stays subjective: hand two traders the same chart and you’ll get two slightly different zones.
What decides the outcome is regime. Support and resistance is a range tool at heart, best when price is oscillating between boundaries and stretched moves snap back. In a strong trend, the opposite happens: support in a downtrend, or resistance in an uptrend, tends to give way rather than hold, and the money shifts from fading levels to trading their breakouts. Osler’s data caught both faces of this, bounces while a level holds, acceleration once it breaks. Read the regime before you decide which half of the tool you’re using.
Support and resistance is better understood as a map of where past decisions pile up than as a forecast of the next one. Treat the levels as zones, weight them by touches and timeframe, wait for a reaction before committing, and respect the regime you’re in. The chart is a record of memory, and reading it that way buys you a small but real edge, no more and no less.
This explainer builds on the original analysis published on TradingView by our analyst, worth a read for the annotated charts behind each idea.
Trading involves risk.
What is support and resistance in simple terms?
Support is a price zone where buyers have repeatedly stepped in and stopped a fall. Resistance is a price zone where sellers have repeatedly stepped in and capped a rise. They exist because orders from past trading cluster at those prices, so the market tends to react there again.
How do you identify support and resistance levels?
Look for prices the market has turned at more than once, and draw them as zones rather than single lines. Anchor the zone to the cluster of candle bodies, treat the wicks as its outer edge, and give more weight to levels that have been touched several times and that show up on higher timeframes.
Is support and resistance a reliable strategy?
It has more empirical backing than most technical tools, but the edge is modest and uneven. It works best in ranging markets and tends to fail in strong trends, where levels break instead of holding. Used with confirmation and sensible risk-to-reward, it's a useful map, not a guarantee.
What is role reversal in support and resistance?
When price breaks decisively through support, that old floor often becomes resistance on the next rally, and vice versa. Traders trapped on the wrong side of the break leave orders to exit near the old level, which flips it from a demand zone to a supply zone.
Do support and resistance work in crypto?
Yes. The mechanism is order flow and trapped positions, which apply to Bitcoin and other crypto the same as to stocks or forex. Because crypto trends hard, role reversal and breakout behavior around levels tend to be especially pronounced.
Author


 Risk Disclaimer
The content provided here is for informational purposes only. It is not intended as personal investment advice and does not constitute a solicitation or invitation to engage in any financial transactions, investments, or related activities. Past performance is not a reliable indicator of future results.
The financial products offered by the Company are complex and come with a high risk of losing money rapidly due to leverage. These products may not be suitable for all investors. Before engaging, you should consider whether you understand how these leveraged products work and whether you can afford the high risk of losing your money.
The Company does not accept clients from the Restricted Jurisdictions as indicated in our website/ T&C. Some services or products may not be available in your jurisdiction.
The applicable legal entity and its respective products and services depend on the client’s country of residence and the entity with which the client has established a contractual relationship during registration.