
 8 min read
 Key takeaways
- Alphabet’s revenue rose 24% and Google Cloud grew 82%, but the company lifted 2026 capital expenditure guidance to $195bn to $205bn and reported free cash flow of negative $5.9bn
- Tesla posted record quarterly deliveries and a 26% revenue rise, though adjusted earnings of $0.33 per share missed a consensus near $0.55 as automotive margins fell to 16.3%
- US initial jobless claims fell to 187,000, the lowest since 1969, keeping the Federal Reserve’s focus on inflation with Brent crude above $99
- Alphabet has lost its daily 200 simple moving average today, while Tesla has broken below a support area that has been in play since 2024
Alphabet and Tesla both beat, and both were sold
Alphabet (GOOGL) and Tesla (TSLA) were the first two megacaps to report this season, and both delivered revenue above expectations after Wednesday’s US close. Both were then sold heavily. Alphabet is down around 6.6% and Tesla more than 10% at the time of writing, with the Nasdaq Composite off 1.95%, the S&P 500 down 1.07% and the Dow Jones Industrial Average down 1.02%.
The common thread is capital spending. Both companies reported negative free cash flow for the quarter, and both signalled that the spending is set to increase rather than moderate.
Alphabet’s quarter was strong, its spending plan was not what the market wanted
Revenue rose 24% to $119.8bn against roughly $117bn expected, a twelfth consecutive quarter of double-digit growth. Google Cloud grew 82% to $24.8bn, its fastest pace in at least three years, with the division’s operating margin at 35.6% against 20.7% a year earlier and its backlog up more than $50bn sequentially to $514bn.
The reaction came from the capital expenditure (capex) line on the call. Alphabet raised full-year 2026 capex guidance to $195bn to $205bn from $180bn to $190bn, where consensus sat near $187bn, and repeated that 2027 spending should increase significantly again. Quarterly capex of $44.9bn was itself close to expectations, so the move appears to be about the forward commitment rather than the quarter just reported. Free cash flow came in at negative $5.9bn. Chief financial officer Anat Ashkenazi told analysts the company is “still in a supply-constrained environment”, which frames the spending as a response to demand rather than a bet on it.
One figure needs care. Headline diluted earnings of $9.11 per share included a $99bn gain on equity securities that added $6.26 to the number on its own. Excluding it, net income fell year on year. Alphabet also picked up a separate headwind on Thursday morning, when the European Commission issued fines totalling €890m, split between search self-preferencing and Google Play restrictions, the company’s first under the Digital Markets Act.
Tesla’s problem was margins, not demand
Revenue rose 26% to $28.24bn, comfortably above the roughly $27.6bn expected, on record quarterly deliveries of 480,126 vehicles. Adjusted earnings of $0.33 per share missed a consensus near $0.55.
The miss sat in margins. Automotive gross margin excluding regulatory credits fell to 16.3% from 19.2% the prior quarter, against roughly 18.4% expected. Energy gross margin dropped further, to 20.4% from 39.5%, on warranty adjustments and competition. Operating expenses rose 47%, operating income fell 57%, and operating margin came in at 1.4% against 4.1% a year ago. Capex is guided above $25bn for the year.
The demand indicators read better than the profit line. Tesla exited the quarter with its largest order backlog since 2023, inventory down to 15 days of supply, and Full Self-Driving subscriptions up 56% to 1.48m. Free cash flow was negative $1.09bn, a smaller outflow than the roughly $3.6bn analysts had expected. Elon Musk also declined to rule out a future combination with SpaceX when asked on the call, pointing to increasing overlap between the two companies without committing to a process.
A jobs number that leaves the Fed looking at inflation
Thursday morning’s labour data added to the pressure. Initial jobless claims fell by 22,000 to 187,000 for the week ended 18 July, the lowest reading since September 1969, against expectations for a small rise to around 212,000. Continuing claims fell to a six-week low of 1.796m.
A labour market that tight removes much of the argument for easing, and it arrives with Brent crude above $99 after further strikes in the Middle East. For companies valued on distant cash flows, a firmer rate outlook tends to weigh on the multiple, and that landed on top of two disappointing sets of results.
The suppliers held up better than the spenders
Not everything sold off. Memory names traded higher, with Micron approaching $1,000 again and SK Hynix rising, on the view that Alphabet’s spending flows into their order books. The Philadelphia Semiconductor Index was close to flat at +0.09% while the Nasdaq fell almost 2%. South Korea’s Kospi had already closed up 3.6% overnight on the same logic. The weakness within semiconductors sat in the non-AI names, with Microchip Technology, Qualcomm and Texas Instruments among the Nasdaq’s larger fallers.
That split is worth noting given where the sector has been. In our previous coverage of the Nasdaq earlier this week we looked at semiconductors falling into potential bear market territory on fears that cheaper Chinese models could undercut the economics of the AI build-out. The largest single buyer of that infrastructure has now committed a further $15bn to $25bn.
Alphabet daily chart
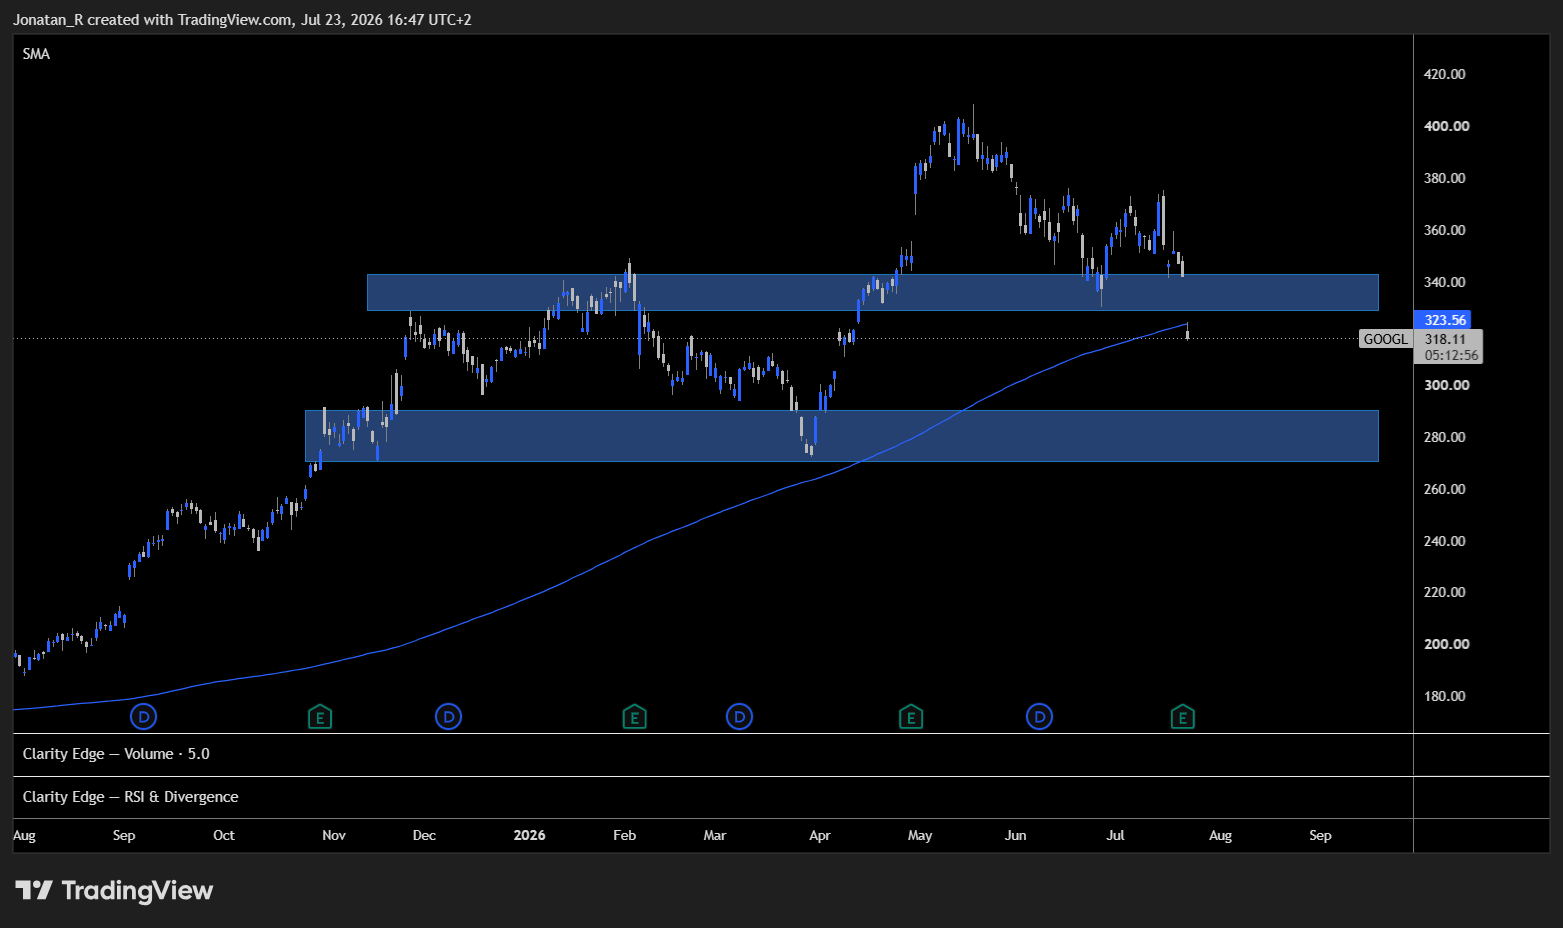
Alphabet trading below the daily 200 simple moving average after failing the support area above.
Looking at Alphabet on the daily, price has lost the daily 200 simple moving average today, currently at 323.56. That’s the first time the moving average has given way after supporting the advance through the first half of the year.
Price has also failed the support area marked above, the zone between 330 and 345. That area worked as resistance through the turn of the year before flipping to support in the spring, and it has held on several tests since. With price now below it, that zone becomes resistance overhead.
There is one support below of interest, the lower zone between 270 and 290. That’s the area price last reacted from in April, and it’s the level we’d be watching if the 200 simple moving average isn’t reclaimed.
Tesla daily chart
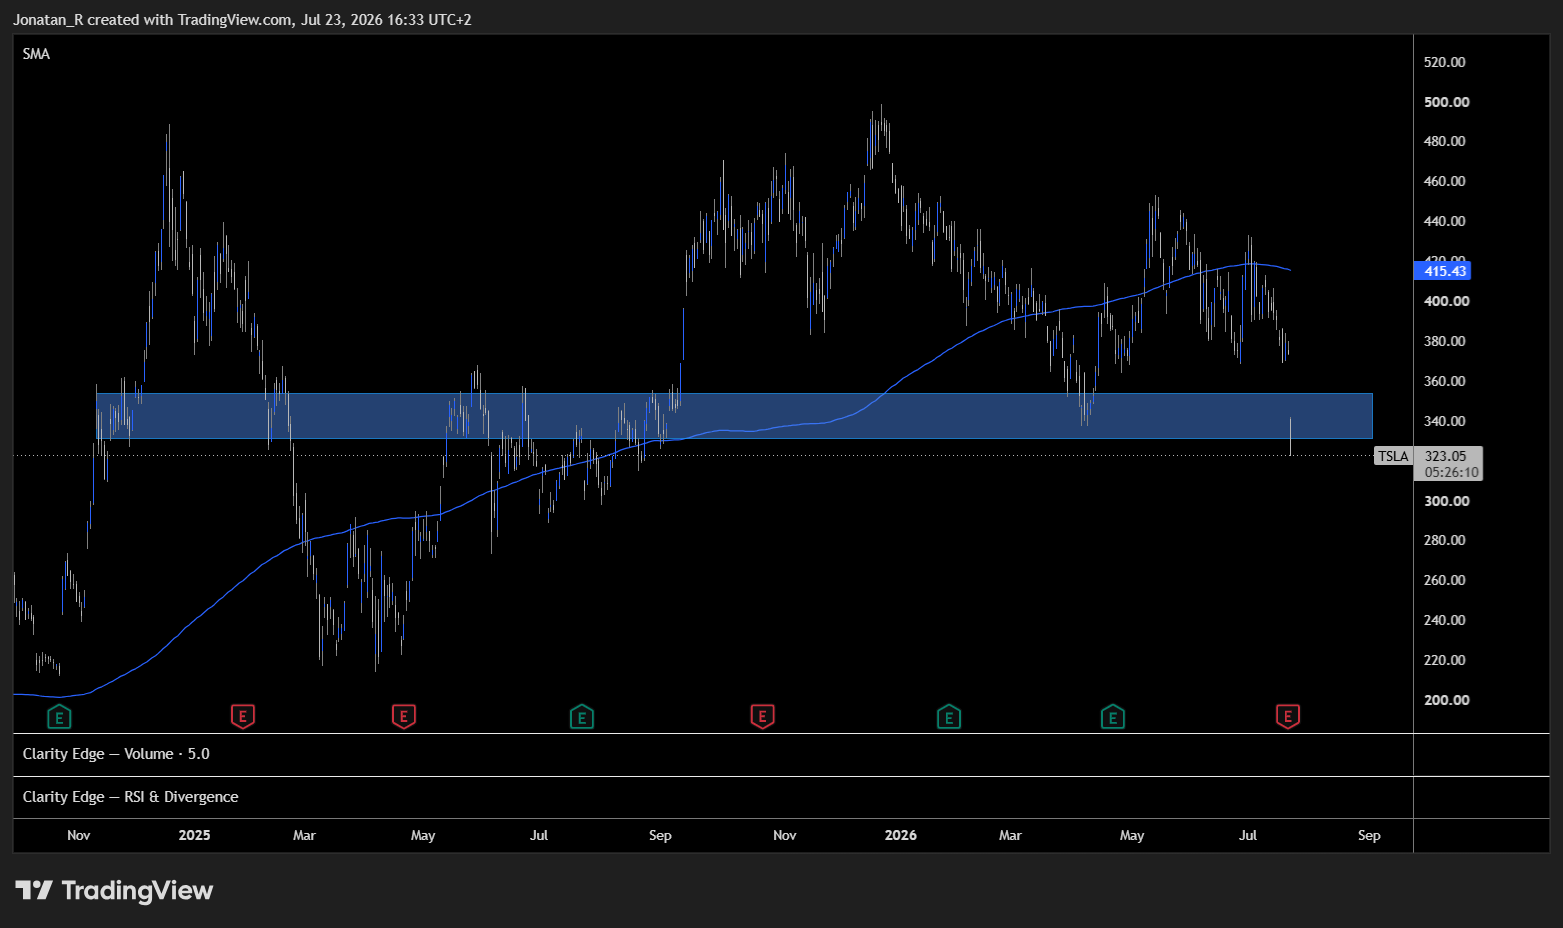
Tesla trading below the support zone that had held since 2024, with price well under the moving average.
Tesla has broken below a significant level. The zone marked on the chart, between 332 and 354, has been an important area going back to late 2024, working as both support and resistance at different points and holding as support again earlier this year. Today price has traded through it. The candle pushed back up into the zone intraday before being rejected, which for now leaves that area overhead as resistance rather than support.
Price is also trading well below its moving average at 415.43, which has been rolling over since the highs earlier in the year.
Trading involves risk.
Author



 Risk Disclaimer
The content provided here is for informational purposes only. It is not intended as personal investment advice and does not constitute a solicitation or invitation to engage in any financial transactions, investments, or related activities. Past performance is not a reliable indicator of future results.
The financial products offered by the Company are complex and come with a high risk of losing money rapidly due to leverage. These products may not be suitable for all investors. Before engaging, you should consider whether you understand how these leveraged products work and whether you can afford the high risk of losing your money.
The Company does not accept clients from the Restricted Jurisdictions as indicated in our website/ T&C. Some services or products may not be available in your jurisdiction.
The applicable legal entity and its respective products and services depend on the client’s country of residence and the entity with which the client has established a contractual relationship during registration.








