7 min read
 Technical picture
Bitcoin trades at $62,995, up 1.53% on the week, after breaking out of a falling wedge, retesting the upper boundary, and turning higher. The move now presses toward the green 50-day EMA near $65,797, the first real obstacle overhead. A clean break there would open the path toward the daily fair value gap, the yellow box between roughly $68,000 and $70,447, where supply left from the prior breakdown is more likely to cap the advance.
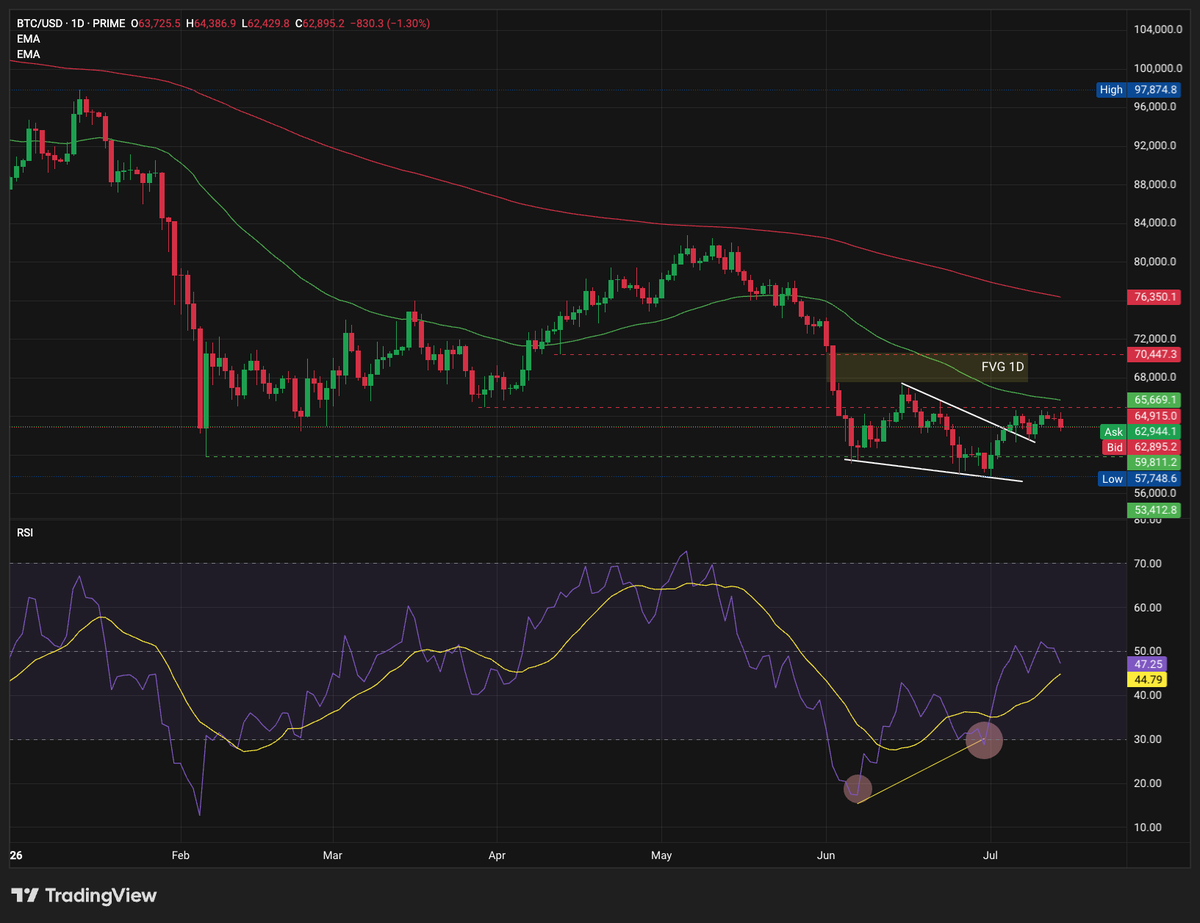
That EMA is not a given. Price has failed at it before, and the RSI at 52 sits just above its signal line near 44, enough to confirm the bounce but not enough to call it a trend. The on-chain and sentiment sections below quantify why this still looks more like consolidation than a confirmed low.
Crypto heatmap
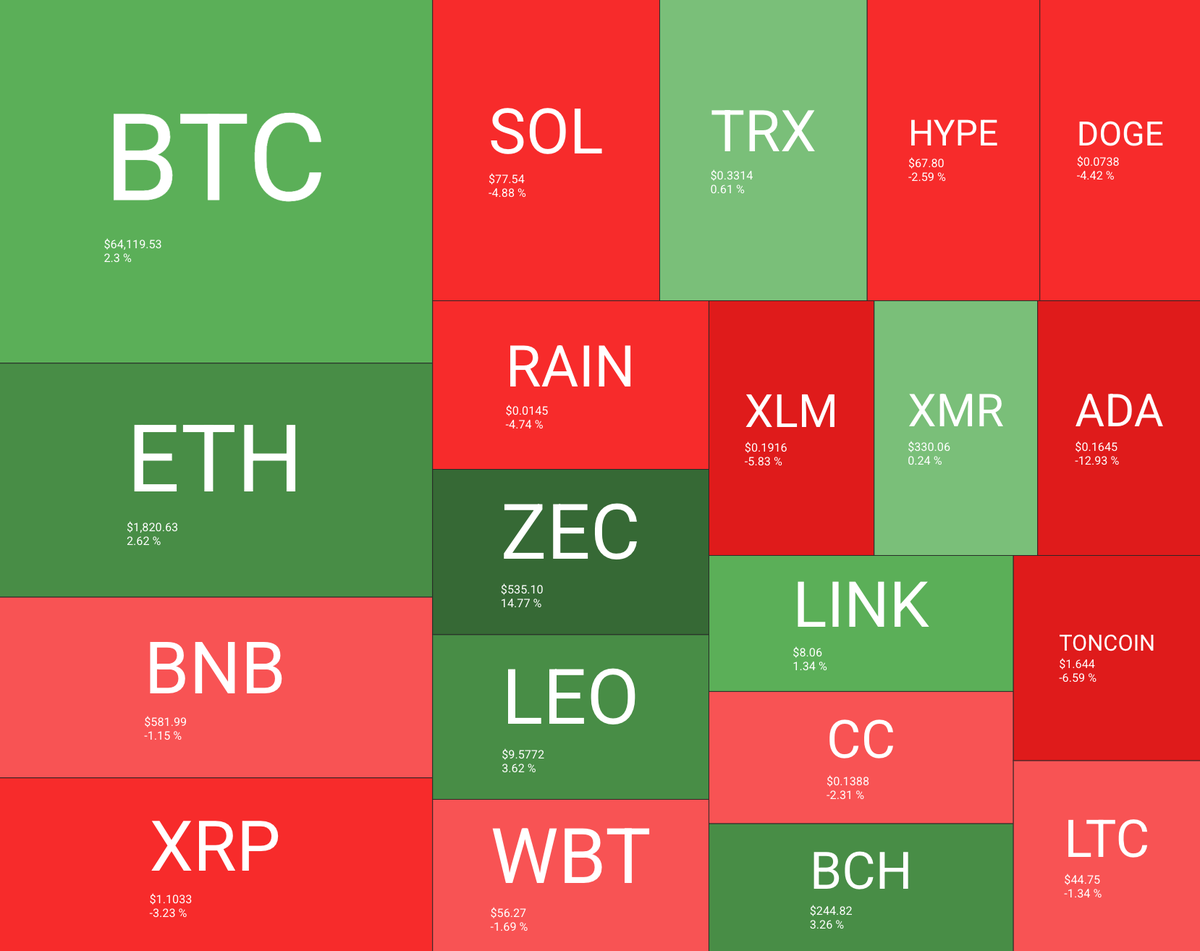
The tape split this week. Bitcoin held green at $64,120, up 2.3%, and Ether firmed 2.62% to $1,820, but most of the large caps leaned red.
Source: https://quantifycrypto.com/heatmaps
Solana fell 4.88% to $77.54, Cardano dropped 12.93% to $0.1645, and XRP slipped 3.23% to $1.10. The standouts sat on the privacy and value side: Zcash jumped 14.77% to $535 and Monero held $330. With Bitcoin up while the majority of alts fell, leadership stayed narrow, the same divergence the altcoin index picks up next.
Altcoin Season Index
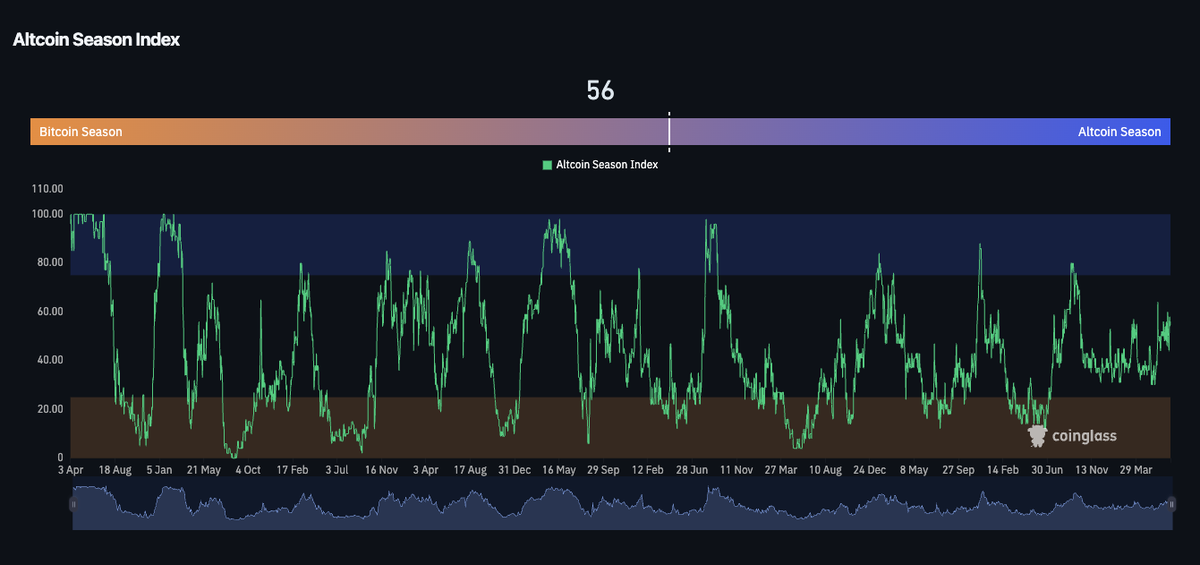
The Altcoin Season Index reads 56, up from 54 a week ago, barely moved and still near the midline between Bitcoin season and altcoin season.
Source: https://www.coinglass.com/pro/i/alt-coin-season
A reading here says neither side has taken control. It matches the heatmap above: Bitcoin and the broad altcoin complex are moving in opposite directions rather than trending together, which keeps rotation muted.
Fear and Greed Index
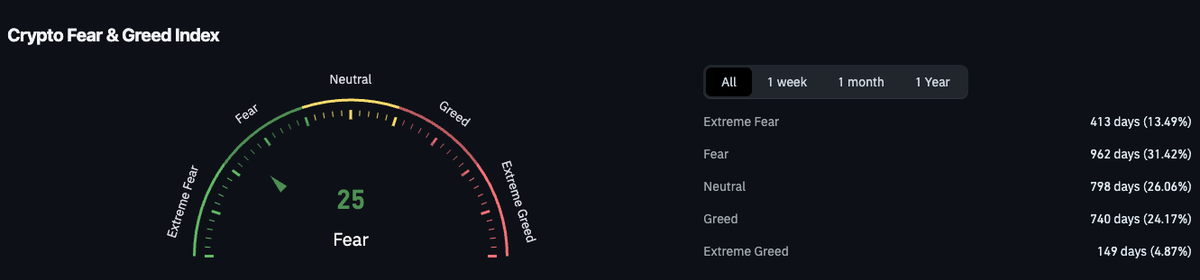
The Crypto Fear and Greed Index reads 25, unchanged from last week and still inside the Fear zone.
Source: https://www.coinglass.com/pro/i/FearGreedIndex
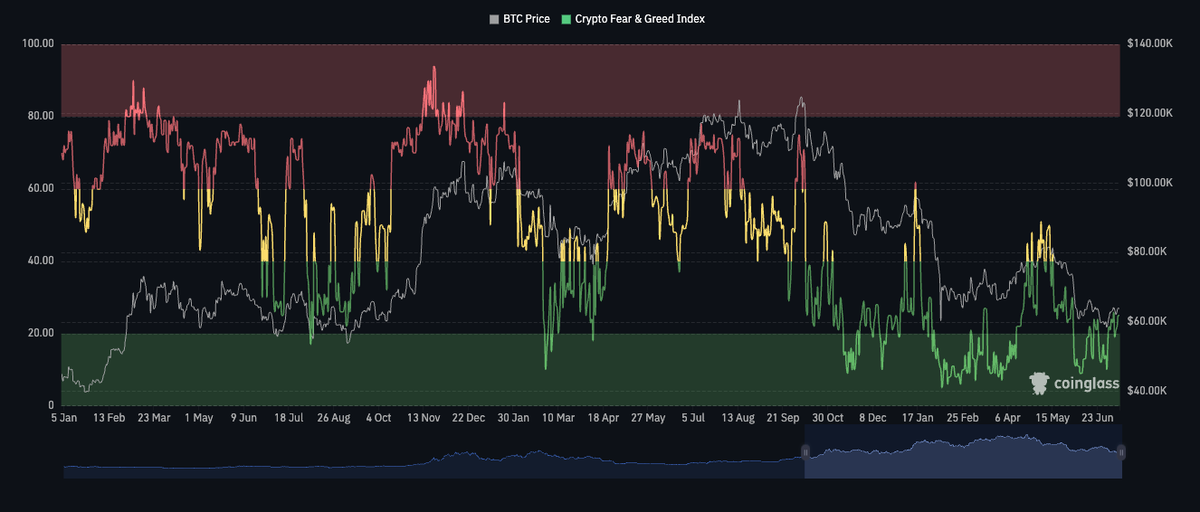
A level of fear this persistent has worked as a medium-term reversal signal before, and the last two weeks of stabilization are consistent with that read. It is a backdrop for a bounce, not a confirmation of one, and it pairs with the Glassnode picture two sections below.
Last week’s macro data
Two prints framed the week. The June jobs report, released July 2 ahead of the holiday, showed nonfarm payrolls up just 57,000, well below the 115,000 consensus, with April and May revised down by a combined 74,000. The unemployment rate ticked to 4.2%. Three days later the June FOMC minutes, published July 8, showed a split committee: eight members saw no change this year, nine leaned toward at least one hike, and Chair Warsh withheld a dot plot projection. The funds rate stays at 3.50 to 3.75%.
For crypto the mix is two-sided. A soft labor market strengthens the case for eventual easing, which supports risk assets, but hawkish-tilted minutes cap how far that argument runs before the June CPI print on July 14. That tension is part of why price is consolidating rather than trending.
Bitcoin liquidation map
Coinglass liquidity data shows leverage stacked close to spot. With Bitcoin near $64,116, the heaviest pools of margin sit just below around $63,000, with larger clusters higher near $67,000 and $68,000.
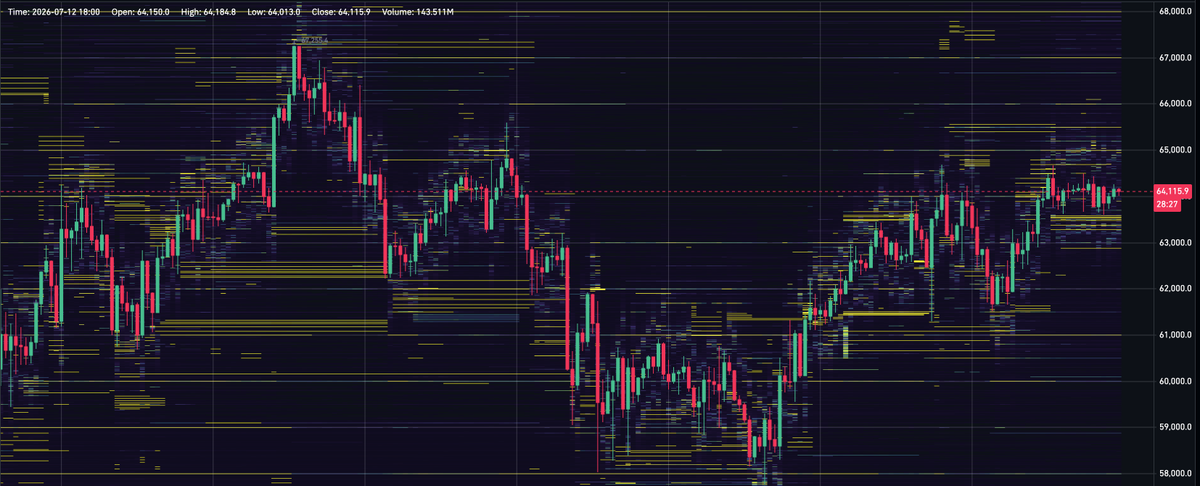
Source: https://www.coinglass.com/LiquidityHeatmap
A sharp flush into the lower pocket followed by a recovery would make a move toward the upside clusters more probable, since price tends to seek the resting liquidity above. This is descriptive of where the fuel sits, not a forecast of the sequence.
Bitcoin enters consolidation
Glassnode’s Week 28 review frames the same setup on-chain: the market is easing into consolidation. Net selling pressure in spot has dropped, futures activity is rising as more traders open long positions, and the funding rate has moved above its average. Outflows from US spot Bitcoin ETFs have contracted as the average ETF holder returns to profit. On the options side, the open-interest put/call ratio has fallen to 0.56, its lowest of 2026, meaning traders hold far fewer puts than calls.
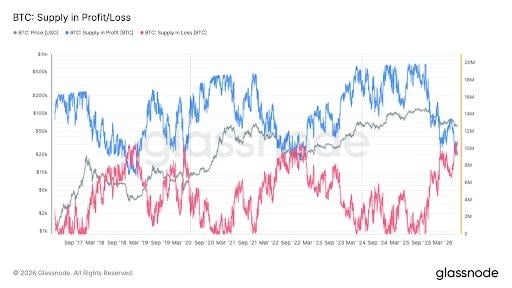
The chart above tracks supply in profit against supply in loss, and the loss share is now starting to edge above the profit share. Historically this marks a moment of peak stress for spot holders and tends to appear before a bear market bottom forms, not after. The caveat is that a rising share of short-term, price-sensitive capital can still produce swings in both directions.
Bitcoin’s realized price
The Binance reserve realized price sits near $60,000, close to where Bitcoin trades now.
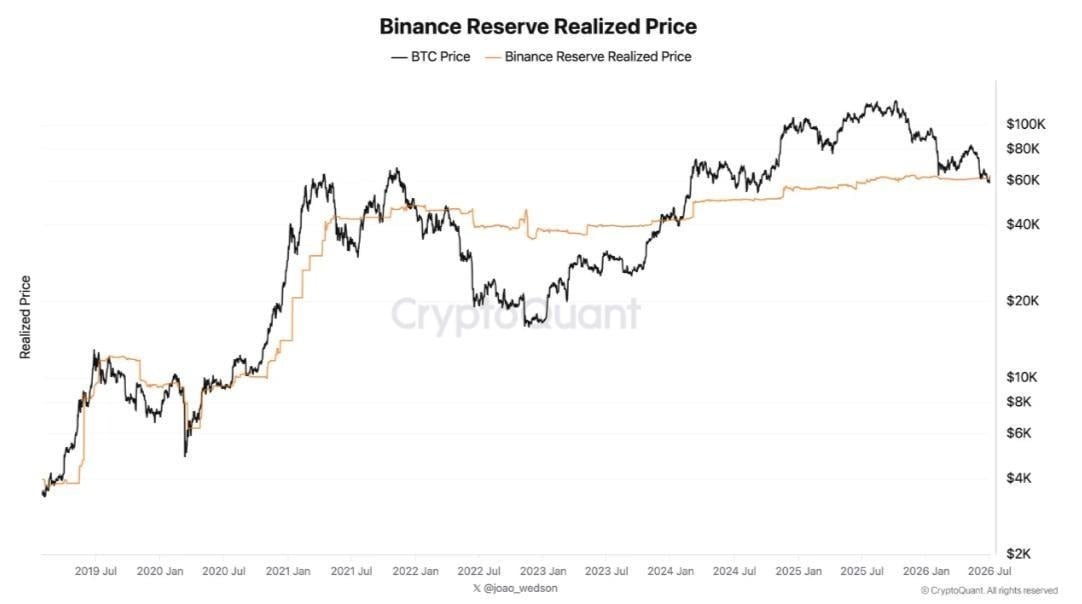
When spot and this cost basis converge, the average coin on the exchange is close to break-even, the value zone the fear and on-chain sections both point to. It reinforces the read: price is sitting on cost basis, digesting, rather than extending in either direction.
Oil price
Brent trades at $76.50, down 0.12% on the session, after a volatile week that spiked it above $80 on July 8 before it faded back. The move up came from renewed Middle East tension; the fade came as OPEC+ confirmed another supply increase, 188,000 barrels a day from August, its fifth consecutive monthly hike, and as Strait of Hormuz shipping normalized. J.P. Morgan still models Brent averaging near $60 for 2026 on soft fundamentals.
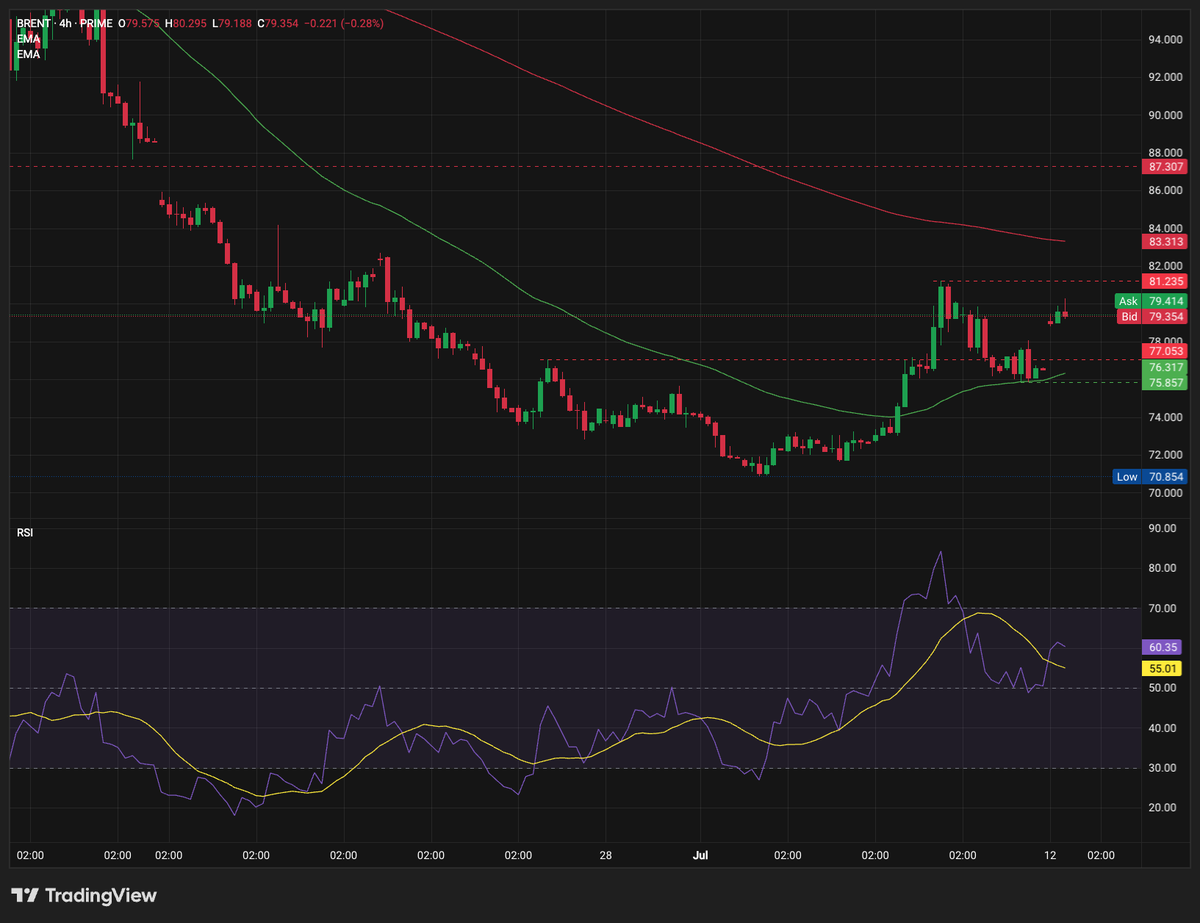
For crypto the channel runs through inflation. If energy stays firm, it hardens the sticky-inflation case that keeps the Fed cautious, the same constraint the macro section flagged. If Iran tension eases further and supply keeps building, Brent has room to reprice lower and loosen that constraint.
Conclusion
The medium-term setup carries hints of continuation higher: the wedge breakout, easing selling pressure, building futures longs, shrinking ETF outflows, and a Fear reading that has marked reversals before. But this is a capitulation phase, and the caution runs both ways. Moves in either direction can flush leveraged positions and let institutions unload, and price is still parked on its realized cost basis under a falling 50-day EMA. Until Bitcoin clears $65,797 and holds, and the June CPI on July 14 clarifies the Fed path, the base case is consolidation rather than a confirmed low.
Trading involves risk.
Author



 Risk Disclaimer
The content provided here is for informational purposes only. It is not intended as personal investment advice and does not constitute a solicitation or invitation to engage in any financial transactions, investments, or related activities. Past performance is not a reliable indicator of future results.
The financial products offered by the Company are complex and come with a high risk of losing money rapidly due to leverage. These products may not be suitable for all investors. Before engaging, you should consider whether you understand how these leveraged products work and whether you can afford the high risk of losing your money.
The Company does not accept clients from the Restricted Jurisdictions as indicated in our website/ T&C. Some services or products may not be available in your jurisdiction.
The applicable legal entity and its respective products and services depend on the client’s country of residence and the entity with which the client has established a contractual relationship during registration.