8 min read
Technical picture: bulls defend $75,000
Bitcoin is pressing the $75,000 support on the 4-hour chart, trading at $75,719 after a week in which every rally was sold quickly. The midterm-night dip to about $75,600 on November 4 turned into a spike to roughly $81,000, but the wick above $80,106 reversed within hours, and Thursday’s equity sell-off dragged price straight back to the floor. The descending line that has guided the decline since early October now meets $75,000, and the 50-week moving average near $75,700 sits in the same zone. The RSI holds at 39.6 inside a narrowing range and has stayed out of oversold territory throughout the decline, which leaves momentum room to weaken further.
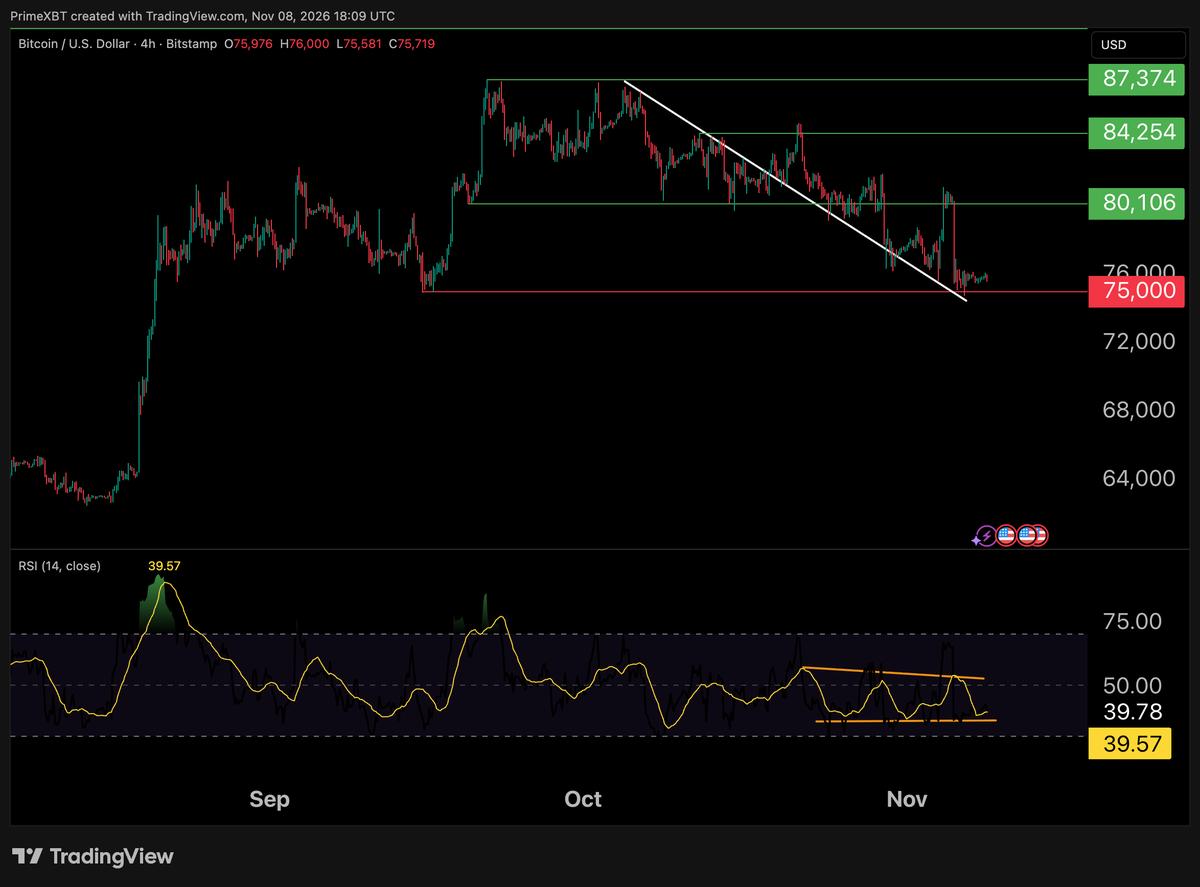
A 4-hour close below $75,000 would leave no marked support on this chart, and the August surge passed through the $68,000 to $74,000 area in a handful of candles. Analysts describe the $70,000 to $75,000 band as a thin liquidity pocket. On the upside, a reclaim of $80,106 is the first condition for a recovery, with $84,254 and $87,374 above.
Crypto heatmap: privacy coins hold the only green
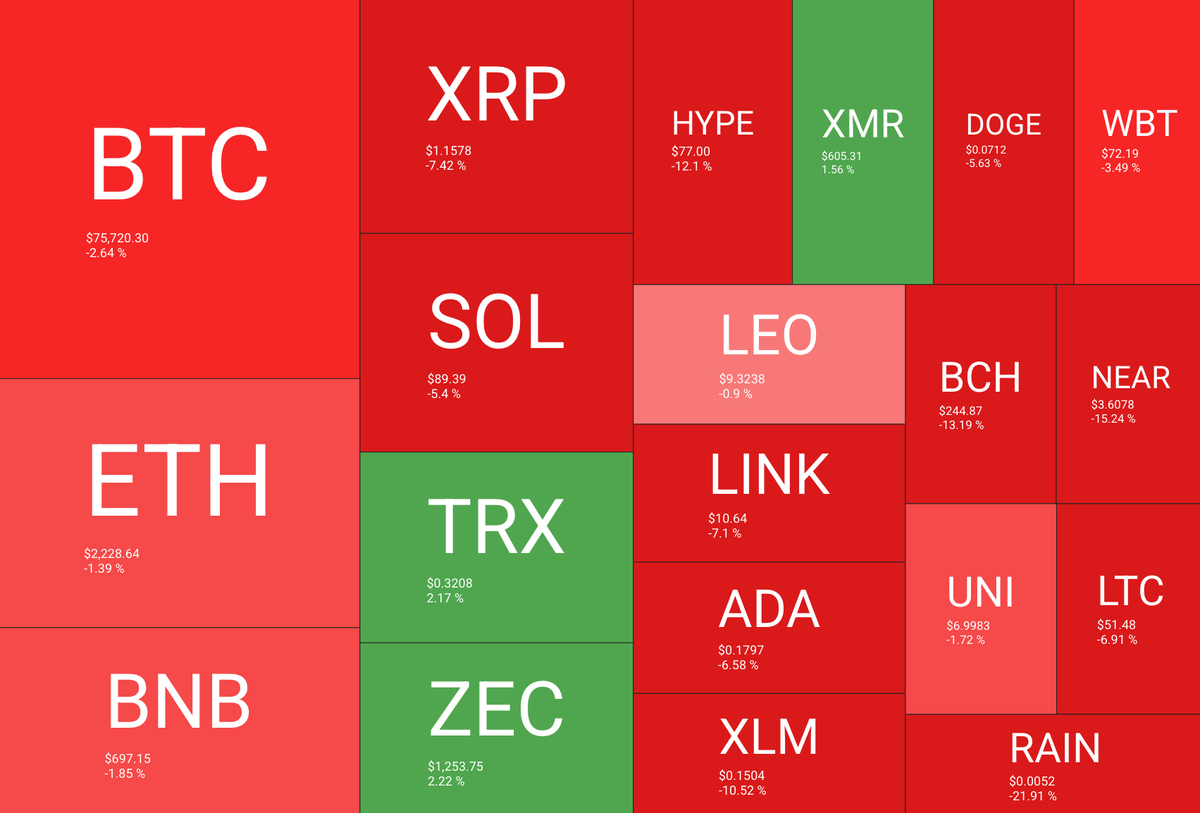
The heatmap is almost entirely red. Bitcoin trades at $75,720 (-2.64%), while Ether (-1.39%) and BNB (-1.85%) held up better than most large caps. The heaviest losses came from RAIN (-21.91%) and NEAR (-15.24%). NEAR fell out of the top 20 by market value on November 3, even as holders approved a proposal to slow new token supply, a sign that positioning outweighed fundamentals. RAIN has no confirmed catalyst this week, but the token has repeatedly come under supply pressure from unlocks this year. BCH (-13.19%) and HYPE (-12.1%) round out the bottom.
Source: https://quantifycrypto.com/heatmaps
Only three tiles are green. Zcash leads at $1,253.75 (+2.22%) after its NU7 upgrade activated around November 6, cutting block time from 75 to 25 seconds, although no direct link between the upgrade and the price has been shown. TRON follows at $0.3208 (+2.17%), extending a rebound that started on November 2, and Monero adds 1.56%.
Altcoin Season Index eases to 46
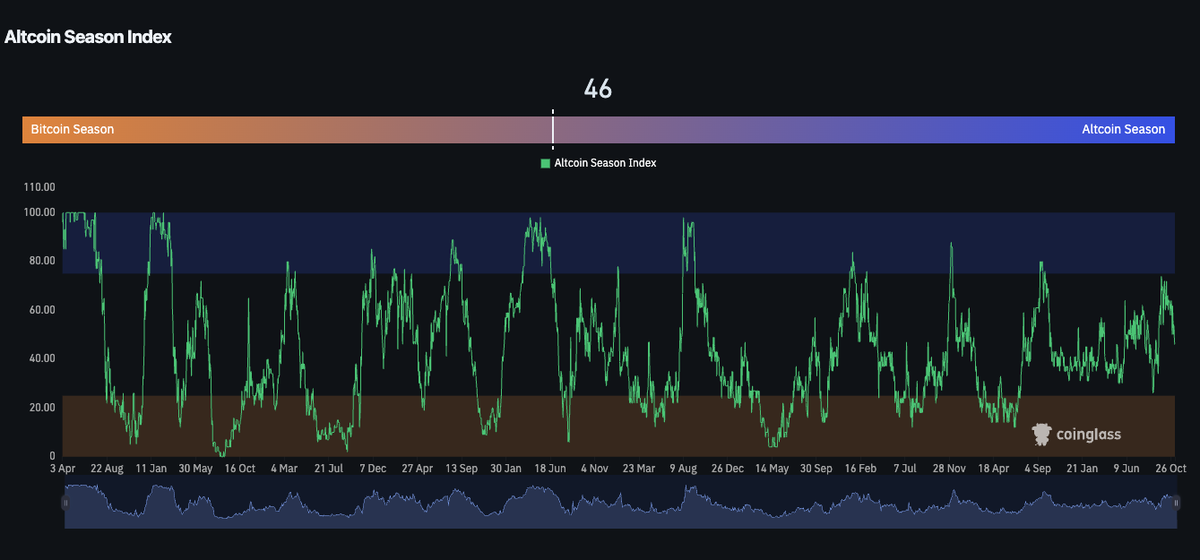
The Altcoin Season Index reads 46, down from about 73 in late October, so the slide has lasted roughly two weeks. The reading is neutral: below 25 marks Bitcoin season, above 75 altcoin season. The backdrop explains why risk appetite drained out of smaller tokens. Strong US payrolls lifted December Fed hike odds to about 77%, and the AI-led tech sell-off cut the S&P 500 by 2.7% on the week. Inside crypto, the $6.3 billion Binance hack on October 29, the largest crypto theft on record, added an exchange-risk discount.
Source: https://www.coinglass.com/pro/i/alt-coin-season
Altcoins usually carry higher beta to this kind of risk-off move, which matches the red heatmap above.
Fear and Greed slides into Fear
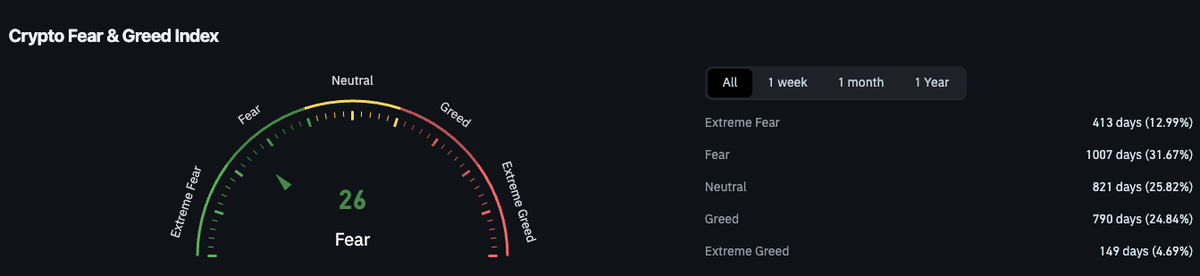
The Crypto Fear and Greed Index stands at 26, in Fear and six points above the Extreme Fear threshold.
Source: https://www.coinglass.com/pro/i/FearGreedIndex
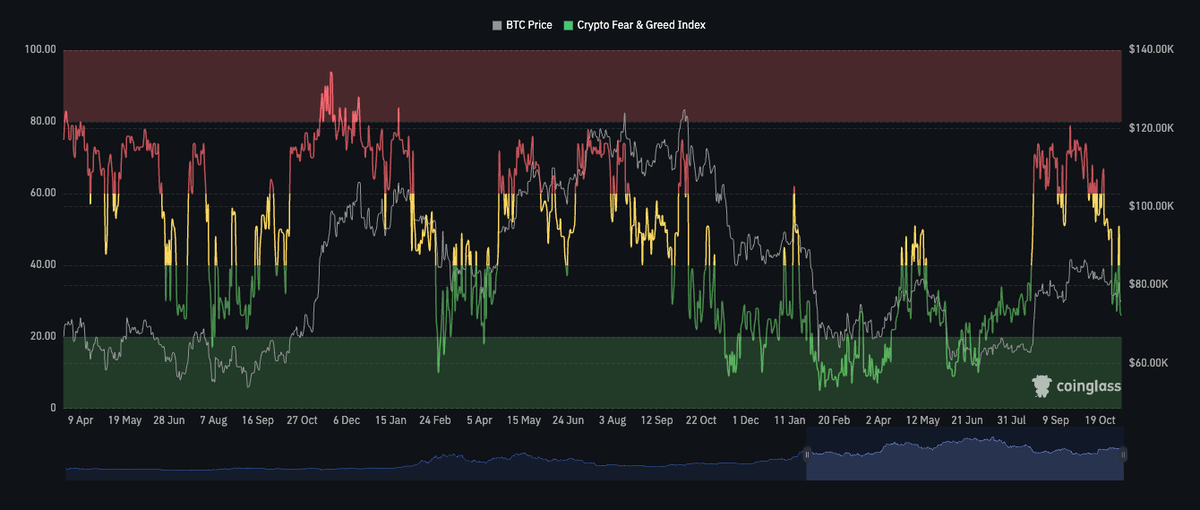
The history chart shows how fast sentiment has turned: the index was near 80 in early September and has fallen steadily since. The two dips into Extreme Fear earlier this year, in February and in June to July, came near Bitcoin lows around $60,000 and were followed by rallies. A reading of 26 is not yet that kind of washout. If sentiment keeps sliding while price holds $75,000, the zone could start to attract longer-term buyers; if $75,000 breaks, the index has room to reach Extreme Fear first.
Hyperliquid whales build the largest net short since October 2025
Large traders on Hyperliquid have turned decisively bearish on Bitcoin. Glassnode’s 24-hour mean of their BTC perpetual positions, long minus short, has dropped to about -1,250 BTC, the deepest net short since October 2025. The cohort had been net long since March and flipped short only in the last week of October, as Glassnode flagged on October 27.
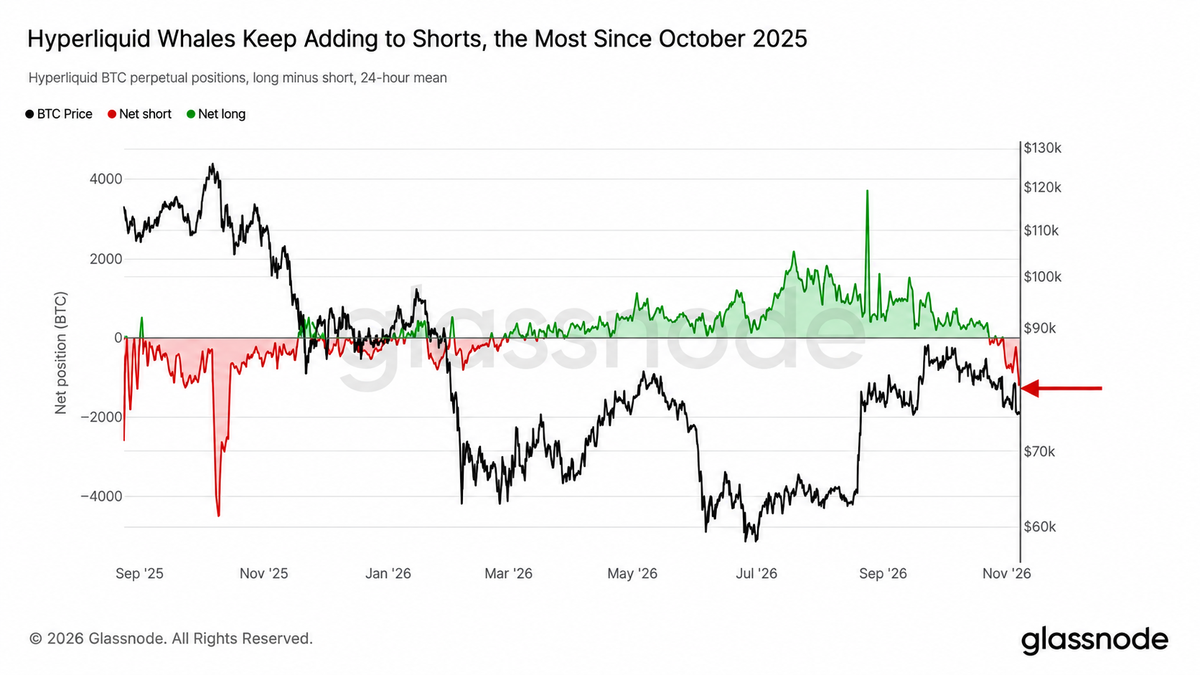
Positioning like this cuts both ways. Glassnode noted that the same group bought well near earlier bottoms, so the shift is a warning sign. It also loads the market with shorts that would need to be covered if price turns up, which is what the liquidation map at the end of this report quantifies.
Sellers in control: CVD at -105,000 BTC
Cumulative volume delta shows whether aggressive market buys or sells dominate futures trading. On Axel Adler Jr.’s basket of 16 comparable contracts, CVD turned negative on October 14 and has since fallen to -105,303 BTC as of November 8.
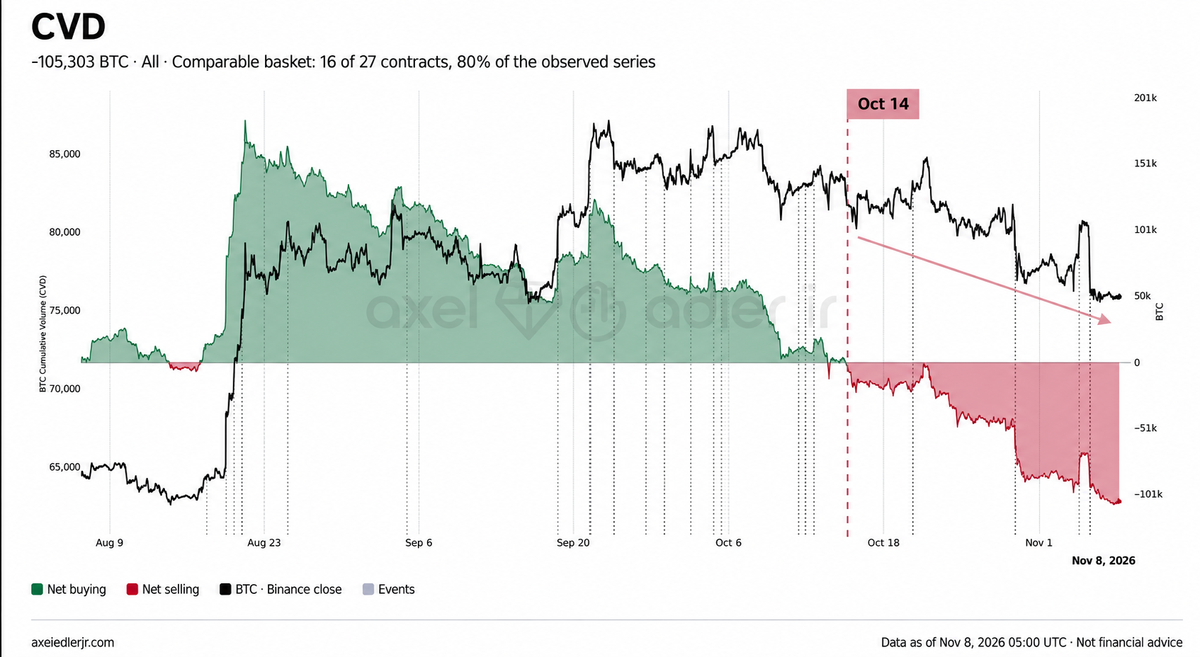
Over the same period Bitcoin slid from about $84,000 to about $75,800 on Binance. The steepest drops in CVD came on October 29 to 30, as the Binance hack hit, and again on November 5, matching the failed rally above $80,000 described in the technical section. As long as this line keeps falling, rebounds run into more aggressive selling than buying.
Strategy back at break-even
Bitcoin now trades almost exactly at Strategy’s average purchase price. After buying 811 BTC at about $80,846 in the week to November 1, the company holds 849,327 BTC at an average cost of $75,451. On-Chain Mind’s treasury MVRV, spot price divided by average cost, sits right at 1.0 on the chart dated November 2.
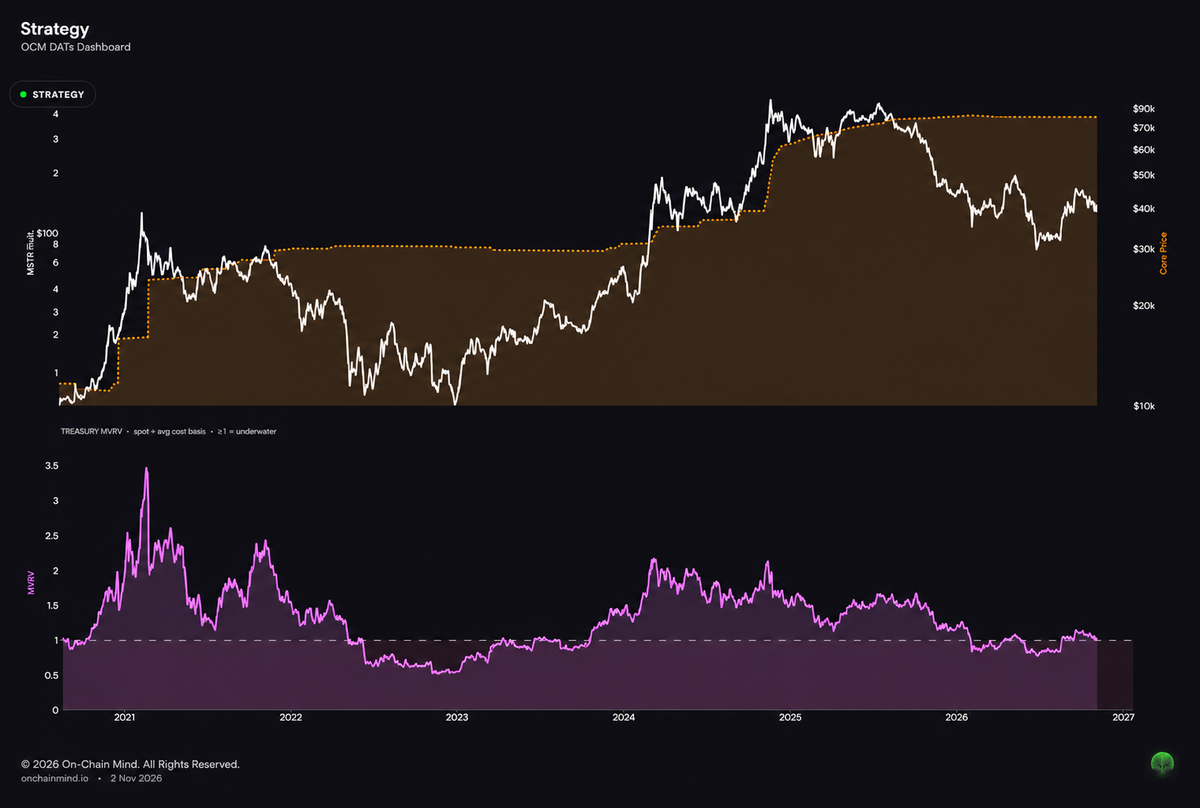
Values below 1 mean the treasury is underwater, and the ratio spent much of January to February and June to August below that line. Excluding financing costs, the position is at break-even, which makes $75,000 more than a technical level: the same zone holds the descending line, the 50-week average and the largest corporate cost basis in the market. A sustained move below it would put Strategy’s holdings back under water.
Liquidation map: short leverage stacks above price
CoinGlass’s 30-day liquidation map, with price at $75,876, is heavily skewed. Estimated cumulative short liquidation leverage builds to roughly $4.5 billion by $80,000 and about $10.5 billion near $84,000, with the largest single cluster around $82,500. On the long side, the cumulative curve reaches only about $2.7 billion all the way down to $67,261, and most of it sits between $73,000 and $75,300.
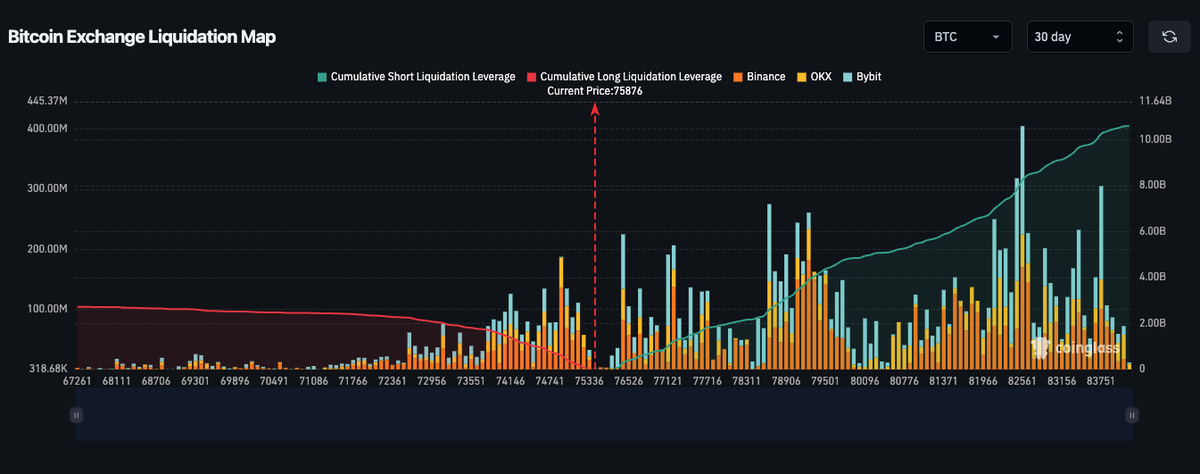
Source: https://www.coinglass.com/pro/futures/LiquidationMap
That asymmetry is the counterweight to the bearish flow above. If price pushes through the first clusters at $76,500 to $77,100, forced short covering could accelerate a move toward $79,000 to $80,000, where the next dense bars sit. A map shows where forced orders rest, not which way price moves, and a break below $75,000 would first clear the long cluster just under the price.
Conclusion
Bitcoin starts the week on a stack of support at $75,000: the descending line, the 50-week average and Strategy’s cost basis. Flow is bearish, with CVD at -105,303 BTC and Hyperliquid whales at their largest net short since October 2025, while sentiment at 26 has not yet reached capitulation. At the same time, about $10.5 billion of short leverage sits above price, so a relief rally toward $80,000 is possible if $75,000 holds, especially if Tuesday’s US CPI comes in soft. Rallies in this downtrend have been short-lived, and a rejection near $80,106 would put $75,000 back under test, with the $70,000 to $75,000 pocket below it. In this structure, position size and stops matter more than distant targets.
Trading involves risk.
Author



 Risk Disclaimer
The content provided here is for informational purposes only. It is not intended as personal investment advice and does not constitute a solicitation or invitation to engage in any financial transactions, investments, or related activities. Past performance is not a reliable indicator of future results.
The financial products offered by the Company are complex and come with a high risk of losing money rapidly due to leverage. These products may not be suitable for all investors. Before engaging, you should consider whether you understand how these leveraged products work and whether you can afford the high risk of losing your money.
The Company does not accept clients from the Restricted Jurisdictions as indicated in our website/ T&C. Some services or products may not be available in your jurisdiction.
The applicable legal entity and its respective products and services depend on the client’s country of residence and the entity with which the client has established a contractual relationship during registration.