7 min read
S&P 500 Drops 2.7% as AI Fears Return After the Midterms
The S&P 500 fell 2.7% last week to 7,376.86, its fourth straight weekly loss. Thursday’s 4.4% plunge was the worst session since April 2025, as investors weighed what the Democratic sweep of Congress means for the AI data center buildout. Friday’s strong payrolls lifted tech and pulled the VIX back to about 25.6, but did not undo the damage. This week brings CPI, PPI, several Fed speakers and results from Cisco and Applied Materials.
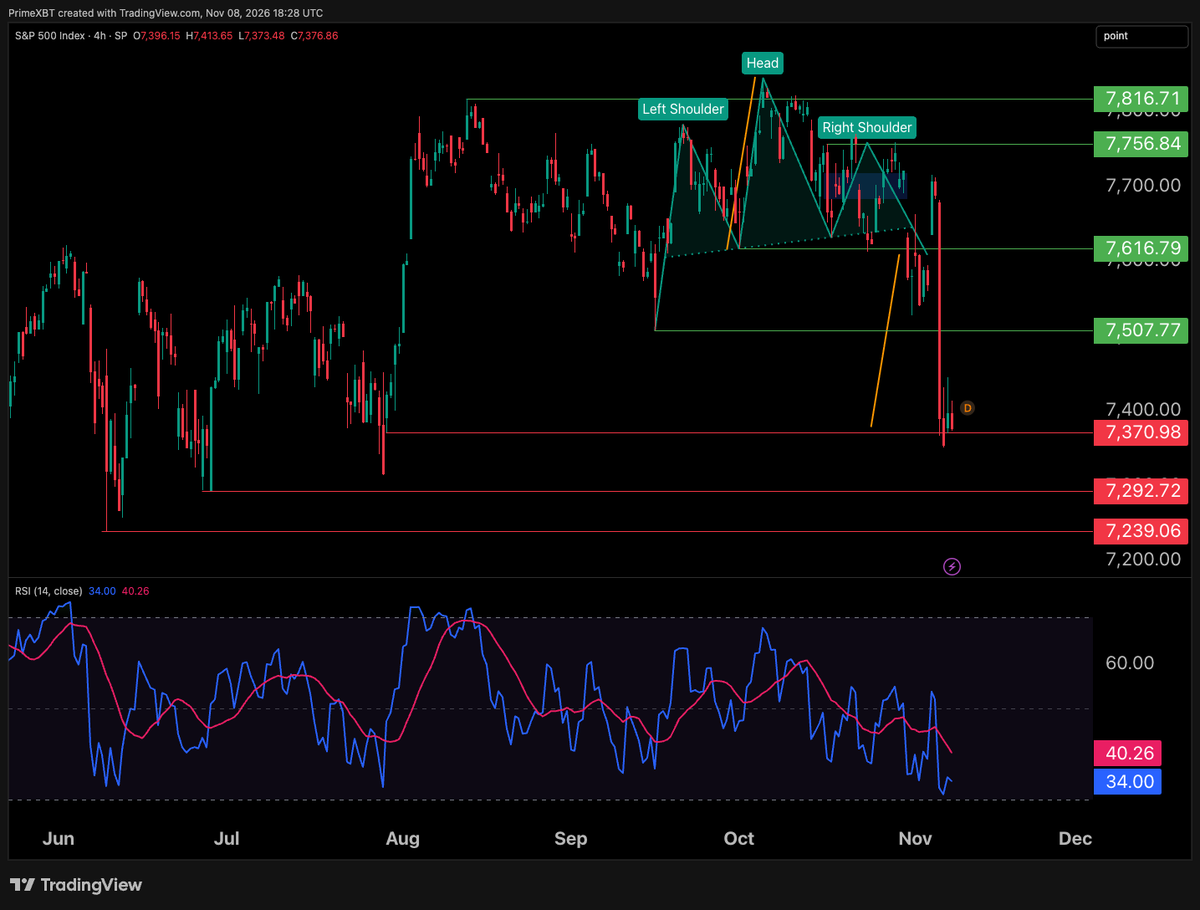
On the chart, the S&P 500 has completed its head and shoulders: Thursday’s collapse ran through 7,507.77 to 7,370.98, the measured target named last week, and Friday closed on that level. With the target met, the pattern offers no fresh signal, and the RSI at 34.0 is weak but not oversold. A close below 7,370.98 would bring the June lows at 7,292.72 and 7,239.06 into view; a rebound would meet 7,507.77 and then the broken neckline at 7,616.79.
WTI Crude Sinks About 13% on De-escalation Bets
WTI crude fell about 13% last week to near $90.4, after settling at $104.12 the Friday before. Democrats won both chambers of Congress, and traders bet on a faster de-escalation of the US-Israeli war with Iran, now in its ninth month; oil lost 8% on Wednesday alone. Renewed tanker attacks in the Strait of Hormuz then triggered a partial rebound. OPEC’s monthly report on Wednesday, EIA inventories on Thursday and the IEA report on Friday are next.
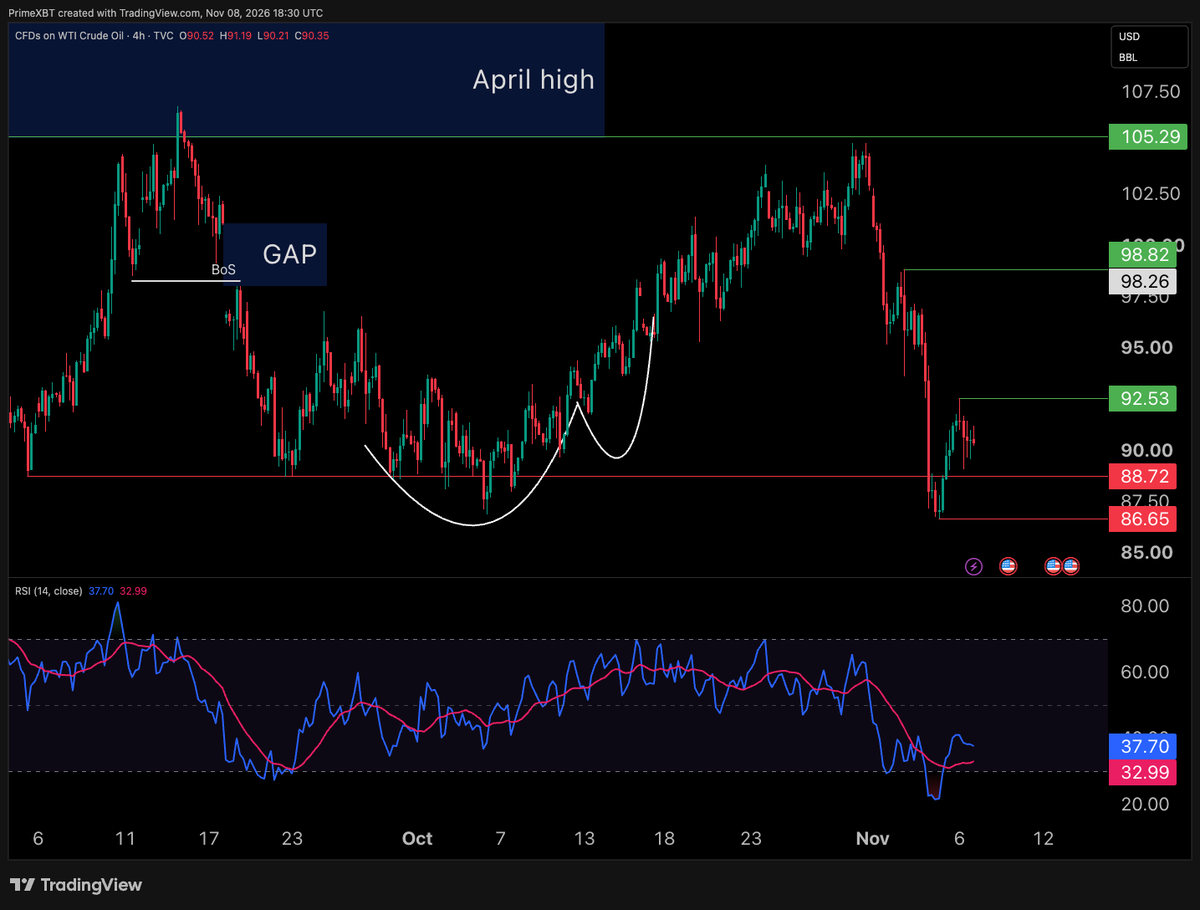
On the chart, WTI crude fell from the 105.29 April high zone to 86.65, with the RSI in the low 20s, and has since steadied between 88.72 and 92.53, ending at $90.35. A break above 92.53 would open the way to 98.82, the high of the early-week bounce. A close below 88.72 and then 86.65 would leave no marked support on the chart, with further de-escalation headlines as the likely trigger.
New Zealand Election Result (Monday Open)
New Zealand’s Saturday election produced no clear winner. Preliminary results give Luxon’s National-led coalition 67 seats in an expanded 131-seat parliament, but about 400,000 special votes remain uncounted, with final results due November 27. The kiwi reopens late on Sunday (GMT) near a 19-month low, after unemployment hit 5.7% and the RBNZ held at 2.75% instead of the expected hike. A confirmed majority would remove one source of uncertainty; a hung parliament or long coalition talks could extend the political discount on the kiwi.
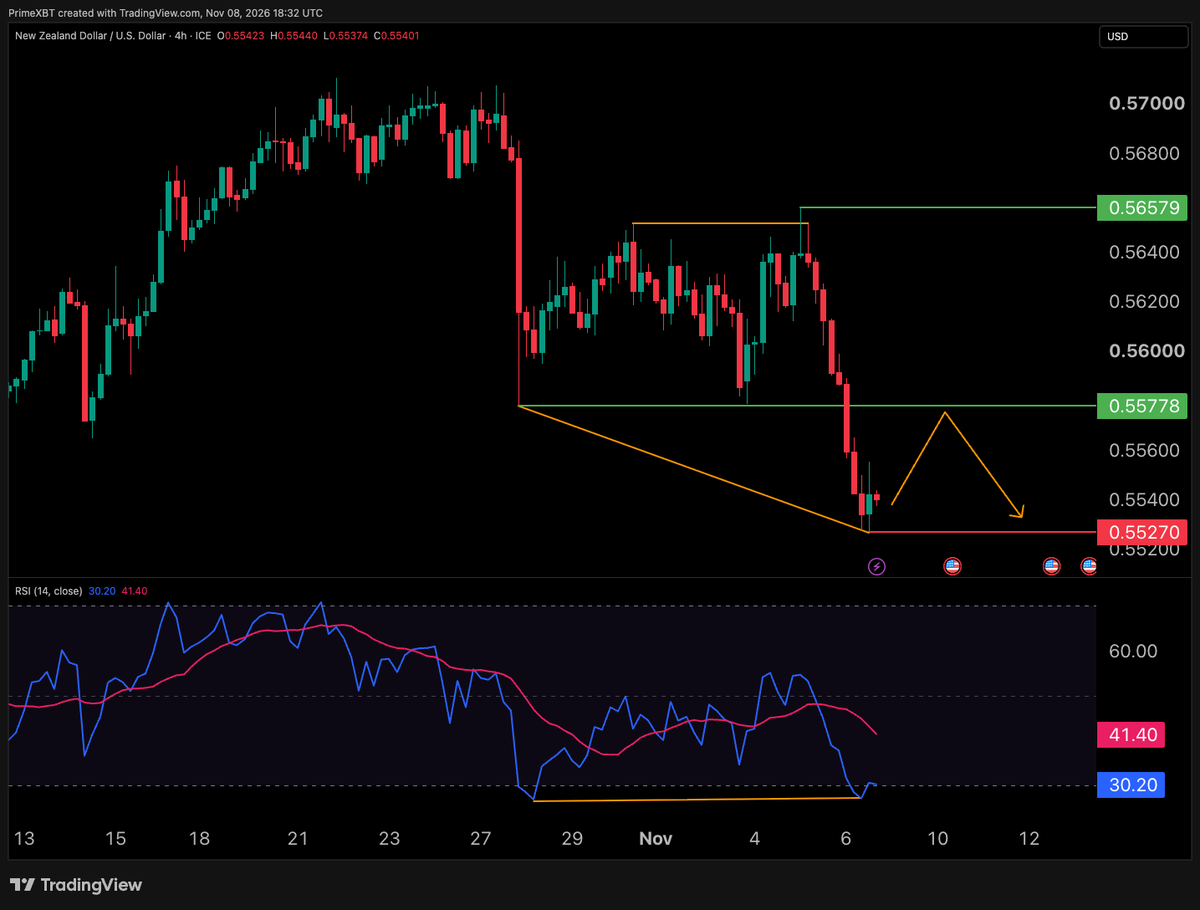
On the chart, NZD/USD broke below 0.55778, the range floor since late October, and set a low at 0.55270. The RSI at 30.2 shows a bullish divergence, as price made a lower low and the RSI did not. The drawn scenario is a rebound to 0.55778, now resistance. If sellers defend it, the path points back to 0.55270 and below; a recovery above 0.55778 would cancel the setup, with 0.56579 next. The election result could open the week with a gap.
US CPI (Tuesday)
October CPI is due on Tuesday at 13:30 GMT. In September, prices rose 0.6% m/m and 3.7% y/y against a 3.6% forecast; the dollar jumped and EUR/USD lost nearly 0.8% toward 1.11. Consensus now sees 0.3% headline and 0.2% core, while RBC expects 0.3% for both. The annual rate may be missing, as no prices were collected in October 2025. A hotter core would harden December hike bets, near 77%, and support the dollar; a softer print could ease them.
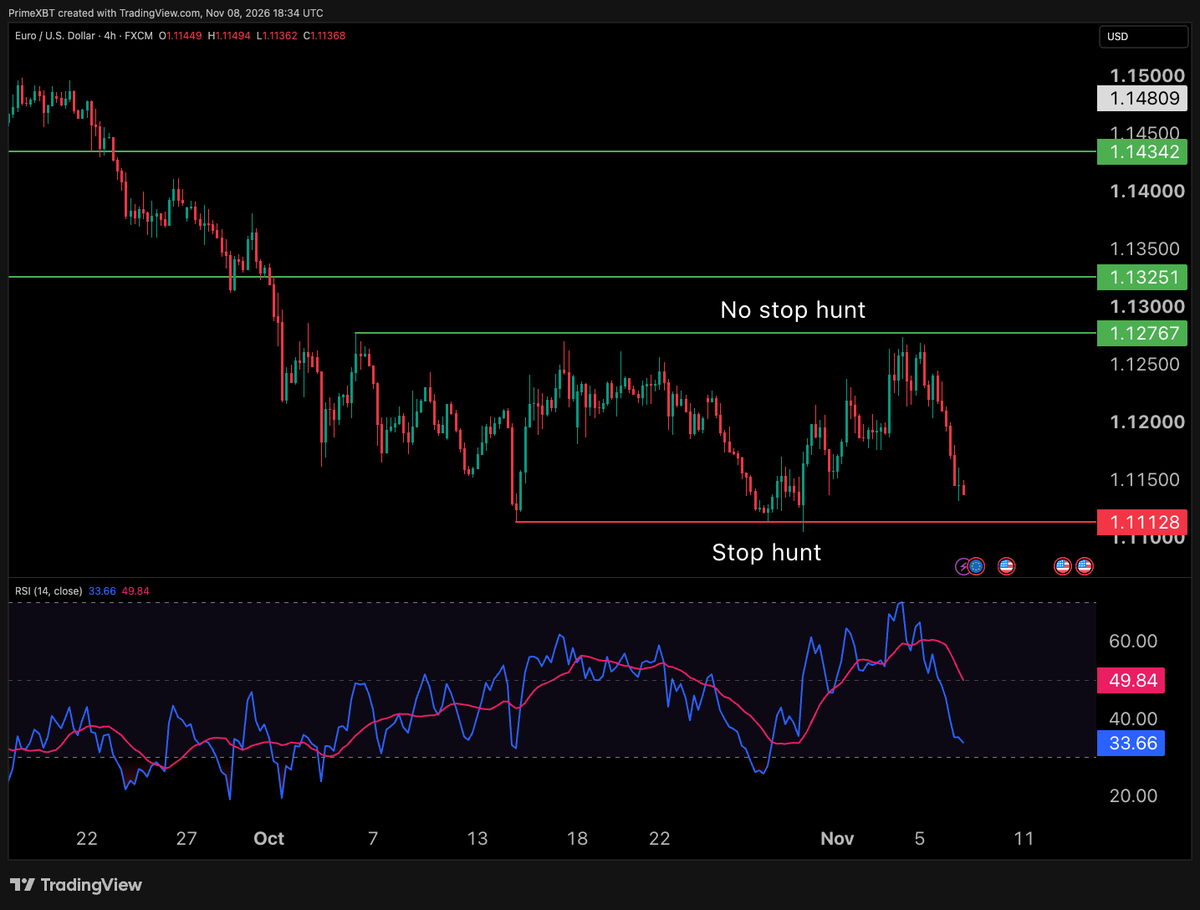
On the chart, EUR/USD stays inside its 1.11128 to 1.12767 range. Last week’s path to 1.12767 played out, but price stalled just under it without the stop hunt seen below 1.11128 in late October, then slid to 1.1137 after payrolls, with the RSI at 33.7. A hot CPI that closes below 1.11128 would end the range. If the floor holds, a return to 1.12767, where stops are untouched, is the natural path. With a hawkish outcome largely expected, an in-line print could see the dollar’s reaction fade quickly.
UK GDP q/q (Thursday)
The ONS publishes Q3 GDP on Thursday at 07:00 GMT. August surprised with 0.1% growth against an expected 0.1% decline, and Q2 grew 0.5%. Consensus sees Q3 at 0.7% q/q, matching the BoE’s own estimate, and September flat. Last week the BoE hiked to 4.00% with all nine members voting to raise, and markets price roughly even odds of another hike in December. Strong growth would support that pricing and sterling; a miss could weigh on both.
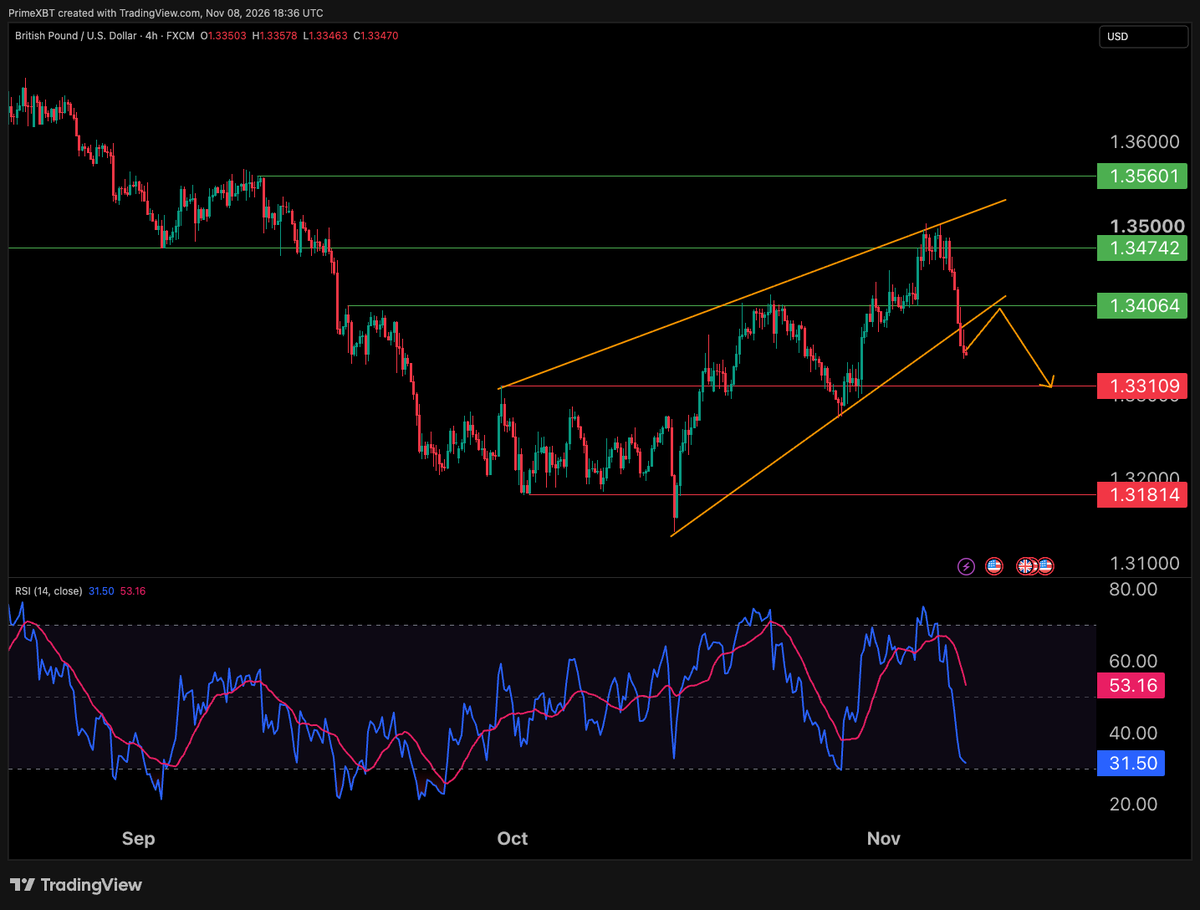
On the chart, GBP/USD hit just above 1.3500 on November 4, past last week’s 1.34742 target, then reversed and broke below the rising wedge that framed the October rally. The RSI at 31.5 is near oversold. The drawn scenario is a pullback to the broken wedge line near 1.34064. If that zone caps the rebound, the path opens to 1.33109 and then 1.31814; a recovery above 1.34742 would void the breakdown.
US PPI m/m (Friday)
October PPI follows on Friday at 13:30 GMT. In September, producer prices jumped 1.3% m/m, the largest gain since March 2022, against a 0.5% to 0.6% forecast, with core up 0.7%; Treasury yields still fell that day. Consensus expects 0.4% headline and 0.3% core, while RBC sees 0.5%. Gold enters the release near $4,075 after a weekly gain of more than 4% from its one-year low. A hot print that lifts yields and the dollar could weigh on gold; a soft one could support it.
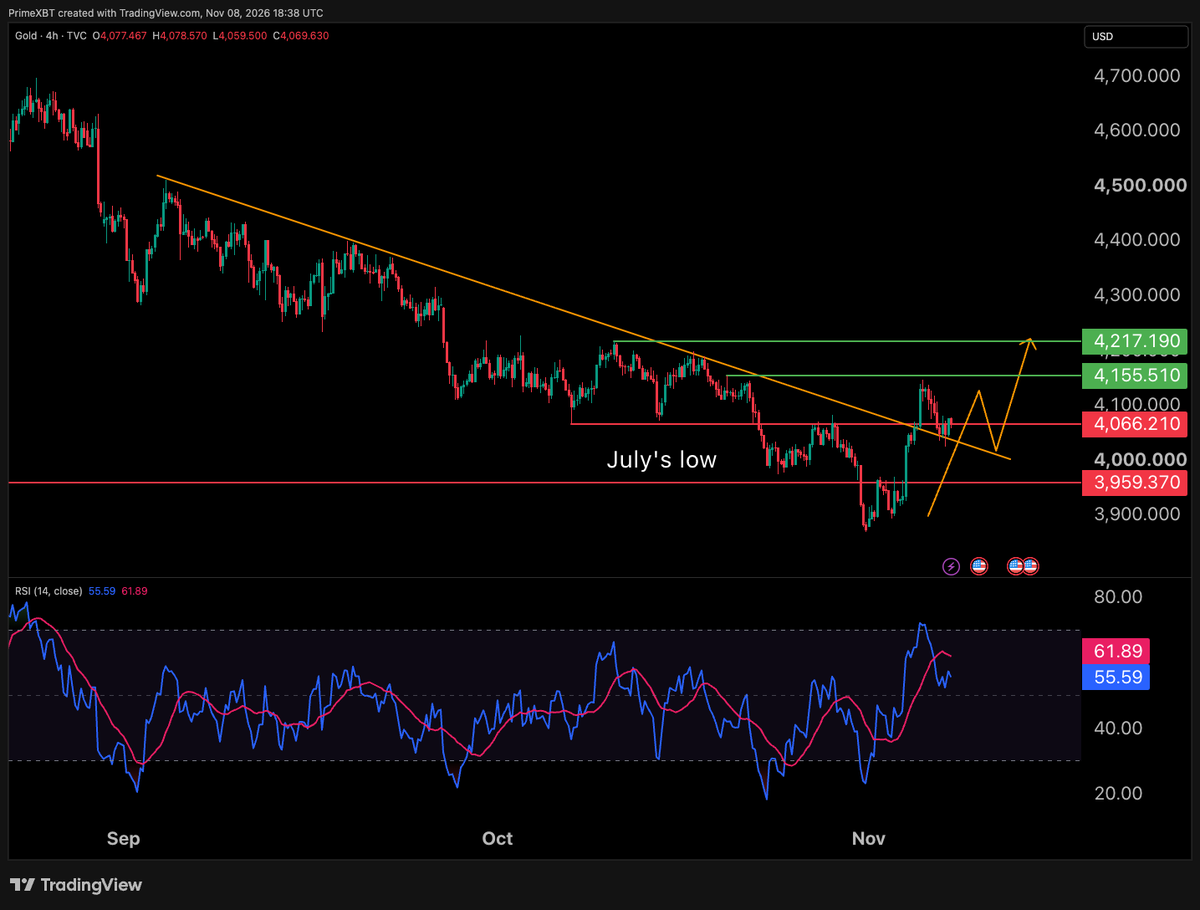
On the chart, Gold broke the descending trendline that had capped every rally since early September and cleared 4,066.21, the level named last week as the trigger for a change in structure. After a run to about 4,146, price is retesting the line and 4,066.21, with the RSI cooled to 55.6. If the retest holds, the drawn path points to 4,155.51 and then 4,217.19. A close back below both would mark a false breakout and put 3,959.37 back in focus.
Bottom line
The S&P 500 has reached its head and shoulders target, oil is consolidating after a 13% drop, and the dollar has pushed EUR/USD, GBP/USD and NZD/USD to or through the lower edge of their ranges. Tuesday’s CPI at 13:30 GMT is the main event, with UK GDP and PPI adding two more volatility windows, and gold’s trendline retest is the setup most sensitive to the data. With several charts on decision levels at once, position size and stops deserve extra care.
Trading involves risk.
Author



 Risk Disclaimer
The content provided here is for informational purposes only. It is not intended as personal investment advice and does not constitute a solicitation or invitation to engage in any financial transactions, investments, or related activities. Past performance is not a reliable indicator of future results.
The financial products offered by the Company are complex and come with a high risk of losing money rapidly due to leverage. These products may not be suitable for all investors. Before engaging, you should consider whether you understand how these leveraged products work and whether you can afford the high risk of losing your money.
The Company does not accept clients from the Restricted Jurisdictions as indicated in our website/ T&C. Some services or products may not be available in your jurisdiction.
The applicable legal entity and its respective products and services depend on the client’s country of residence and the entity with which the client has established a contractual relationship during registration.