
 8 min read
 Technical picture
Bitcoin closed the four-hour candle at 77,312, up 209 points or 0.27% on the session, inside a range of 77,102 to 77,376. The sideways action is holding above the imbalance and above the support band that runs from 76,229 down through 75,568 into the 73,000 area. Price peaked at 82,283 on September 3 and tagged 79,890 on September 12 before rolling back, so this week has been a controlled give-back rather than a breakdown.
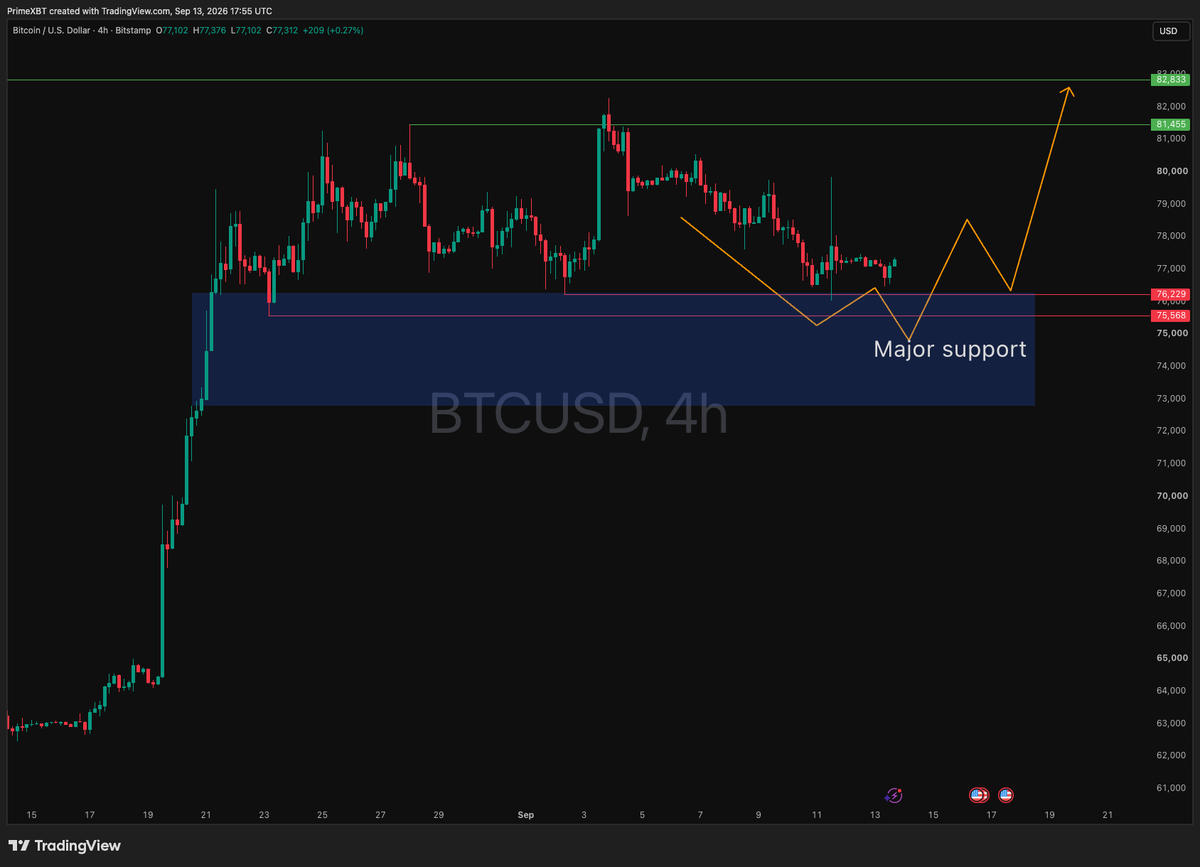
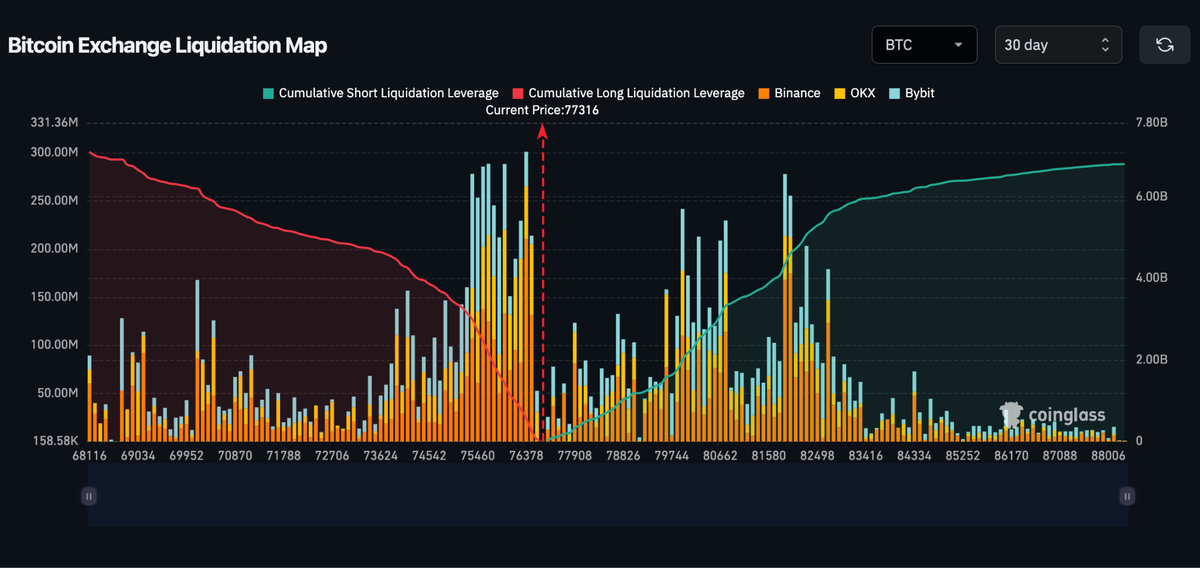
The structure favours the buyers while the blue zone holds. A turn from here puts the green levels at 81,455 and 82,833 back in reach, and a golden cross printed on September 11 when the 50-day EMA crossed the 200-day, though it stays unconfirmed under 80,000. A loss of the zone opens the road toward the round 70,000 handle, a deep reset ahead of the October window before the November 3 midterms. The liquidation map below shows where that flush would find fuel.
Crypto heatmap
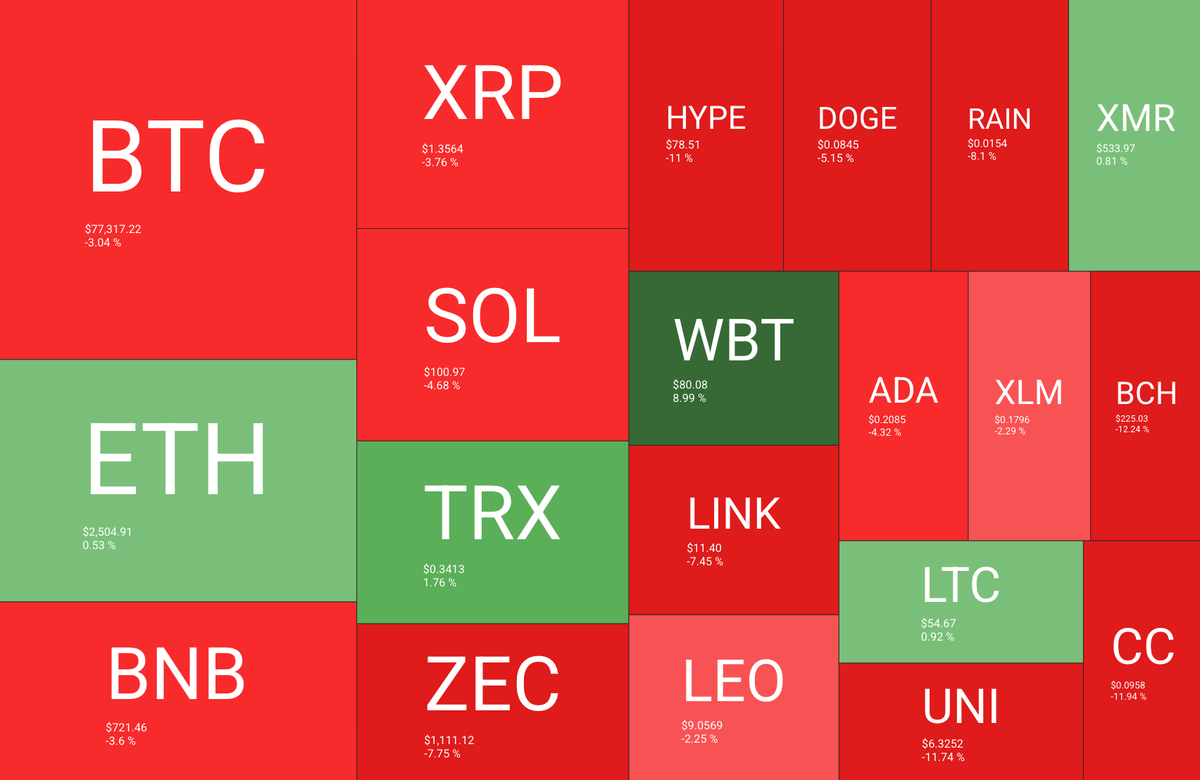
The snapshot is mostly red, but the damage is uneven. Bitcoin shows 77,317.22 and minus 3.04%, while Ethereum holds green at 2,504.91 and plus 0.53%. The rest of the majors sit in low single-digit losses: SOL minus 4.68% at 100.97, XRP minus 3.76%, BNB minus 3.6%.
Source: https://quantifycrypto.com/heatmaps
The high-beta names carry the real losses. BCH is down 12.24%, CC down 11.94%, UNI down 11.74% and HYPE down 11%. WBT is the outlier on the other side at plus 8.99%. That spread, majors down 3% and speculative names down 11% or more, reads as a leverage flush rather than broad capitulation, and Ethereum staying green against a red Bitcoin is the detail worth carrying into the altcoin section below.
Altcoin Season Index
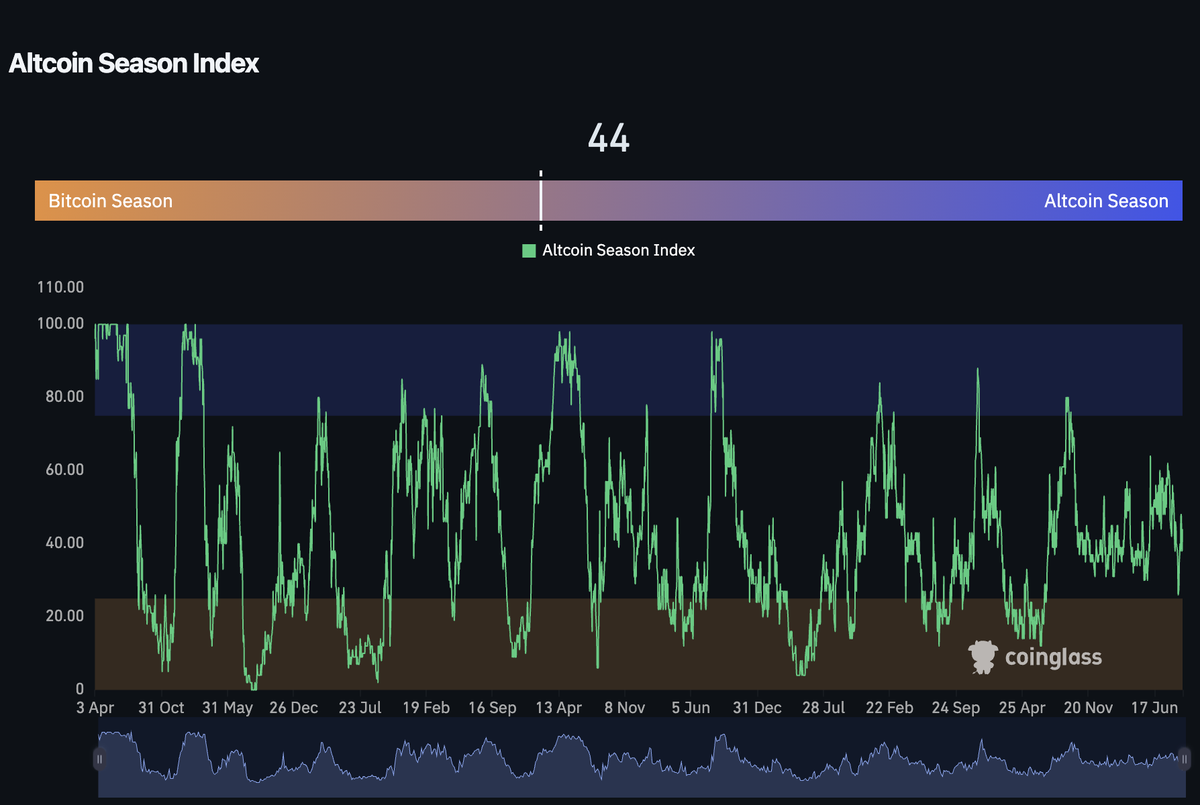
The index reads 44, up from 34 at the start of September. It is still firmly inside Bitcoin Season territory, which begins to flip only above 75.
Source: https://www.coinglass.com/pro/i/alt-coin-season
Positioning has moved faster than performance. Altcoin open interest overtook Bitcoin open interest on September 6 for the first time since December 2024, roughly 40 billion against 23.9 billion, which left Bitcoin at 37% of the combined total. The last time that crossover happened, several mid-caps corrected in the following weeks. Set against the heatmap above, where the speculative names took double-digit losses, that leverage is not yet backed by spot demand.
Fear and Greed Index
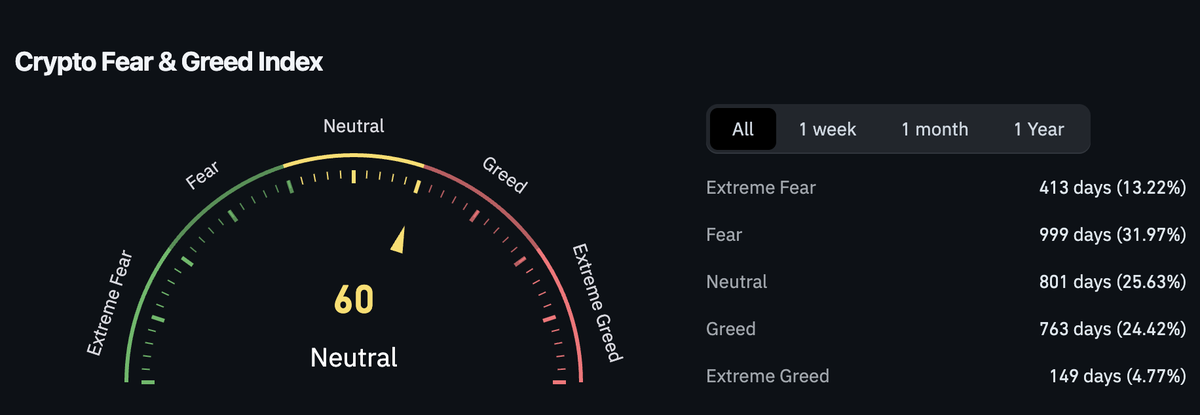
The index has cooled to 60, a reading the gauge still labels Neutral. The peak of this move was 74 on August 25, and it was still holding 69 to 71 as recently as September 8. Alternative.me prints 63 on the same day, and CryptoQuant’s own sentiment gauge briefly touched 89 out of 100, its highest since March 2024.
Source: https://www.coinglass.com/pro/i/FearGreedIndex
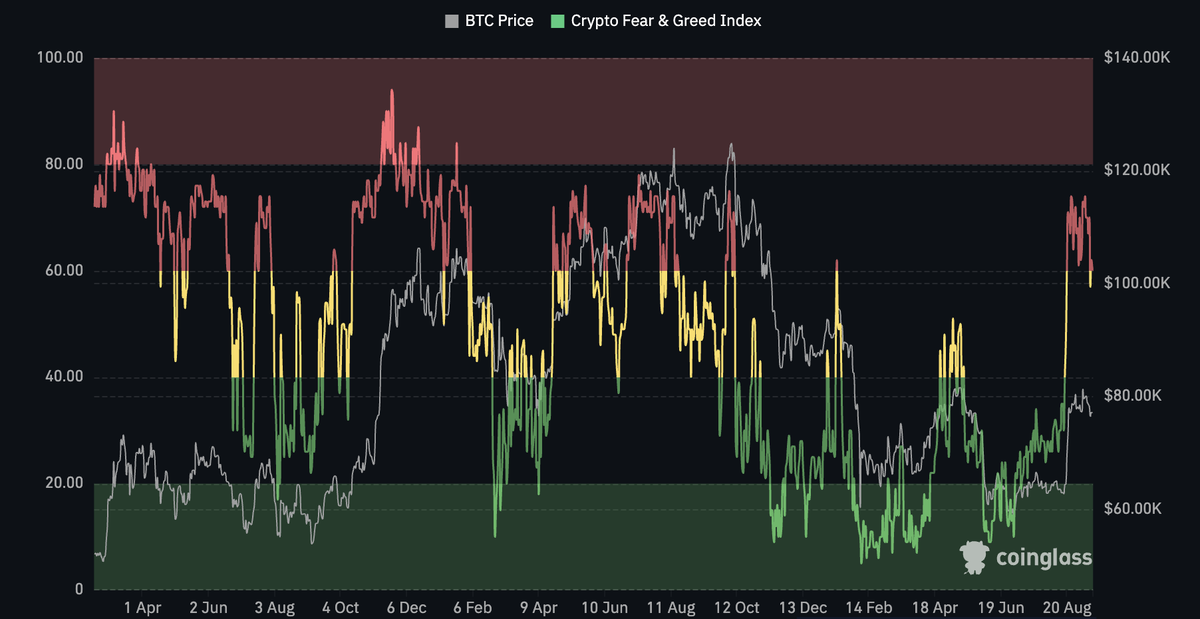
The history is the useful part. Across the full record the index has spent 999 days in Fear and 801 in Neutral, against 763 in Greed and only 149 in Extreme Greed. A reading of 74 normally shows up near a cycle high, not with Bitcoin roughly 38% below its 126,198 record, so the cooling to 60 closes a gap between sentiment and price rather than opening one. Resets of this type have preceded continuation before, which is the case the demand data below has to support.
The Fed decision that frames the week
The FOMC announces on Wednesday, September 16 at 19:00 GMT+1, with the updated projections and Chair Kevin Warsh’s press conference at 19:30. The target range is 3.50% to 3.75%, and futures put the odds of a quarter-point hike between 85% and 87% after the August CPI report showed core inflation at 0.3% month over month against the 0.2% consensus. The July meeting already carried three dissents in favour of a hike.
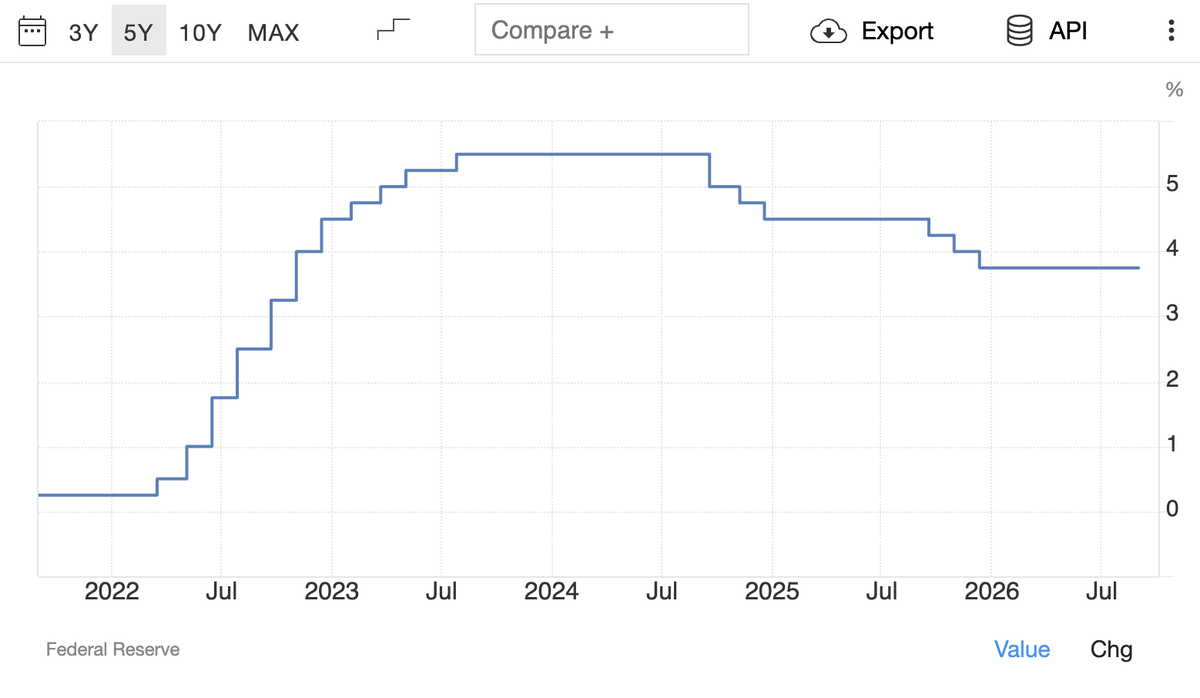
The chart shows the path: a 5.50% plateau through most of 2024, then steps down to a level flat since early 2026. A hike reverses that direction for the first time in the cycle. For Bitcoin the transmission runs through real yields and the dollar, so a hike with a hawkish dot plot keeps the pressure on, while a hold would be the surprise. The political overlay is live. Trump appointed Warsh expecting cuts and said on August 31 that Warsh will do what he has to do, while adding that rates are too high. With the midterms on November 3, the administration wants an easing cycle inflation is not permitting. The CLARITY Act cloture vote on September 15, needing 60 Senate votes, adds a second catalyst the day before.
Bitcoin demand is stabilizing, not expanding
Bitcoin may be moving from demand contraction into demand stabilization rather than into demand expansion. The 30-day apparent demand metric has crossed back above zero after a long negative stretch, which is the first positive print since the spring.
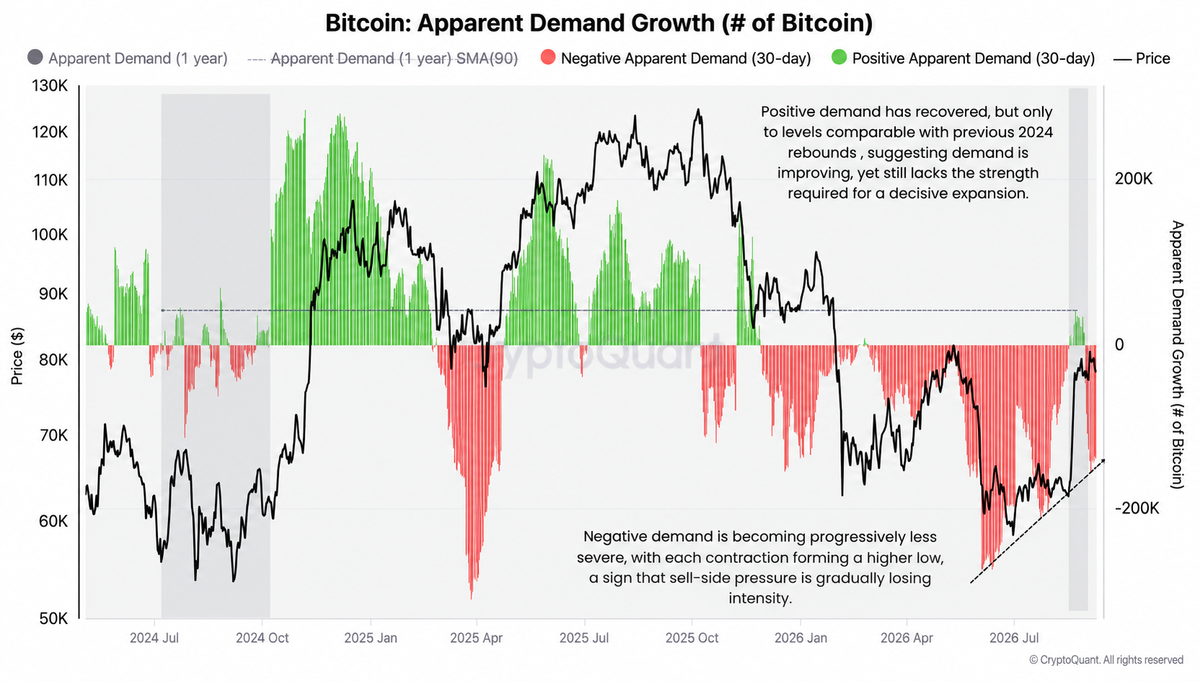
Two details keep the read honest. Positive demand has recovered only to levels comparable with previous 2024 rebounds, improving without the strength a decisive expansion needs. Each negative contraction has formed a higher low, which says sell-side pressure is losing intensity rather than buy-side conviction arriving. The ETF tape agrees: US spot funds shed 462.7 million dollars between September 8 and 11, every session negative, with 282.7 million leaving on Thursday and ARKB accounting for 234.2 million of the week.
Open interest divergence
Open interest has rebuilt to the level it last held in early February, when Bitcoin traded near 95,000. Price is 18,000 below that, so positioning has recovered far faster than the spot market has.
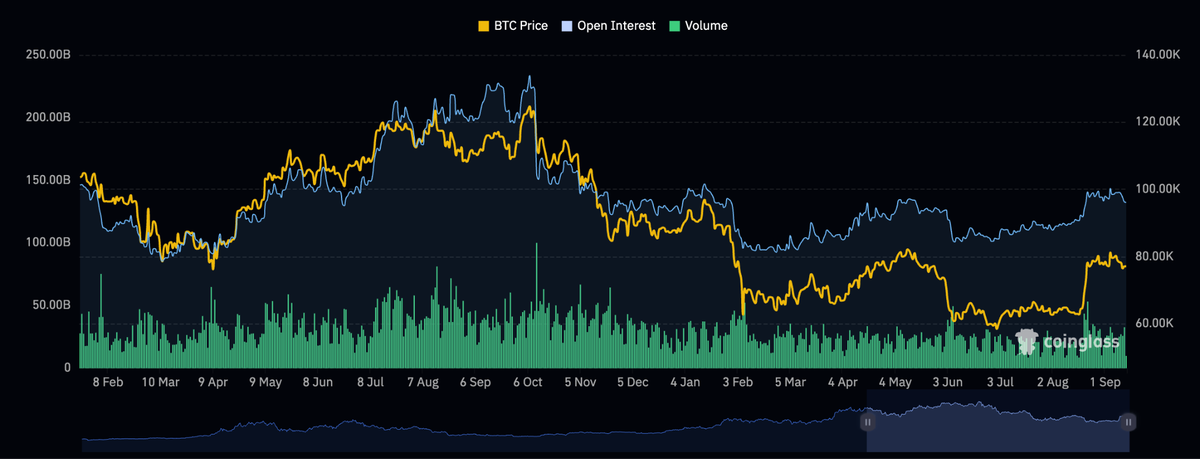
One reading is that Bitcoin is cheap relative to the leverage standing behind it. The other is that a crowded book over a soft spot bid is the configuration that produces violent moves either way, and the section above says the spot bid is only stabilizing. Volume offers no help, sitting close to its run-rate. Where that leverage sits is the question the liquidation map answers.
Bitcoin liquidation map
With price at 77,316, the densest cluster of leveraged positions sits immediately below, between roughly 75,460 and 76,378, where single bars reach 250 to 300 million dollars and Bybit carries most of the size.
Source: https://www.coinglass.com/pro/futures/LiquidationMap
That cluster lands on the same support band the technical section opened with, which is why a sweep of it would be mechanically attractive before any move higher. The honest caveat is that the map is not one-sided: cumulative leverage runs to roughly 7 billion dollars in both directions over the 30-day window, and a second dense pocket sits at 81,580 to 82,498, right where the green targets from the first chart are. Liquidity below is closer, not larger.
Conclusion
Three threads, and they do not pull the same way. The technical setup is constructive while the support band holds, and the liquidation cluster just under it gives the market a reason to reach for that level first. Sentiment has cooled from 74 to 60, closing the gap with price. Against that, demand is stabilizing rather than expanding, ETFs pulled 462.7 million dollars out last week, and open interest has rebuilt to levels that do not match a 77,000 spot price. Wednesday resolves the largest unknown. Keep leverage small into it.
Trading involves risk.
Author



 Risk Disclaimer
The content provided here is for informational purposes only. It is not intended as personal investment advice and does not constitute a solicitation or invitation to engage in any financial transactions, investments, or related activities. Past performance is not a reliable indicator of future results.
The financial products offered by the Company are complex and come with a high risk of losing money rapidly due to leverage. These products may not be suitable for all investors. Before engaging, you should consider whether you understand how these leveraged products work and whether you can afford the high risk of losing your money.
The Company does not accept clients from the Restricted Jurisdictions as indicated in our website/ T&C. Some services or products may not be available in your jurisdiction.
The applicable legal entity and its respective products and services depend on the client’s country of residence and the entity with which the client has established a contractual relationship during registration.








